. 2020 Jan 17:7:366.
doi: 10.3389/fcell.2019.00366. eCollection 2019.

Quantitative Intracellular pH Determinations in Single Live Mammalian Spermatozoa Using the Ratiometric Dye SNARF-5F

Affiliations

Quantitative Intracellular pH Determinations in Single Live Mammalian Spermatozoa Using the Ratiometric Dye SNARF-5F

Julio C Chávez et al. Front Cell Dev Biol. .

Abstract

Intracellular pH (pH i ) plays a crucial role in mammalian sperm physiology. However, it is a challenging task to acquire quantitative single sperm pH i images due to their small size and beating flagella. In this study, we established a robust pH i imaging system using the dual-emission ratiometric pH indicator, SNARF-5F. Simultaneous good signal/noise ratio fluorescence signals were obtained exciting with a green high-power LED (532 nm) and acquiring with an EM-CCD camera through an image splitter with two band-pass filters (550-600 nm, channel 1; 630-650 nm, channel 2). After in vivo calibration, we established an imaging system that allows determination of absolute pH i values in spermatozoa, minimizing cell movement artifacts. Using this system, we determined that bicarbonate increases non-capacitated human pH i with slower kinetics than in mouse spermatozoa. This difference suggests that distinct ionic transporters might be involved in the bicarbonate influx into human and mouse spermatozoa. Alternatively, pH i regulation downstream bicarbonate influx into spermatozoa could be different between the two species.

Keywords: alkalization; dual emission; image splitter; intracellular pH; ratiometric; spermatozoa.


Figures

FIGURE 1
FIGURE 1
SNARF-5F emission spectra at 488 and 532 nm excitation wavelengths, in 50 mM potassium phosphate buffers at various pH values. Emission spectra of non-permeable SNARF-5F (A) using a fixed excitation wavelength of 488 nm (A,left) and 532 nm (A,right). Emission spectra of SNARF-5F-AM (B) with 10 × 106 sperm/ml treated with 0.1% Triton X-100, using a fixed excitation wavelength of 488 nm (B,left) and 532 nm (B,right). The lines are representative fluorescence spectra at different pHe (5.5, 6.0, 6.4, 6.8, 7.0, 7.2, 7.4, 7.8, and 8.2), indicated by color lines. (C) SNARF-5F chemical structure. Typically, SNARF-5F possess two emission wavelengths, at 575 and 640 nm; n = 4.
FIGURE 2
FIGURE 2
Imaging set-up configuration to visualize the dual emission wavelengths of SNARF-5F. Diagram of imaging set-up (A), indicating LED (532 nm) or laser (488 nm) as an illumination source. A different excitation cube (green square) was used for the LED set-up (ET 530/30X, dichroic mirror DC 550 LP) and the laser set-up (D485/25X, dichroic DC510 LP). To visualize at the same time the two emission wavelengths of SNARF-5F, we used an image splitter (in purple), which has an emission cube (orange square) (ET575/50M, ET640/20M, and dichroic mirror DC610 LP), that divides the emission in reflected (channel 1, corresponding to emission wavelength 575 nm) or transmitted (channel 2, corresponding to emission wavelength 640 nm) images. The image splitter is coupled to the microscope on one side, and to the detector (CCD camera) on the other. Fluorescence images obtained from epifluorescence (laser set-up) microscope with 60× (Plan Apo N, 1.49 numerical aperture) objective, using 20 μM non-permeable SNARF-5F (B) or 20 μM SNARF-5F-AM loaded in human and mouse (not shown) spermatozoa in the presence of nigericin 10 μM (C) in 50 mM potassium phosphate buffers at indicated pH. (D) Ratio values were obtained (referred from panel C) at each pHe (6.0, 6.5, 7.0, 7.5, and 8.0) in human and mouse spermatozoa, using channel 1 (575 nm) and channel 2 (640 nm) fluorescence values. (E) Lineal correlation between pHe and fluorescence ratio in human and mouse spermatozoa, obtaining R2 = 0.99 and 0.98, respectively. Numbers 1 (yellow) and 2 (red) to the left in panels B and C refer to channel 1 (emission 575 nm) and channel 2 (emission 640 nm). Scale bar in panels B and C is equal to 10 μm; n = 3.
FIGURE 3
FIGURE 3
Time-lapse experiments in the microscope set-up did not cause significant photobleaching in mammal spermatozoa, using LED or laser as an illumination source. Representative recordings from emission wavelength time lapse experiments, using 20 μM SNARF-5F-AM in human spermatozoa. Images were taken every 200 ms, exposure time 4 ms with 60× objective. An image splitter was used for the experiments, allowing us to measure emission fluorescence at 575 (left) and 640 (center) nm, and obtaining the ratio from both wavelengths (right). The illumination source was LED 532 (A) or laser 488 nm (B,C), in the epifluorescence (A,B) or TIRF 100 nm (C) configuration. Traces in each panel show representative single cell pHi. Same color at both emission wavelengths indicates the same cell; n = 3.
FIGURE 4
FIGURE 4
Comparison between epifluorescence and total internal reflection fluorescence (TIRF) images. Representative images from human (A) and mouse (B) spermatozoa in the two emission channels for SNARF-5F dye, 640 (red) and 575 nm (yellow). Images were taken using the epifluorescence (center) or TIRF (right) configuration. For reference, brightfield images (left) are shown. Scale bar is equal to 10 μm. Reference bar for fluorescence intensity is also depicted. Scale bar is equal to 10 μm; n = 3.
FIGURE 5
FIGURE 5
It is possible to measure pHi using SNARF-5F in human spermatozoa, in the head and flagellum regions. Representative recordings from head (A) and flagellum (B) regions, measuring fluorescence changes at the two emission wavelengths of SNARF-5F, 575 (Top left) and 640 nm (Top right). Ratio recordings (Bottom left) are obtained from both emission fluorescence values, and converted to pHi (Bottom right) utilizing the calibration curve as shown in Figure 2. The micropipette manual addition of HTF medium (control), 10 mM NH4Cl, and 5 mM HCl is indicated by arrows in each panel. Traces in each panel show representative single cell pHi responses. Same color at both emission wavelengths and in both regions (head and flagellum) correspond to the same cell; n = 3.
FIGURE 6
FIGURE 6
It is possible to measure pHi using SNARF-5F in mouse spermatozoa, in the head and flagellum regions. Representative fluorescence recordings from head (A) and flagellum (B) regions, measuring changes at the dual emission wavelengths of SNARF-5F, 575 (Top left) and 640 nm (Top right). Ratio recordings (Bottom left) are obtained from both emission fluorescence values, and converted to pHi (Bottom right) using the calibration curve shown before. The micropipette manual addition of TYH medium (control), 10 mM NH4Cl, and 5 mM HCl are indicated by arrows in each panel. Traces in each panel show representative single cell pHi. The same color at both emission wavelengths and in both regions (head and flagellum) correspond to the same cell; n = 3.
FIGURE 7
FIGURE 7
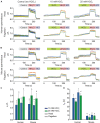
HCO3- increased pHi in a concentration-dependent manner in both, head and flagellum, regions using human and mouse spermatozoa. Representative recordings from human (A) and mouse (B) spermatozoa, measuring pHi using 20 μM SNARF-5F in head (Top) and flagellum (Bottom) regions. The perfused addition of medium (HTF and TYH for human and mouse, respectively) (left, control in gray rectangle), 10 (center in green rectangle) or 25 mM (right in green rectangle) HCO3- are showed. As positive controls, perfused addition of 10 mM NH4Cl (red rectangle) and 5 mM HCl (purple rectangle) are showed in each panel. Traces in each panel show representative single cell pHi. Same color in both, head and flagellum, indicate to the same cell. Maximum change in pHi (ΔpHi) (C) and average of t50 (D), time to reach 50% of the maximum fluorescent intensity, before and after 10 (blue bars), 25 (green bars) mM HCO3- addition, in head (shaded) or flagellum (diagonal lines) regions. The bars in C,D indicated means ± SEM. Different letters indicate significant differences at the p ≤ 0.05 level, according to Mann–Whitney U-test; n = 5.
FIGURE 8
FIGURE 8
Progesterone did not changed pHi in human spermatozoa. Representative recordings using 20 μM SNARF-5F in human spermatozoa in the head (A) and flagellum (B) regions. Micropipette manual progesterone (Prog) additions of 500 nM (I), 1 μM (II), and 10 μM (III), as well as 1 μM of monensin (Monen) (IV) are indicated by arrows in each panel. As controls, 10 mM NH4Cl and 5 mM HCl additions were performed (see arrows). Traces in each panel show representative single cell pHi. The same color at both emission wavelengths and in both regions (head and flagellum) corresponds to the same cell; n = 3.

Similar articles

Cited by

References

    1. Achikanu C., Pendekanti V., Teague R., Publicover S. (2018). Effects of pH manipulation, CatSper stimulation and Ca2+-store mobilization on [Ca2+]i and behaviour of human sperm. Hum. Reprod. 33 1802–1811. 10.1093/humrep/dey280 - DOI - PubMed
    1. Acott T. S., Carr D. W. (1984). Inhibition of bovine spermatozoa by caudal epididymal fluid: ii. interaction of pH and a quiescence factor. Biol. Reprod. 30 926–935. 10.1095/biolreprod30.4.926 - DOI - PubMed
    1. Babcock D. F. (1983). Examination of the intracellular ionic environment and of ionophore action by null point measurements employing the fluorescein chromophore. J. Biol. Chem. 258 6380–6389. - PubMed
    1. Baker M. A., Aitken R. J. (2004). The importance of redox regulated pathways in sperm cell biology. Mol. Cell. Endocrinol. 216 47–54. 10.1016/j.mce.2003.10.068 - DOI - PubMed
    1. Balderas E., Sánchez-Cárdenas C., Chávez J. C., De La Vega Beltrán J. L., Gómez-Lagunas F., Treviño C. L., et al. (2013). The anti-inflammatory drug celecoxib inhibits t-type Ca2+ currents in spermatogenic cells yet it elicits the acrosome reaction in mature sperm. FEBS Lett. 587 2412–2419. 10.1016/j.febslet.2013.05.068 - DOI - PubMed

LinkOut - more resources