. 2020 Jan 17:7:383.
doi: 10.3389/fcell.2019.00383. eCollection 2019.

Membrane Potential Assessment by Fluorimetry as a Predictor Tool of Human Sperm Fertilizing Capacity

Affiliations

Membrane Potential Assessment by Fluorimetry as a Predictor Tool of Human Sperm Fertilizing Capacity

Carolina Baro Graf et al. Front Cell Dev Biol. .

Abstract

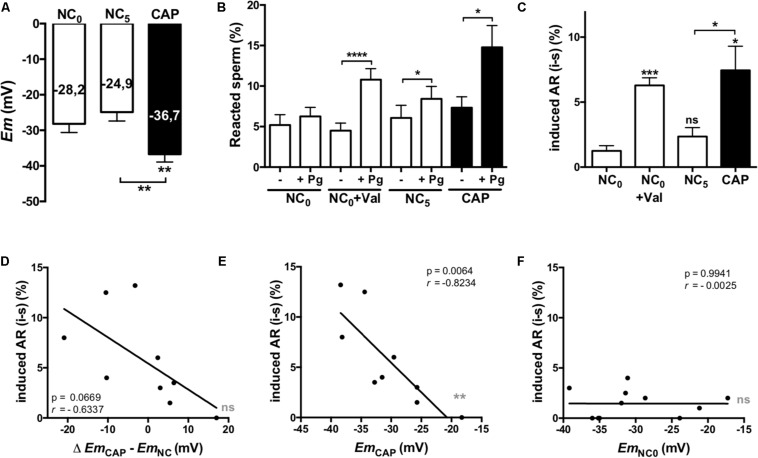
Mammalian sperm acquire the ability to fertilize eggs by undergoing a process known as capacitation. Capacitation is triggered as the sperm travels through the female reproductive tract. This process involves specific physiological changes such as rearrangement of the cell plasma membrane, post-translational modifications of certain proteins, and changes in the cellular permeability to ions - with the subsequent impact on the plasma membrane potential (Em). Capacitation-associated Em hyperpolarization has been well studied in mouse sperm, and shown to be both necessary and sufficient to promote the acrosome reaction (AR) and fertilize the egg. However, the relevance of the sperm Em upon capacitation on human fertility has not been thoroughly characterized. Here, we performed an extensive study of the Em change during capacitation in human sperm samples using a potentiometric dye in a fluorimetric assay. Normospermic donors showed significant Em hyperpolarization after capacitation. Em values from capacitated samples correlated significantly with the sperm ability to undergo induced AR, highlighting the role of hyperpolarization in acrosomal responsiveness, and with successful in vitro fertilization (IVF) rates. These results show that Em hyperpolarization could be an indicator of human sperm fertilizing capacity, setting the basis for the use of Em values as a robust predictor of the success rate of IVF.

Keywords: acrosome reaction; human infertility; in vitro fertilization; membrane potential; sperm capacitation.


Figures

FIGURE 1
FIGURE 1
Determination of the Em of sperm samples by a fluorimetric assay. Non-capacitated (NC) and capacitated (CAP) human sperm from normospermic (n = 49) and non-normospermic (n = 11) donors. (A) Representative fluorescence traces showing Em values. (B) Distribution and mean Em values obtained in each condition. (C) Plots of the change on Em obtained upon capacitation (Δ EmCAPEmNC). The samples with a positive difference were classified as depolarizing, the ones with a negative difference as hyperpolarizing and those which did not change or with a difference under 5 mV where classified as unchanged. (D) Representation of the three types of behaviors among normospermic and non-normospermic donors. (E) Pooled Em values from hyperpolarizing (n = 29), depolarizing (n = 18) and unchanged (n = 13) samples. Data represent mean ± SD. Paired Student’s t test was performed between NC and CAP: p < 0.05, ****p < 0.0001.
FIGURE 2
FIGURE 2
Hyperpolarized membrane potentials correlate with acrosomal responsiveness. Sperm samples from normospermic donors obtained after swim-up (NC0) and upon 5 h incubation in non-capacitating (NC5) and capacitating (CAP) media were analyzed. (A) Em measurements. (B,C) Cells were further incubated for 30 min in the absence (-) or presence (+) of 21 μM progesterone (Pg). The percentage of acrosome reacted sperm was assessed by FITC-PSA staining as described in section “Materials and Methods.” Data represent mean ± SEM from at least six independent experiments. Paired Student’s t test was performed. Statistically significant differences between the indicated conditions or with the control NC0 (asterisks on each column bar) are as follows: p < 0.05, ∗∗p < 0.01, ∗∗∗p < 0.005, ****p < 0.0001. (D–F) Correlation analysis between the change on Em (D, Δ EmCAPEmNC0) or the Em values in CAP (E) and NC0 (F) and the induced AR. The correlation coefficients (r) and p values are indicated.
FIGURE 3
FIGURE 3
Hyperpolarization and HA. Sperm samples from normospermic donors obtained after swim-up (NC0) and upon incubation in non-capacitating (NC) and capacitating (CAP) media for 1, 3, and 5 h were analyzed. (A) Em measurements. (B,C) The percentage of hyperactivated sperm (B) and VCL (C) were obtained using CASA software. Data represent mean ± SEM from at least six independent experiments. Paired Student’s t test was performed. Statistically significant differences between the indicated conditions or with the control NC0 (asterisks on each column bar) are as follows: p < 0.05, ∗∗p < 0.01, ∗∗∗p < 0.005.
FIGURE 4
FIGURE 4
Em hyperpolarization correlates with higher IVF rates. (A) IVF patients were classified according to their fertilization rate: ≥60% and <60% of fertilized oocytes. Data represent mean ± SEM, an unpaired Student’s t test was performed: ****p < 0.0001. (B) Em measurements from patients’ samples. Data represent mean ± SEM, a paired Student’s t test was performed: p < 0.05. (C) Representation of the percentages of each type of behavior: hyperpolarizing (red), depolarizing (blue) and unchanged (gray). (D,E) Correlation analysis between the percentage of IVF and the Em in CAP (D) and the change on EmEmCAPEmNC0) (E). The correlation coefficients (r) and p values are indicated. (F) Mean IVF rates of hyperpolarizing (H, red), depolarizing (D, blue), and unchanged (U, gray) samples. Data represent mean ± SEM, an unpaired Student’s t test was performed: ∗∗p < 0.01.
FIGURE 5
FIGURE 5
Capacitated sperm Em is a good predictor for IVF. Receiver operating characteristic (ROC) curve analysis for capacitated sperm Em values. The reference line is marked in black. The area under the curve is 0.8571 ± 0.098 (95% CI = 0.6647; 1).

References

    1. Aitken R. (1997). Molecular mechanisms regulating human sperm function. Mol. Hum. Reprod. 3 169–173. 10.1093/molehr/3.3.169 - DOI - PubMed
    1. Alasmari W., Barratt C. L. R., Publicover S. J., Whalley K. M., Foster E., Kay V., et al. (2013). The clinical significance of calcium-signalling pathways mediating human sperm hyperactivation. Hum. Reprod. 28 866–876. 10.1093/humrep/des467 - DOI - PMC - PubMed
    1. Arnoult C., Kazam I. G., Visconti P. E., Kopf G. S., Villaz M., Florman H. M. (1999). Control of the low voltage-activated calcium channel of mouse sperm by egg ZP3 and by membrane hyperpolarization during capacitation. Proc. Natl. Acad. Sci. U.S.A. 96 6757–6762. 10.1073/pnas.96.12.6757 - DOI - PMC - PubMed
    1. Baro Graf C., Ritagliati C., Stival C., Balestrini P. A., Buffone M. G., Krapf D. (2019). Determination of a robust assay for human sperm membrane potential analysis. Front. Cell Dev. Biol. 7:101. 10.3389/fcell.2019.00101 - DOI - PMC - PubMed
    1. Barratt C. L. R., Björndahl L., De Jonge C. J., Lamb D. J., Martini F. O., McLachlan R., et al. (2017). The diagnosis of male infertility: an analysis of the evidence to support the development of global WHO guidance-challenges and future research opportunities. Hum. Reprod. Update 23 660–680. 10.1093/humupd/dmx021 - DOI - PMC - PubMed

LinkOut - more resources