. 2020 Jan 22;6(4):eaaw6938.
doi: 10.1126/sciadv.aaw6938. eCollection 2020 Jan.

Single-cell morphology encodes metastatic potential

Affiliations

Single-cell morphology encodes metastatic potential

Pei-Hsun Wu et al. Sci Adv. .

Abstract

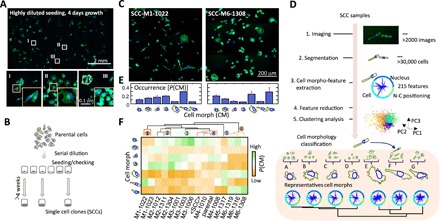
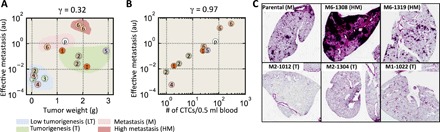
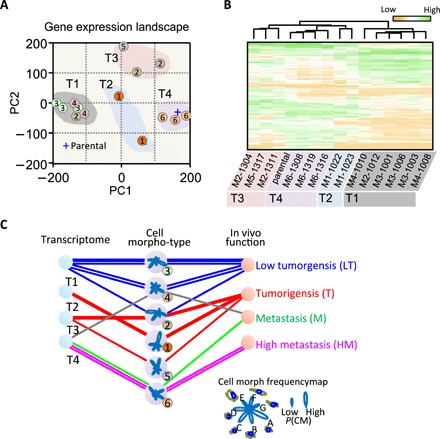
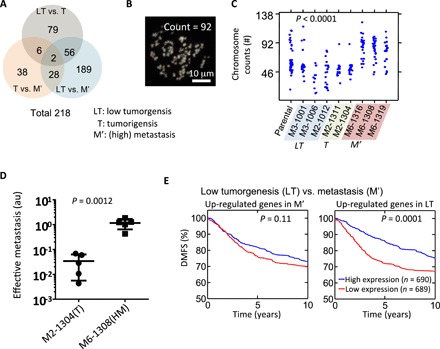
A central goal of precision medicine is to predict disease outcomes and design treatments based on multidimensional information from afflicted cells and tissues. Cell morphology is an emergent readout of the molecular underpinnings of a cell's functions and, thus, can be used as a method to define the functional state of an individual cell. We measured 216 features derived from cell and nucleus morphology for more than 30,000 breast cancer cells. We find that single cell-derived clones (SCCs) established from the same parental cells exhibit distinct and heritable morphological traits associated with genomic (ploidy) and transcriptomic phenotypes. Using unsupervised clustering analysis, we find that the morphological classes of SCCs predict distinct tumorigenic and metastatic potentials in vivo using multiple mouse models of breast cancer. These findings lay the groundwork for using quantitative morpho-profiling in vitro as a potentially convenient and economical method for phenotyping function in cancer in vivo.


Figures

Fig. 1
Fig. 1. Cell polymorphism—cell morphology is a highly heritable trait at the single-cell level.
(A) Nuclei (blue) and F-actin organization (green) of MDA-MB-231 breast cancer cells after growth for 4 days from a sparse initial seeding density, showing how cells formed several spatially and morphologically distinct clusters. Representative high-resolution images of different clonal cells highlighted as I, II, and III are shown at the bottom. (B) Schematic plot showing the serial dilution procedure used to establish single-cell clones (SCCs) from a parental cell population. (C) Nuclei (blue) and F-actin organization (green) in cells of two established SCCs, SCC-M1-1022 and SCC-M6-1308, displaying distinct morpho-types. (D) Flow diagram illustrating the process used to quantify cell morphology (CM) through an unsupervised machine learning approach. A classifier model was built on the basis of all 14 SCCs and the parental MDA-MB-231 cells through principal component analysis and k-means clustering analysis. The morphology of all measured cells was classified into one of seven cell morph classes. Representative CM for each cell morph class (A to G) is shown at the bottom. (E) The fraction of cells in each cell morph class was used to quantitatively represent morpho-types of SCCs. Cell morph class fraction profiles for SCC-M1-1022 and SCC-M6-1308 are shown in the histograms. (F) Unsupervised hierarchical clustering of the SCCs based on their morpho-types (i.e., fraction of cells in cell morph classes A to G). The names of established SCCs were further marked as M1 to M6 based on six distinct cell morpho-type clusters revealed in the dendrogram.
Fig. 2
Fig. 2. Morphological phenotypes in vitro and differential tumor progression in vivo.
(A and B) Scatter plot showing both tumor size and the extent of lung metastasis resulting from the injection of 14 SCCs and parental MDA-MB-231 cells into the mammary pad of SCID mice. At least four mice were tested for each SCC (A). The number within each circle represents the morpho-type class of the corresponding SCC. On the basis of tumorigenicity and metastatic burden in the lung, these SCCs were further classified into four groups: low tumorigenicity (LT), tumorigenic (T), metastatic (M), and hypermetastatic (HM). The Pearson’s correlation coefficient between the effective metastasis and tumor weight among all SCCs is 0.32. The number of circulating tumor cells (CTCs) is highly correlated with lung metastasis, with a correlation coefficient of 0.96 (B). (C) Histological sections of mice lung show that clear metastatic lesions are present for SCC-M6-1308, SCC-M6-1319, and parental cells, but not in other SCCs, including SCC-M2-1012, SCC-M2-1304, and SCC-M2-1022. au, arbitrary units.
Fig. 3
Fig. 3. Morphological diversity of SCCs is driven by distinct gene expression patterns.
(A) The first and second principal components obtained from the principal component analysis of gene expression data were used to show the landscape of whole genome expression profile of the SCCs. The number within each circle represents the morpho-type class of each SCC. SCCs with the same morpho-type classes in general clustered together. (B) Unsupervised hierarchy clustering analysis using differentially expressed genes among these SCCs (see detailed list of genes in table S2) shows four distinct gene expression classes (G1 to G4). SCCs within the same morpho-type class are classified within the same gene expression class with the exception of SCC-M2-1012. SCCs within G1 and G3 gene expression classes exhibit multiple morpho-type classes. (C) Diagram showing mutual relations between morpho-type, gene expression class, and outcomes in vivo for different SCCs. Polar-petal plots were used to visualize fraction profiles of cell morph classes for the six different morpho-types. The length of a petal indicates the fraction size for the corresponding CM class.
Fig. 4
Fig. 4. Distinct gene expression profiles of SCCs reveal prognostic genes.
(A) Venn diagram showing the number of genes that are found to be significantly different (>5-fold and P value from one-way ANOVA <0.05) between three different in vivo grades of aggressiveness for SCCs (i.e., LT versus T, T versus M′, and LT versus M′). M′ includes both M and HM. (B and C) Representative image showing 4′,6-diamidino-2-phenylindole (DAPI)–stained spreading chromosome of SCC-M6-1308 (B). Chromosome number counted using the metaphase spreading assay for parental cells (n = 44), and cells from SCC-M3-1001 (n = 24), SCC-M3-1006 (n = 11), SCC-M2-1012 (n = 22), SCC-M2-1311 (n = 18), SCC-M2-1304 (n = 18), SCC-M6-1316 (n = 26), SCC-M6-1308 (n = 31), and SCC-M6-1319 (n = 22). One-way ANOVA test shows there is a significant difference, with a P < 0.0001 (C). (D) Score for effective metastasis to the lung in the tail-vein injection mouse model (n = 5) shows significant difference (P = 0.0012 by Student t test) between tumorigenic clone SCC-M2-1304 (mean lung effective metastasis score, 0.034) and metastatic clone SCC-M6-1308 (1.159). (E) Differentially expressed genes between LT SCC versus M′ SCC were used to investigate their prognostic power. A cohort of 1379 tumors from patients with breast cancer was used to test the predictive potential of identified gene sets. Patients were separated into two groups based on the average expression level of these identified genes, and the Kaplan-Meier survival curves for the two groups of patients were plotted. For the genes that were up-regulated in the M′ SCCs, no significant prognostic effect was found. However, the results show that patients with higher expression levels of metastasis suppressor genes (i.e., up-regulated genes in LT) have a significantly longer survival time than those with low expression (P = 0.0001). P value is evaluated using log-rank test.

References

    1. Stratton M. R., Campbell P. J., Futreal P. A., The cancer genome. Nature 458, 719–724 (2009). - PMC - PubMed
    1. Vogelstein B., Papadopoulos N., Velculescu V. E., Zhou S., Diaz L. A., Kinzler K. W., Cancer genome landscapes. Science 339, 1546–1558 (2013). - PMC - PubMed
    1. Paez J. G., Jänne P. A., Lee J. C., Tracy S., Greulich H., Gabriel S., Herman P., Kaye F. J., Lindeman N., Boggon T. J., Naoki K., Sasaki H., Fujii Y., Eck M. J., Sellers W. R., Johnson B. E., Meyerson M., EGFR mutations in lung cancer: Correlation with clinical response to gefitinib therapy. Science 304, 1497–1500 (2004). - PubMed
    1. Miki Y., Swensen J., Shattuck-Eidens D., Futreal P., Harshman K., Tavtigian S., Liu Q., Cochran C., Bennett L., Ding W. et al. , A strong candidate for the breast and ovarian-cancer susceptibility gene brca1. Science 266, 66–71 (1994). - PubMed
    1. Negrini S., Gorgoulis V. G., Halazonetis T. D., Genomic instability - an evolving hallmark of cancer. Nat. Rev. Mol. Cell Biol. 11, 220–228 (2010). - PubMed

Publication types

Substances