

Optimizing SNR for multi-metabolite hyperpolarized carbon-13 MRI using a hybrid flip-angle scheme
- PMID: 32011018
- PMCID: PMC7318277
- DOI: 10.1002/mrm.28194
Optimizing SNR for multi-metabolite hyperpolarized carbon-13 MRI using a hybrid flip-angle scheme
Abstract
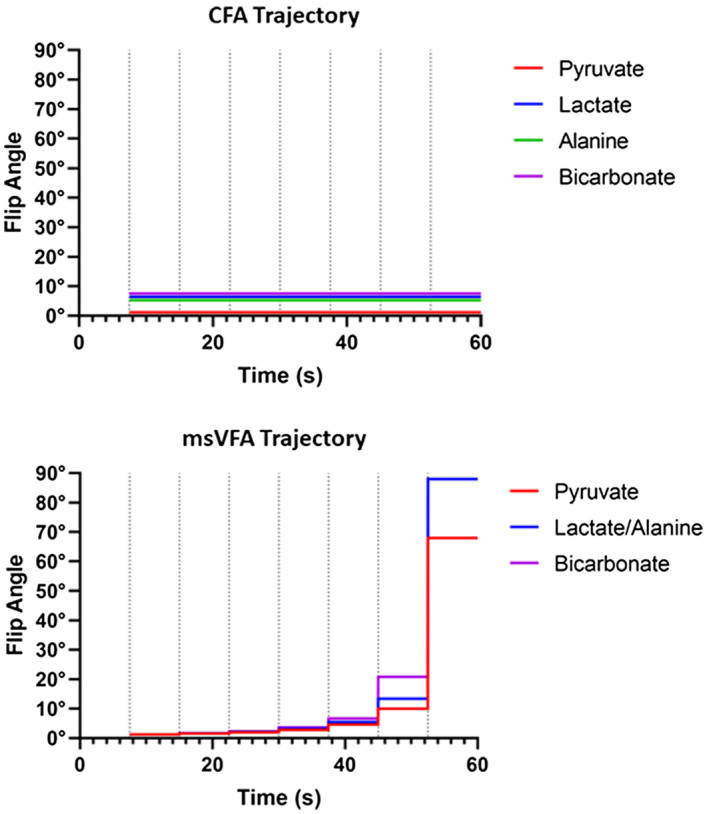
Purpose: To improve the SNR of hyperpolarized carbon-13 MRI of [1-13 C]pyruvate using a multispectral variable flip angle (msVFA) scheme in which the spectral profile and flip angle vary dynamically with time.
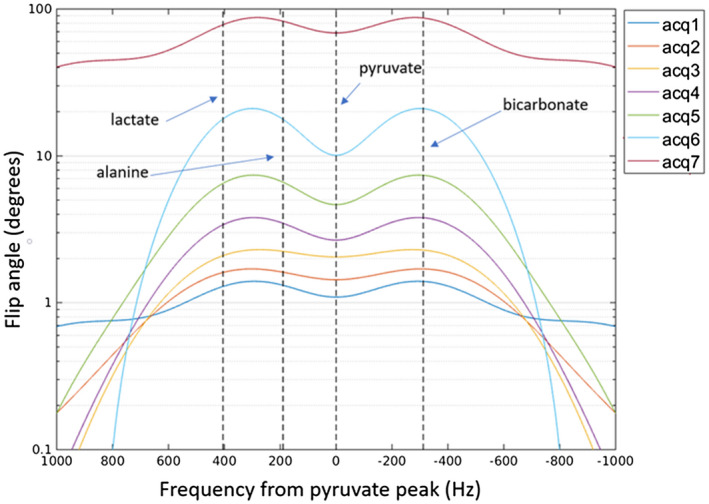
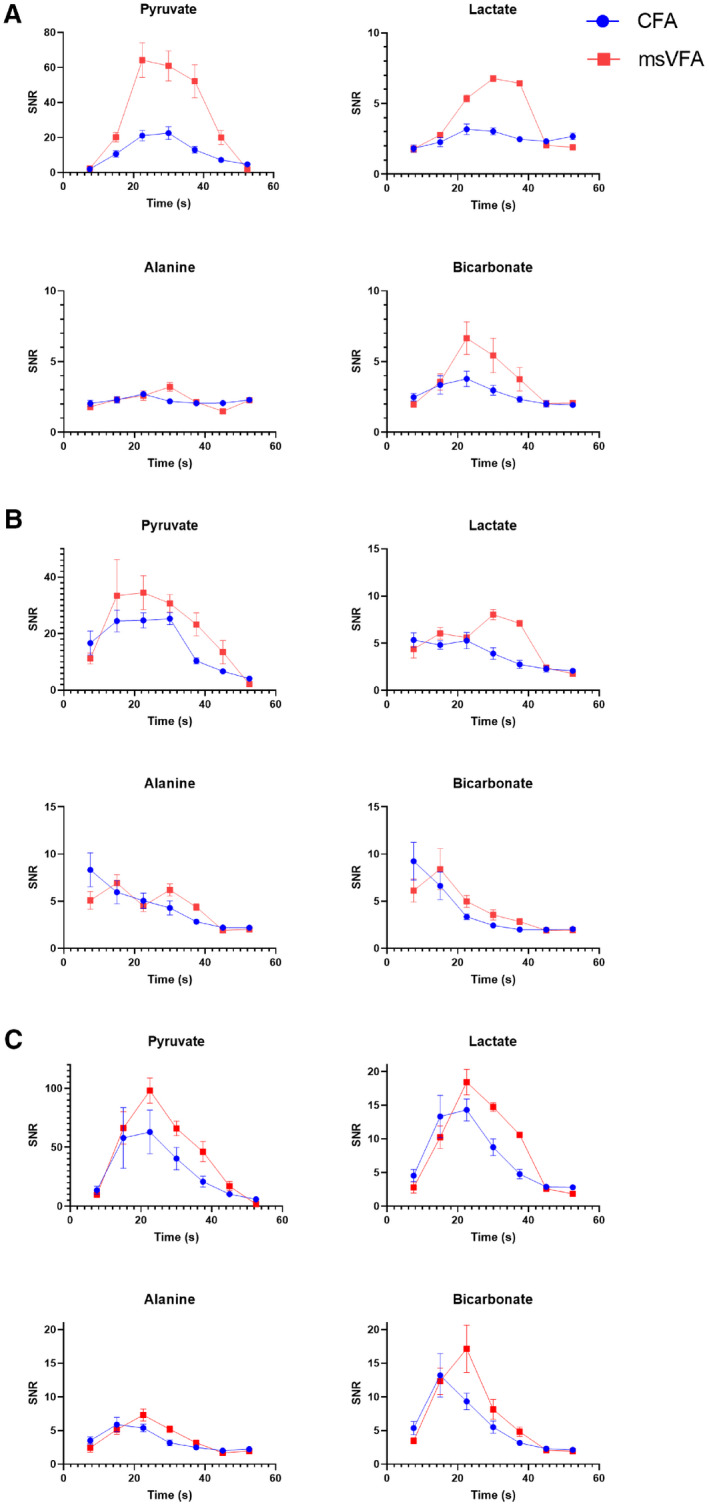
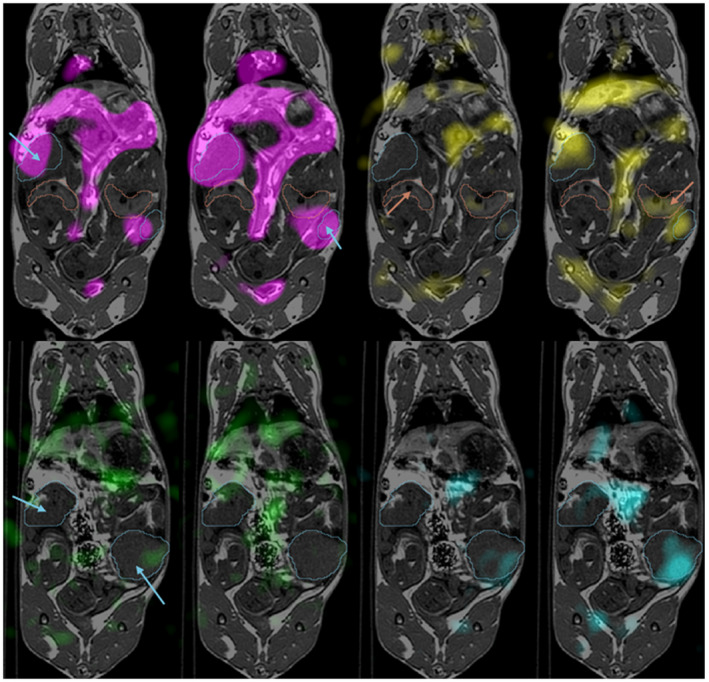
Methods: Each image acquisition in a time-resolved imaging experiment used a unique spectrally varying RF pulse shape for msVFA. Therefore, the flip angle for every acquisition was optimized for pyruvate and each of its metabolites to yield the highest SNR across the acquisition. Multispectral VFA was compared with a spectrally varying constant flip-angle excitation model through simulations and in vivo. A modified broadband chemical shift-encoded gradient-echo sequence was used for in vivo experiments on six pregnant guinea pigs. Regions of interest placed in the placentae, maternal liver, and maternal kidneys were used as areas for SNR measurement.
Results: In vivo experiments showed significant increases in SNR for msVFA relative to constant flip angle of up to 250% for multiple metabolites.
Conclusion: Hyperpolarized carbon-13 imaging with msVFA excitation produces improved SNR for all metabolites in organs of interest.
Keywords: RF pulse design; carbon-13; hyperpolarized MRI; metabolism; pyruvate.
© 2020 The Authors. Magnetic Resonance in Medicine published by Wiley Periodicals, Inc. on behalf of International Society for Magnetic Resonance in Medicine.
Figures
References
-
- Siauve N, Chalouhi GE, Deloison B, et al. Functional imaging of the human placenta with magnetic resonance. Am J Obstet Gynecol. 2015;213:S103‐S114. - PubMed
-
- Dekan S, Linduska N, Kasprian G, Prayer D. MRI of the placenta—a short review. Wien Med Wochenschr. 2012;162:225‐228. - PubMed
-
- Hurd RE, Yen YF, Chen A, Ardenkjaer‐Larsen JH. Hyperpolarized 13C metabolic imaging using dissolution dynamic nuclear polarization. J Magn Reson Imaging. 2012;36:1314‐1328. - PubMed
-
- Friesen‐Waldner LJ, Sinclair KJ, Wade TP, et al. Hyperpolarized [1‐13C]Pyruvate MRI for noninvasive examination of placental metabolism and nutrient transport: a feasibility study in pregnant guinea pigs. J Magn Reson Imaging. 2016;43:750‐755. - PubMed
Publication types
MeSH terms
Substances
Grants and funding
LinkOut - more resources
Full Text Sources
Medical
