. 2020 Feb 3:9:e48401.
doi: 10.7554/eLife.48401.

Accelerated viral dynamics in bat cell lines, with implications for zoonotic emergence

Affiliations

Accelerated viral dynamics in bat cell lines, with implications for zoonotic emergence

Cara E Brook et al. Elife. .

Abstract

Bats host virulent zoonotic viruses without experiencing disease. A mechanistic understanding of the impact of bats' virus hosting capacities, including uniquely constitutive immune pathways, on cellular-scale viral dynamics is needed to elucidate zoonotic emergence. We carried out virus infectivity assays on bat cell lines expressing induced and constitutive immune phenotypes, then developed a theoretical model of our in vitro system, which we fit to empirical data. Best fit models recapitulated expected immune phenotypes for representative cell lines, supporting robust antiviral defenses in bat cells that correlated with higher estimates for within-host viral propagation rates. In general, heightened immune responses limit pathogen-induced cellular morbidity, which can facilitate the establishment of rapidly-propagating persistent infections within-host. Rapidly-transmitting viruses that have evolved with bat immune systems will likely cause enhanced virulence following emergence into secondary hosts with immune systems that diverge from those unique to bats.

Keywords: Chiroptera; bat; ecology; epidemiology; global health; innate immunity; interferon; within-host model.

Plain language summary

Bats can carry viruses that are deadly to other mammals without themselves showing serious symptoms. In fact, bats are natural reservoirs for viruses that have some of the highest fatality rates of any viruses that people acquire from wild animals – including rabies, Ebola and the SARS coronavirus. Bats have a suite of antiviral defenses that keep the amount of virus in check. For example, some bats have an antiviral immune response called the interferon pathway perpetually switched on. In most other mammals, having such a hyper-vigilant immune response would cause harmful inflammation. Bats, however, have adapted anti-inflammatory traits that protect them from such harm, include the loss of certain genes that normally promote inflammation. However, no one has previously explored how these unique antiviral defenses of bats impact the viruses themselves. Now, Brook et al. have studied this exact question using bat cells grown in the laboratory. The experiments made use of cells from one bat species – the black flying fox – in which the interferon pathway is always on, and another – the Egyptian fruit bat – in which this pathway is only activated during an infection. The bat cells were infected with three different viruses, and then Brook et al. observed how the interferon pathway helped keep the infections in check, before creating a computer model of this response. The experiments and model helped reveal that the bats’ defenses may have a potential downside for other animals, including humans. In both bat species, the strongest antiviral responses were countered by the virus spreading more quickly from cell to cell. This suggests that bat immune defenses may drive the evolution of faster transmitting viruses, and while bats are well protected from the harmful effects of their own prolific viruses, other creatures like humans are not. The findings may help to explain why bats are often the source for viruses that are deadly in humans. Learning more about bats' antiviral defenses and how they drive virus evolution may help scientists develop better ways to predict, prevent or limit the spread of viruses from bats to humans. More studies are needed in bats to help these efforts. In the meantime, the experiments highlight the importance of warning people to avoid direct contact with wild bats.


Conflict of interest statement

CB, MB, KC, AD, CD, AG, BG, MM, MN, LW, Av No competing interests declared

Figures

Figure 1.
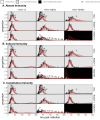
Figure 1.. Fitted time series of infectious cell proportions from mean field model for rVSV-G, rVSV-EBOV, and rVSV-MARV infections (columns) on Vero, RoNi/7.1, and PaKiT01 cell lines (rows) at MOI = 0.001.
Results are shown for the best fit immune absent model on Vero cells, induced immunity model on RoNi/7.1 cells, and constitutive (for rVSV-VSVG and rVSV-EBOV) and induced (for rVSV-MARV) immunity models on PaKiT01 cells. Raw data across all trials are shown as open circles (statistical smoothers from each trial used for fitting are available in Figure 1—figure supplements 2–3). Model output is shown as a solid crimson line (95% confidence intervals by standard error = red shading). Panel background corresponds to empirical outcome of the average stochastic cell culture trial (persistent infection = white; virus-induced epidemic extinction = gray; immune-mediated epidemic extinction = black). Parameter values are listed in Table 1 and Supplementary file 4. Results for absent/induced/constitutive fitted models across all cell lines are shown in Figure 1—figure supplement 4 (MOI = 0.001) and Figure 1—figure supplement 5 (MOI = 0.0001).
Figure 1—figure supplement 1.
Figure 1—figure supplement 1.. Cell culture models of viral propagation.
(A), (B), and (C) show raw, original images of rVSV-EBOV propagation across Vero cell lines at, respectively, 17, 21, and 28 hr post-infection (timesteps 2, 3, and five from trial Ver6_B1). (D), (E), and (F) show corresponding, binary images processed in the R package, EBImage. Cells expressing viral eGFP are depicted in white and uninfected/dead cells in black.
Figure 1—figure supplement 2.
Figure 1—figure supplement 2.. Time series data to which mean field mechanistic models were fit, across rVSV-G (left), rVSV-EBOV (middle), and rVSV-MARV (right) infections on Vero, RoNi/7.1, and PaKiT01 cell lines, at MOI = 0.001.
Open circles show raw data across all trials, while red, dashed line gives the statistical mean of each trials, established from GAM model incorporating random effects per trial. Results for MOI = 0.0001 are shown in Figure 1—figure supplement 3.
Figure 1—figure supplement 3.
Figure 1—figure supplement 3.. Time series data to which mean field mechanistic models were fit, across rVSV-G (left), rVSV-EBOV (middle), and rVSV-MARV (right) infections on Vero, RoNi/7.1, and PaKiT01 cell lines, at MOI = 0.0001.
Open circles show raw data across all trials, while red, dashed line gives the statistical mean of each trials, established from GAM model incorporating random effects per trial. Results for MOI = 0.001 are shown in Figure 1—figure supplement 2.
Figure 1—figure supplement 4.
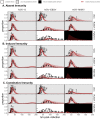
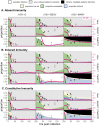
Figure 1—figure supplement 4.. Figure replicates Figure 1 (main text) but includes all output across mean field model fits assuming (A) absent immunity, (B) induced immunity, and (C) constitutive immunity.
Figure shows fitted time series of infectious cell proportions for rVSV-G, rVSV-EBOV, and rVSV-MARV infections (columns) on Vero, RoNi/7.1, and PaKiT01 cell lines (rows) at MOI = 0.001. Raw data across all trials are shown as open circles and model output as the solid crimson line (95% confidence intervals by standard error = red shading). Panel background corresponds to empirical outcome of the average stochastic cell culture trial (persistent infection = white; virus-induced epidemic extinction = gray; immune-mediated epidemic extinction = black).
Figure 1—figure supplement 5.
Figure 1—figure supplement 5.. Figure replicates Figure 1—figure supplement 4 exactly but shows model fits and data for all cell-virus combinations at MOI = 0.0001.
Figure 1—figure supplement 6.
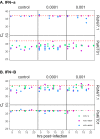
Figure 1—figure supplement 6.. IFN gene expression in bat cells at baseline and upon viral stimulation.
(A) IFN-α and (B) IFN-β gene expression profiles from qPCR for rVSV infections on RoNi/7.1 and PaKiT01 cell lines. Panels show δ-Ct (raw Ct of IFN gene assay subtracted from raw Ct of β-Actin housekeeping gene assay) across a time series for mock (left), MOI = 0.0001 (middle) and MOI = 0.001 (right) infections across a time series. Viruses are represented by color (rVSV-G = green, rVSV-EBOV = magenta, rVSV-MARV = blue). The red dashed line at δ-Ct = 37 corresponds to no expression; higher expression is indicated at lower values for δ-Ct. qPCR was carried out using primers summarized in Supplementary file 6.
Figure 1—figure supplement 7.
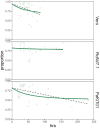
Figure 1—figure supplement 7.. Curve fits to control data for standard birth (b = .025) and natural mortality (μ=1121,1191,184 hours for, respectively, Vero, RoNi/7.1, and PaKiT01 cell lines) rates across all three cell lines.
Raw data from multiple trials are shown as open circles, statistical means as dashed black lines, with the output from the mean field model, using the fixed birth rate and estimated mortality rate, in solid green.
Figure 2.
Figure 2.. Two parameter bifurcations of the mean field model, showing variation in the transmission rate, β, against variation in the pathogen-induced mortality rate, α, under diverse immune assumptions.
Panel (A) depicts dynamics under variably constitutive immunity, ranging from absent (left: ε=0) to high (right: ε=.0025). In all panel (A) plots, the rate of induced immune antiviral acquisition (ρ) was fixed at 0.01. Panel (B) depicts dynamics under variably induced immunity, ranging from absent (left: ρ=0) to high (right: ρ=1). In all panel (B) plots, the rate of constitutive antiviral acquisition (ε)) was fixed at 0.0001 Branch point curves are represented as solid lines and Hopf curves as dashed lines. White space indicates endemic equilibrium (persistence), gray space indicates limit cycles, and black space indicates no infection (extinction). Other parameter values for equilibrium analysis were fixed at: b = .025, μ = .001, σ = 1/6, c = 0. Special points from bifurcations analyses are listed in Supplementary file 3.
Figure 3.
Figure 3.. Two parameter bifurcations of the mean field model, showing variation in the transmission rate, β, against variation in: (A) the induced immunity rate of antiviral acquisition (ρ) and (B) the constitutive immunity rate of antiviral acquisition (ε).
Panels show variation in the extent of immunity, from absent (left) to high (right). Branch point curves are represented as solid lines and Hopf curves as dashed lines. White space indicates endemic equilibrium (persistence), gray space indicates limit cycling, and black space indicates no infection (extinction). Other parameter values for equilibrium analysis were fixed at: b = .025, μ = .001, σ = 1/6, α = 1/6, c = 0. Special points from bifurcations analyses are listed in Supplementary file 3.
Figure 4.
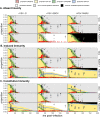
Figure 4.. Best fit parameter estimates for β and ρ or ε from mean-field model fits to MOI=0.001 time series data, atop (A,B) β – ρ and (C) β – ε bifurcation.
Fits and bifurcations are grouped by immune phenotype: (A) absent; (B) induced; (C) constitutive immunity, with cell lines differentiated by shape (Vero=circles; RoNi/7.1 = triangles; PaKiT01=squares) and viral infections by color (rVSV-G = green, rVSV-EBOV = magenta, rVSV-MARV = blue). Note that y-axis values are ten-fold higher in panel (C). Branch point curves (solid lines) and Hopf curves (dashed lines) are reproduced from Figure 3. White space indicates endemic equilibrium (pathogen persistence), gray space indicates limit cycling (virus-induced epidemic extinction), and black space indicates no infection (immune-mediated pathogen extinction). In panel (A) and (B), ε is fixed at 0; in panel (C), ρ is fixed at 5x10⁻⁸ for bifurcation curves and estimated at 4x10⁻⁸ and 8x10⁻⁸ for rVSV-EBOV and rVSV-G parameter points, respectively. Other parameter values were fixed at: b = .025, μ = 0.001, σ = 1/6, α = 1/6, and c = 0 across all panels. Raw fitted values and corresponding 95% confidence intervals for β, ρ, and ε, background parameter values, and AIC recovered from model fit, are reported in Supplementary file 4. Parameter fits at MOI=0.0001 are visualized in Figure 4—figure supplement 1.
Figure 4—figure supplement 1.
Figure 4—figure supplement 1.. Best fit parameter estimates for β and ρ or ϵ from mean-field model fits to MOI=0.0001 time series data, atop (A,B) β – ρ and (C) β – ϵ bifurcation.
Fits and bifurcations are grouped by immune phenotype: (A) absent; (B) induced; (C) constitutive immunity, with cell lines differentiated by shape (Vero=circles; RoNi/7.1 = triangles; PaKiT01=squares) and viral infections by color (rVSV-G = green, rVSV-EBOV = magenta, rVSV-MARV = blue). Note that y-axis values are ten-fold higher in panel (C). Branch point curves (solid lines) and Hopf curves (dashed lines) are reproduced from Figure 3 (main text). White space indicates endemic equilibrium (pathogen persistence), gray space indicates limit cycling (virus-induced epidemic extinction), and black space indicates no infection (immune-mediated pathogen extinction). In panel (A) and (B), ϵ is fixed at 0; in panel (C), ϵ is fixed at 5x10⁻⁸ for bifurcation curves and estimated at 4x10⁻⁸ and 8x10⁻⁸ for rVSV-EBOV and rVSV-G parameter points, respectively. To construct bifurcation curves, other parameter values were fixed at: b = 0.025, µ = 0.001, α=16, and c = 0 across all panels. Raw fitted values and corresponding 95% confidence intervals for β, ρ, and ϵ, background parameter values, and AIC recovered from model fit, are reported in Supplementary file 4. Parameter fits at MOI=0.0001 are visualized in Figure 4 of the main text.
Figure 5.
Figure 5.. Fitted time series of susceptible (green shading) and antiviral (blue shading) cell proportions from the mean field model for rVSV-G, rVSV-EBOV, and rVSV-MARV infections (columns) on Vero, RoNi/7.1, and PaKiT01 cell lines (rows) at MOI = 0.001.
Results are shown for the best fit immune absent model on Vero cells, induced immunity model on RoNi/7.1 cells and constitutive (rVSV-G and rVSV-EBOV) and induced (rVSV-MARV) immune models on PaKiT01 cells. Combined live, uninfectious cell populations (S + A + E) are shown in tan shading, with raw live, uninfectious cell data from Hoechst stains visualized as open circles. The right-hand y-axis corresponds to R-effective (pink solid line) across each time series; R-effective = 1 is a pink dashed, horizontal line. Panel background corresponds to empirical outcome of the average stochastic cell culture trial (persistent infection = white; virus-induced epidemic extinction = gray; immune-mediated epidemic extinction = black). Parameter values are listed in Supplementary file 4 and results for absent/induced/constitutive fitted models across all cell lines in Figure 5—figure supplement 1 (MOI = 0.001) and Figure 5—figure supplement 2 (MOI = 0.0001).
Figure 5—figure supplement 1.
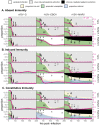
Figure 5—figure supplement 1.. Figure replicates Figure 5 (main text) but includes all output across mean field model fits assuming (A) absent immunity, (B) induced immunity, and (C) constitutive immunity.
Figure shows fitted time series of susceptible (green shading) and antiviral (blue shading) cell proportions from the mean field model for rVSV-G, rVSV-EBOV, and rVSV-MARV infections (columns) on Vero, RoNi/7.1, and PaKiT01 cell lines (rows) at MOI = 0.001. Combined live, uninfectious cell populations (S + A + E, summed across the time series) is shown in tan shading, with raw live, uninfectious cell data from Hoechst stains of terminal time series visualized as open circles. The right-hand y-axis corresponds to R-effective (pink solid line) across each time series; R-effective = 1 is given as a pink dashed, horizontal line. Panel background corresponds to empirical outcome of the average stochastic cell culture trial (persistent infection = white; virus-induced epidemic extinction = gray; immune-mediated epidemic extinction = black).
Figure 5—figure supplement 2.
Figure 5—figure supplement 2.. Figure replicates Figure 5—figure supplement 1 exactly but shows model fits and data for all cell-virus combinations at MOI = 0.0001.
Figure 5—figure supplement 3.
Figure 5—figure supplement 3.. Spatial model state variable outputs, fit to MOI = 0.001 data only, for all 27 unique cell line - virus - immune assumption combinations: (A) absent immunity, (B) induced immunity, and (C) constitutive immunity.
Values for ρ and ε were fixed at equivalent values to those optimized in mean field trials and β fixed at ten times the value estimated under mean field conditions. Figure shows mean output from 10 runs of the spatial stochastic model, on a 10,000 cell lattice for MOI = 0.001 infections of rVSV-G, rVSV-EBOV, and rVSV-MARV (columns) on Vero, RoNi/7.1, and PaKiT01 (rows) cell lines. Mean state variable outputs are plotted as colored lines with 95% confidence intervals by standard error shown in corresponding shading (infectious = red; susceptible = green; antiviral = blue). Raw infectious cell data across all time trials are plotted as open red circles, with the Hoechst-stained live cell population as open black circles. Modeled live, uninfectious cell populations (S+A+E) are shown in tan shading in the background. Panel background shading corresponds to the mean spatial model outcome for each cell line – virus combination (persistent infection = white; virus-induced epidemic extinction = gray; immune-mediated epidemic extinction = black). All parameter values are reported in Supplementary file 4.

References

    1. Ahn M, Anderson DE, Zhang Q, Tan CW, Lim BL, Luko K, Wen M, Chia WN, Mani S, Wang LC, Ng JHJ, Sobota RM, Dutertre CA, Ginhoux F, Shi ZL, Irving AT, Wang LF. Dampened NLRP3-mediated inflammation in bats and implications for a special viral reservoir host. Nature Microbiology. 2019;4:789–799. doi: 10.1038/s41564-019-0371-3. - DOI - PMC - PubMed
    1. Arnold CE, Guito JC, Altamura LA, Lovett SP, Nagle ER, Palacios GF, Sanchez-Lockhart M, Towner JS. Transcriptomics reveal antiviral gene induction in the egyptian rousette bat is antagonized in vitro by marburg virus infection. Viruses. 2018;10:E607. doi: 10.3390/v10110607. - DOI - PMC - PubMed
    1. Baccam P, Beauchemin C, Macken CA, Hayden FG, Perelson AS. Kinetics of influenza A virus infection in humans. Journal of Virology. 2006;80:7590–7599. doi: 10.1128/JVI.01623-05. - DOI - PMC - PubMed
    1. Biesold SE, Ritz D, Gloza-Rausch F, Wollny R, Drexler JF, Corman VM, Kalko EK, Oppong S, Drosten C, Müller MA. Type I interferon reaction to viral infection in interferon-competent, immortalized cell lines from the african fruit bat Eidolon helvum. PLOS ONE. 2011;6:e28131. doi: 10.1371/journal.pone.0028131. - DOI - PMC - PubMed
    1. Bonhoeffer S, May RM, Shaw GM, Nowak MA. Virus dynamics and drug therapy. PNAS. 1997;94:6971–6976. doi: 10.1073/pnas.94.13.6971. - DOI - PMC - PubMed

Publication types

MeSH terms