Dynamic Changes in Prognosis with Elapsed Time on Ventilators among Mechanically Ventilated Patients
- PMID: 32011907
- PMCID: PMC7258420
- DOI: 10.1513/AnnalsATS.201908-646OC
Dynamic Changes in Prognosis with Elapsed Time on Ventilators among Mechanically Ventilated Patients
Abstract
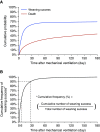
Rationale: Previous outcome studies of mechanical ventilation usually adopted a static timeframe to observe the outcome and reported prognosis from the standpoint of the first ventilator day. However, patients and their families may repeatedly inquire about prognosis over time after the initiation of mechanical ventilation.Objectives: We aimed to describe dynamic changes in prognosis according to the elapsed time on a ventilator among mechanically ventilated patients.Methods: For this cohort study we used the entire population dataset of Taiwan's National Health Insurance database. We enrolled adults who newly received invasive mechanical ventilation for at least two consecutive days between March 1, 2010, and August 31, 2011. For every single ventilator day after the initiation of mechanical ventilation, we estimated the cumulative probabilities of weaning success and death in the subsequent 90 days.Results: A total of 162,200 episodes of respiratory failure requiring invasive mechanical ventilation were included. The median age of the subjects was 72 years (interquartile range 57-81 yr) and the median follow-up time was 250 days (interquartile range 30-463 d). The probability curve of weaning success against the time on ventilation showed a unidirectionally decreasing trend, with a relatively sharp slope in the initial 2 months. The probabilities of weaning success in 90 days after the 2nd, 7th, 21st, and 60th ventilator days were 68.3% (95% confidence interval [CI], 68.1-68.5%), 62.6% (95% CI, 62.2-62.9%), 46.3% (95% CI, 45.8-46.8%), and 21.0% (95% CI, 20.3-21.8%), respectively. In contrast, the death curve showed an initial increase and then a decreasing trend after the 19th ventilator day. We also reported tailored prognosis information according to the age, sex, and ventilator day of a mechanically ventilated patient.Conclusions: This study provides ventilator-day-specific prognosis information obtained from a large cohort of unselected patients on invasive mechanical ventilation. The probability of weaning success decreased with the elapsed time on mechanical ventilation, and the decline was particularly remarkable in the first 2 months of ventilatory support.
Keywords: mechanical ventilation; outcome; prognosis; respiratory failure; weaning.
Figures


Comment in
-
Prognosis for Mechanically Ventilated Patients: A Moving Target.Ann Am Thorac Soc. 2020 Jun;17(6):682-683. doi: 10.1513/AnnalsATS.202003-242ED. Ann Am Thorac Soc. 2020. PMID: 32469649 Free PMC article. No abstract available.
References
-
- Goligher E, Ferguson ND. Mechanical ventilation: epidemiological insights into current practices. Curr Opin Crit Care. 2009;15:44–51. - PubMed
-
- Hall JB. Making recommendations for limiting care in the ICU based on sound prognosis. JAMA. 2017;317:2170–2171. - PubMed
-
- Hoffmann TC, Montori VM, Del Mar C. The connection between evidence-based medicine and shared decision making. JAMA. 2014;312:1295–1296. - PubMed
Publication types
MeSH terms
LinkOut - more resources
Full Text Sources
Medical

