

Preclinical Imaging Using Single Track Location Shear Wave Elastography: Monitoring the Progression of Murine Pancreatic Tumor Liver Metastasis In Vivo
- PMID: 32012006
- PMCID: PMC7329602
- DOI: 10.1109/TMI.2020.2971422
Preclinical Imaging Using Single Track Location Shear Wave Elastography: Monitoring the Progression of Murine Pancreatic Tumor Liver Metastasis In Vivo
Abstract
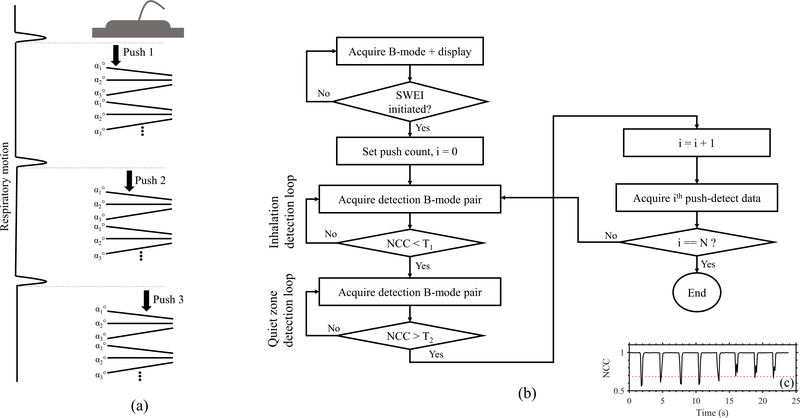
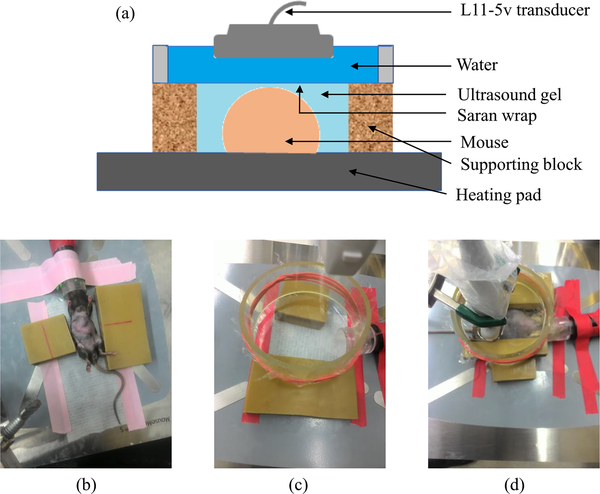
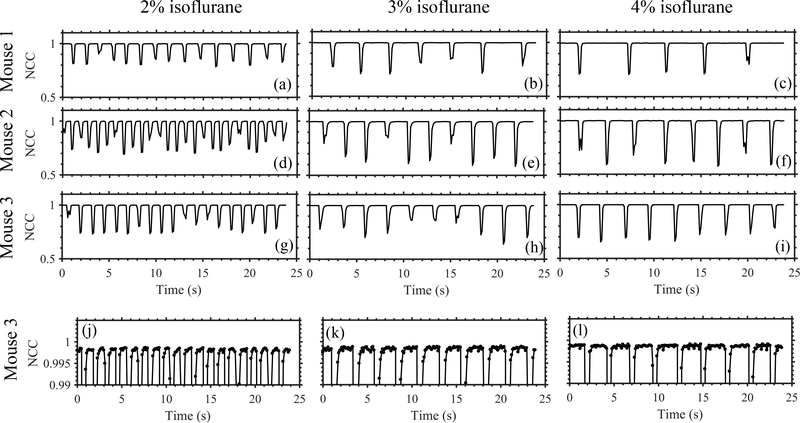
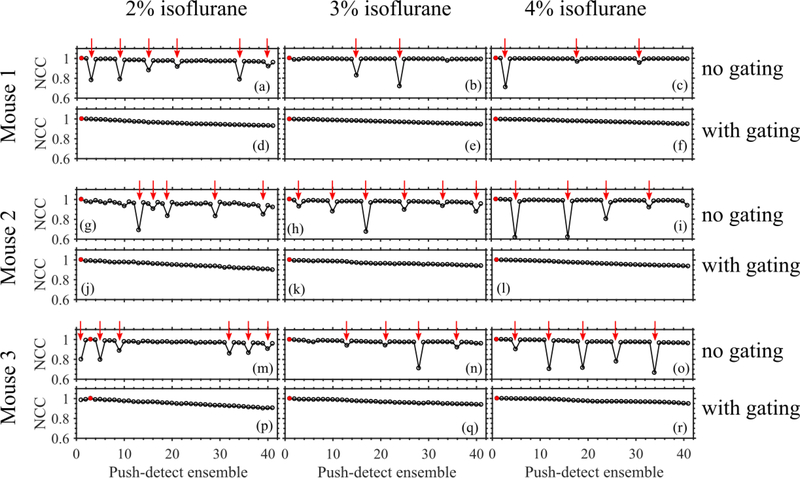
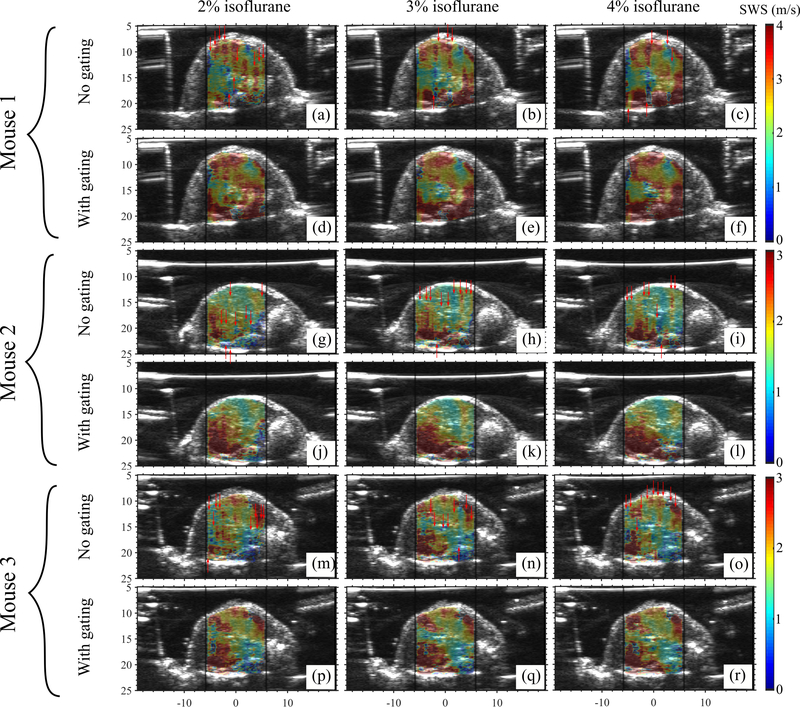
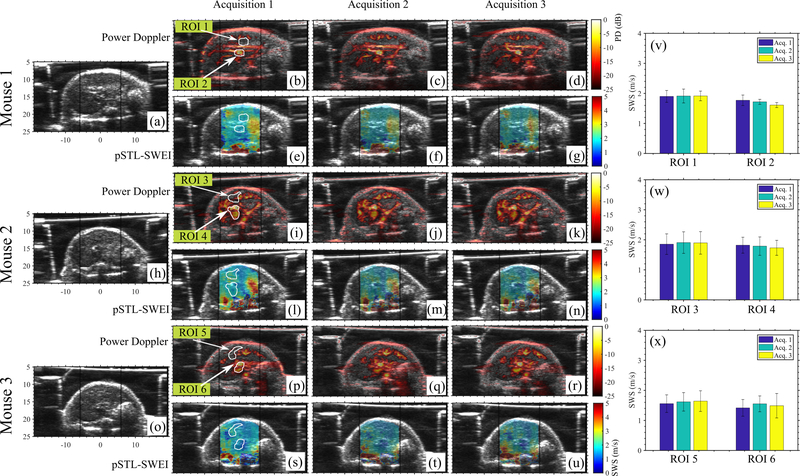
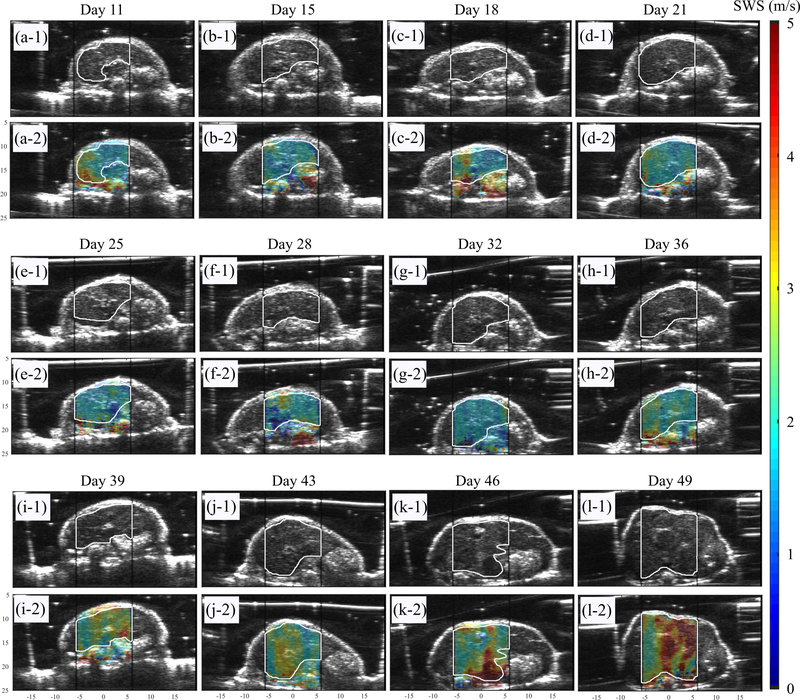
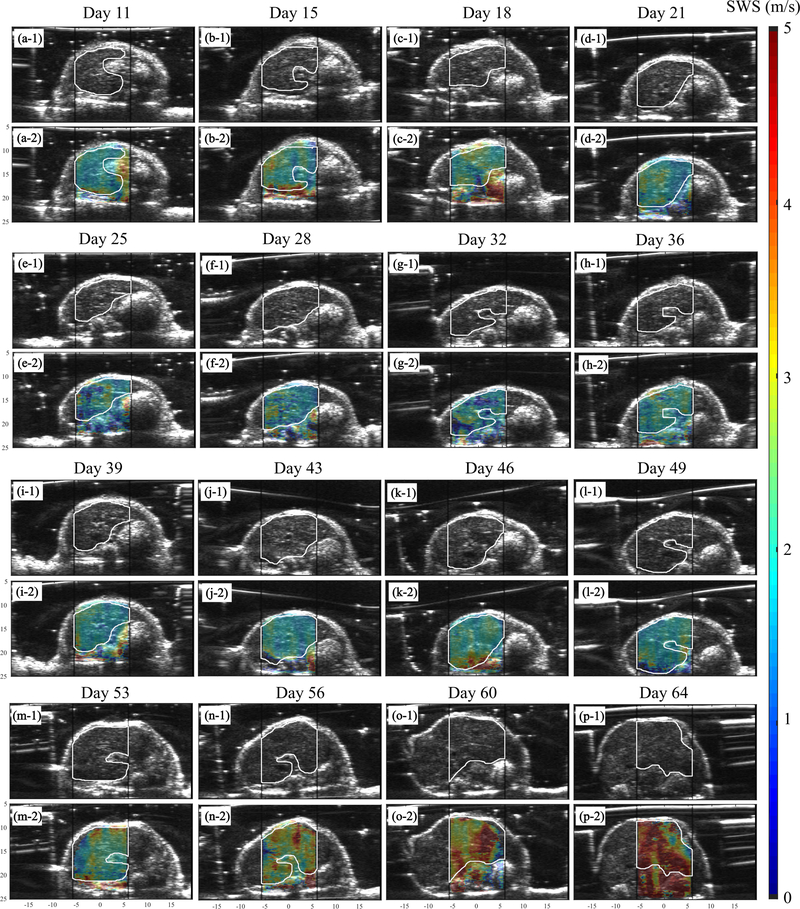
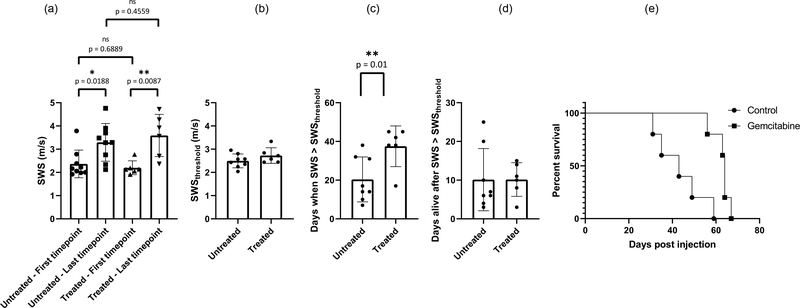
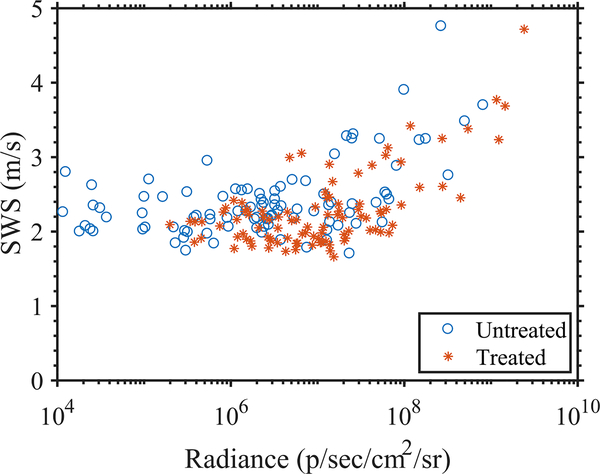
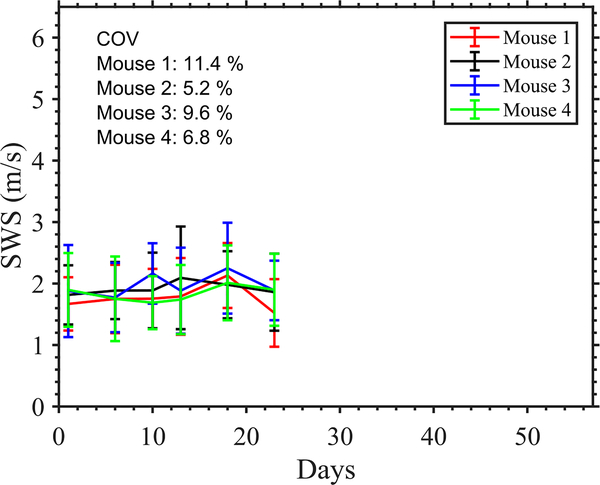
Recently, researchers have discovered the direct impact of the tumor mechanical environment on the growth, drug uptake and prognosis of tumors. While estimating the mechanical parameters (solid stress, fluid pressure, stiffness) can aid in the treatment planning and monitoring, most of these parameters cannot be quantified noninvasively. Shear wave elastography (SWE) has shown promise as a means of noninvasively measuring the stiffness of soft tissue. However, stiffness is still not a recognized imaging biomarker. While SWE has been shown to be capable of measuring tumor stiffness in humans, much important research is done in small animal preclinical models, where tumors are often too small for the resolution of traditional SWE tools. Single-track location SWE (STL-SWE) has previously been shown to overcome the fundamental resolution limit of SWE imposed by ultrasound speckle, which may make it suitable for preclinical imaging. Using STL-SWE, in this work, we demonstrate, for the first time, that the stiffness changes occurring inside metastatic murine pancreatic tumors can be monitored over long time scales (up to 9 weeks). To prevent the respiration motion from degrading the STL-SWE estimates, we developed a real-time software-based respiration gating scheme that we implemented on a Verasonics ultrasound imaging system. By imaging the liver of three healthy mice and performing correlation analysis, we confirmed that the respiration-gated STL-SWE data was free from motion corruption. By performing coregistered power-doppler imaging, we found that the local variability in liver shear wave speed (SWS) measurements increased from 5.4% to 9.9% due to blood flow. We performed a longitudinal study using a murine model of pancreatic cancer liver metastasis to assess the temporal changes (over nine weeks) in SWS in two groups: a controlled group receiving no treatment (n=8), and an experimental group (n=6) treated with Gemcitabine, a chemotherapy agent. We independently evaluated tumor burden using bioluminescence imaging (BLI). The initial and endpoint SWS measurements were statistically different (p<0.05). Additionally, when the liver SWS exceeded 2.5 ± 0.3 and 2.73 ± 0.34 m/s in untreated and treated mice, respectively, the death of the mice was imminent within approximately 10 days. The time taken for the SWS to exceed the thresholds was 17 days (on average) longer in Gemcitabine treated mice compared to the untreated ones. The survival statistics corroborated the effectiveness of Gemcitabine. Spearman correlation analysis revealed a monotonic relationship between SWE measurements (SWS) and BLI measurements (radiance) for tumors whose radiance exceeded 1×10⁷ photons/s/cm2/sr. Longitudinal measurements on the liver of four healthy mice revealed a maximum coefficient of variation of 11.4%. The results of this investigation demonstrate that with appropriate gating, researchers can use STL-SWE for small animal imaging and perform longitudinal studies using preclinical cancer models.
Figures
Similar articles
-
Ultrasound Shear Wave Elastography for Liver Disease. A Critical Appraisal of the Many Actors on the Stage.Ultraschall Med. 2016 Feb;37(1):1-5. doi: 10.1055/s-0035-1567037. Epub 2016 Feb 12. Ultraschall Med. 2016. PMID: 26871407
-
Two-Dimensional Shear Wave Elastography of Normal Soft Tissue Organs in Adult Beagle Dogs; Interobserver Agreement and Sources of Variability.Front Bioeng Biotechnol. 2020 Aug 19;8:979. doi: 10.3389/fbioe.2020.00979. eCollection 2020. Front Bioeng Biotechnol. 2020. PMID: 32974311 Free PMC article.
-
Repeatability and Agreement of Shear Wave Speed Measurements in Phantoms and Human Livers Across 6 Ultrasound 2-Dimensional Shear Wave Elastography Systems.Invest Radiol. 2020 Apr;55(4):191-199. doi: 10.1097/RLI.0000000000000627. Invest Radiol. 2020. PMID: 31977604
-
Technical performance of shear wave elastography for measuring liver stiffness in pediatric and adolescent patients: a systematic review and meta-analysis.Eur Radiol. 2019 May;29(5):2560-2572. doi: 10.1007/s00330-018-5900-6. Epub 2019 Jan 7. Eur Radiol. 2019. PMID: 30617493
-
A review of physical and engineering factors potentially affecting shear wave elastography.J Med Ultrason (2001). 2021 Oct;48(4):403-414. doi: 10.1007/s10396-021-01127-w. Epub 2021 Aug 28. J Med Ultrason (2001). 2021. PMID: 34453649 Free PMC article. Review.
Cited by
-
Preclinical Applications of Multi-Platform Imaging in Animal Models of Cancer.Cancer Res. 2021 Mar 1;81(5):1189-1200. doi: 10.1158/0008-5472.CAN-20-0373. Epub 2020 Dec 1. Cancer Res. 2021. PMID: 33262127 Free PMC article. Review.
-
High frequency ultrasound vibrational shear wave elastography for preclinical research.Phys Med Biol. 2022 Dec 7;67(24):245005. doi: 10.1088/1361-6560/aca4b8. Phys Med Biol. 2022. PMID: 36410042 Free PMC article.
-
H-scan, Shear Wave and Bioluminescent Assessment of the Progression of Pancreatic Cancer Metastases in the Liver.Ultrasound Med Biol. 2020 Dec;46(12):3369-3378. doi: 10.1016/j.ultrasmedbio.2020.08.006. Epub 2020 Sep 6. Ultrasound Med Biol. 2020. PMID: 32907773 Free PMC article.
-
Innovative Experimental Ultrasound and US-Related Techniques Using the Murine Model in Pancreatic Ductal Adenocarcinoma: A Systematic Review.J Clin Med. 2023 Dec 14;12(24):7677. doi: 10.3390/jcm12247677. J Clin Med. 2023. PMID: 38137745 Free PMC article. Review.
-
Elastic modulus-reflected liver lesion stiffness relates to worse prognosis in pancreatic cancer patients with liver metastasis.World J Surg Oncol. 2023 Aug 24;21(1):262. doi: 10.1186/s12957-023-03140-4. World J Surg Oncol. 2023. PMID: 37620975 Free PMC article.
References
-
- Nia HT, Liu H, Seano G, Datta M, Jones D, Rahbari N, Incio J, Chauhan VP, Jung K, Martin JD, Askoxylakis V, Padera TP, Fukumura D, Boucher Y, Hornicek FJ, Grodzinsky AJ, Baish JW, Munn LL, and Jain RK, “Solid stress and elastic energy as measures of tumour mechanopathology,” Nature Biomedical Engineering, vol. 1, no. 1, November 2016. - PMC - PubMed
-
- Stylianopoulos T, Martin JD, Chauhan VP, Jain SR, Diop-Frimpong B, Bardeesy N, Smith BL, Ferrone CR, Hornicek FJ, Boucher Y, Munn LL, and Jain RK, “Causes, consequences, and remedies for growth-induced solid stress in murine and human tumors,” Proceedings of the National Academy of Sciences, vol. 109, no. 38, pp. 15 101–15 108, August 2012. - PMC - PubMed
-
- Wang H, Mislati R, Ahmed R, Vincent P, Nwabunwanne SF, Gunn JR, Pogue BW, and Doyley MM, “Elastography can map the local inverse relationship between shear modulus and drug delivery within the pancreatic ductal adenocarcinoma microenvironment,” Clinical Cancer Research, vol. nil, no. nil, p. clincanres.2684.2018, 2018. [Online]. Available: 10.1158/1078-0432.ccr-18-2684 - DOI - PMC - PubMed
Publication types
MeSH terms
Grants and funding
LinkOut - more resources
Full Text Sources
Other Literature Sources
Medical
Research Materials
