. 2020 Feb 3;16(2):e1007616.
doi: 10.1371/journal.pcbi.1007616. eCollection 2020 Feb.

DeepWAS: Multivariate genotype-phenotype associations by directly integrating regulatory information using deep learning

Affiliations

DeepWAS: Multivariate genotype-phenotype associations by directly integrating regulatory information using deep learning

Janine Arloth et al. PLoS Comput Biol. .

Abstract

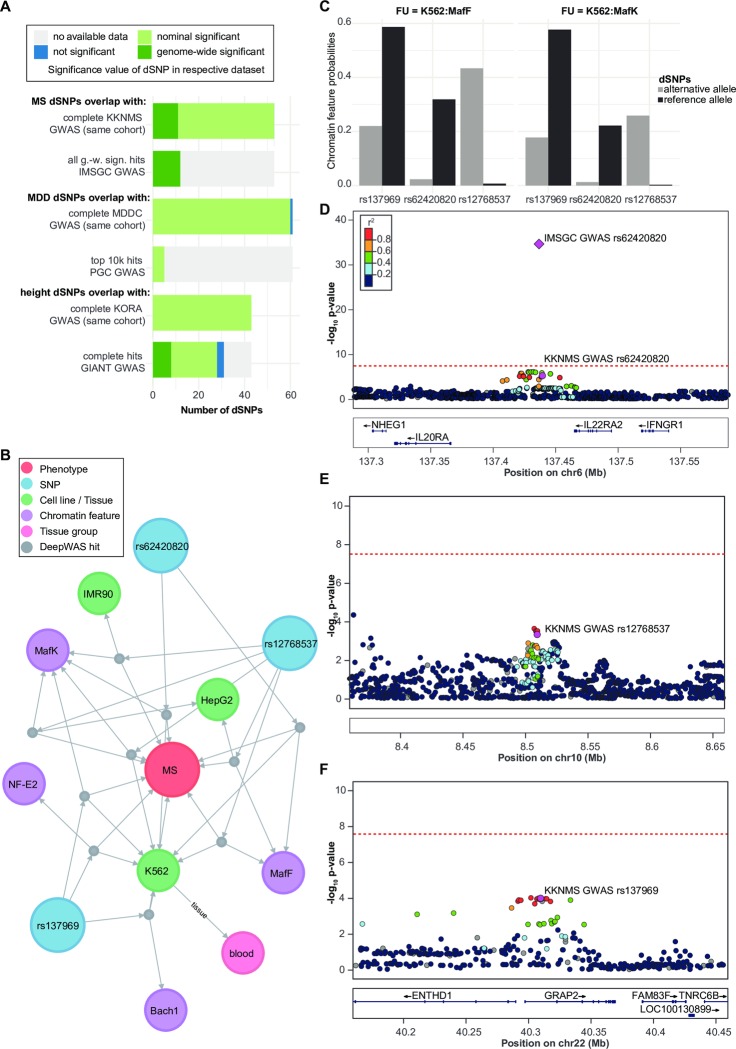
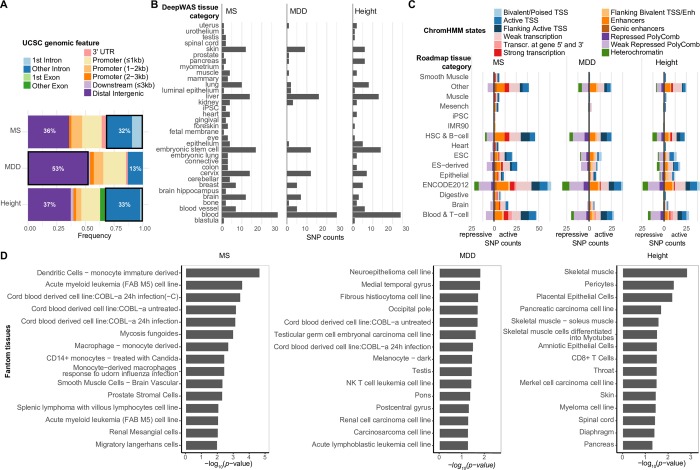
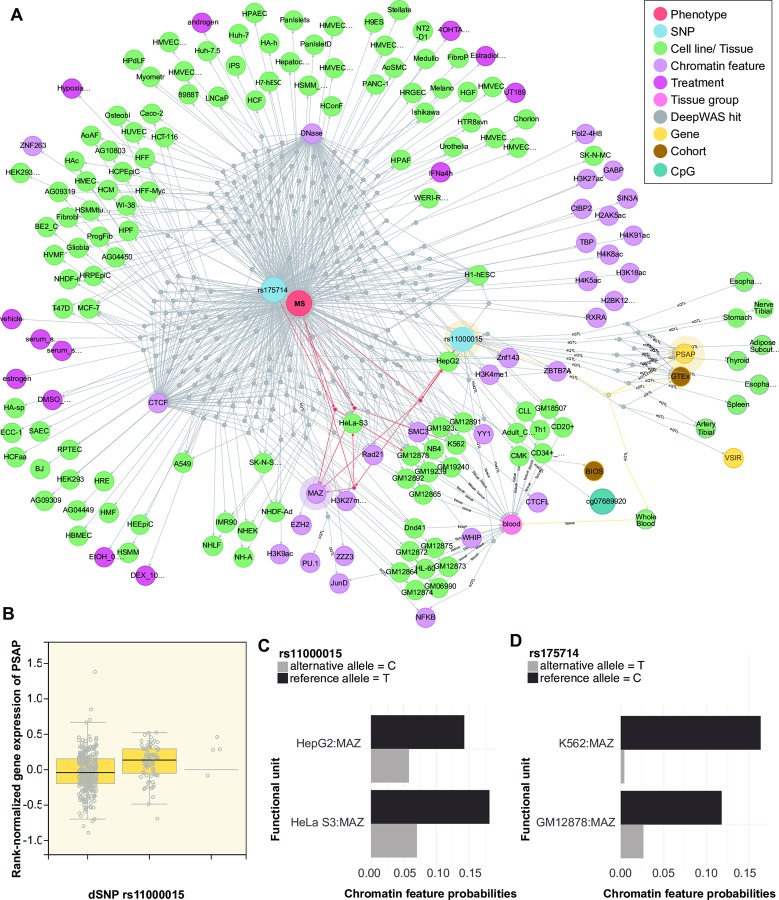
Genome-wide association studies (GWAS) identify genetic variants associated with traits or diseases. GWAS never directly link variants to regulatory mechanisms. Instead, the functional annotation of variants is typically inferred by post hoc analyses. A specific class of deep learning-based methods allows for the prediction of regulatory effects per variant on several cell type-specific chromatin features. We here describe "DeepWAS", a new approach that integrates these regulatory effect predictions of single variants into a multivariate GWAS setting. Thereby, single variants associated with a trait or disease are directly coupled to their impact on a chromatin feature in a cell type. Up to 61 regulatory SNPs, called dSNPs, were associated with multiple sclerosis (MS, 4,888 cases and 10,395 controls), major depressive disorder (MDD, 1,475 cases and 2,144 controls), and height (5,974 individuals). These variants were mainly non-coding and reached at least nominal significance in classical GWAS. The prediction accuracy was higher for DeepWAS than for classical GWAS models for 91% of the genome-wide significant, MS-specific dSNPs. DSNPs were enriched in public or cohort-matched expression and methylation quantitative trait loci and we demonstrated the potential of DeepWAS to generate testable functional hypotheses based on genotype data alone. DeepWAS is available at https://github.com/cellmapslab/DeepWAS.


Conflict of interest statement

The authors declare that no competing interests exist.

Figures

Fig 1
Fig 1. Workflow of DeepWAS.
(A): A deep-learning based framework predicts combined binding probabilities for chromatin features, cell lines, and treatments, called functional units (FU) for 1,000 bp centered around a SNP. FUs are selected for a potential functional role of a variant using a cutoff for functional scores. This process is repeated for all genotyped variants. The genotype-phenotype association is analyzed for each FU using LASSO regression with stability selection. Unlike GWAS, DeepWAS implicates a regulatory mechanism underlying the phenotype of interest with information on relevant cell lines and TFs. (B): DeepWAS was applied to 36,409 regulatory SNPs that were retained after filtering for allele-specific effects in any given FU. These SNPs were tested for an association with multiple sclerosis (MS). The heatmap shows the number of selected chromatin features vs. cell lines. Chromatin features are limited to be present in at least two distinct cell lines. Missing values, represented in white, show FUs for which no data were available.
Fig 2
Fig 2. Comparison of DeepWAS vs. GWAS results.
(A): Bar plot of the overlap of cohort-matched GWAS and consortia GWAS SNPs with dSNPs. g.-w. s = genome-wide significant. (B): Network of MS-specific dSNPs generated by using a graph database and showing the dSNP rs62420820 in the K562 cell line, a genome-wide significant signal in the IMSGC MS GWAS, but sub-threshold in the cohort-specific KKNMS GWAS. Edges represent the association relation of dSNPs, chromatin features with or without treatment, cell lines, and top-level tissue group. (C): Bar plots showing the predicted DeepSEA probabilities for dSNP sequences carrying the alternative and reference allele group by their FU. (D-F): Locus-specific Manhattan plots of the MS-specific dSNPs rs62420820, rs12768537, and rs137969, based on classical GWAS. Plots were produced using LocusZoom (https://github.com/statgen/locuszoom) with EUR samples of the 1,000 genomes November 2014 reference panel on the hg19 build. Dots represent KKNMS GWAS p-values and the diamond shows the IMSGC GWAS signal p-value. Color of the dots indicates LD with the lead variant = dSNP (magenta), grey dots have LD r2 missing.
Fig 3
Fig 3. Functional characterization of DeepWAS hits.
(A): Annotation of the genomic regions in which dSNPs are located: 63–87% of the genomic positions of dSNPs overlapped with non-coding DNA elements. Seventeen of 53 MS-specific (32%), 14 of 43 height-specific (33%) and 8 of 61 MDD-specific (13%) dSNPs mapped to introns (first and other introns). Over a half of the MDD-specific dSNPs (53%) resided in distal intergenic regions (>3 kb). None of the MS- and MDD- specific dSNPs were located in exons. (B): Bar plots for each phenotype showing the number of unique dSNPs annotated to a top-level tissue category (ENCODE). (C): Overlap of MS-, MDD-, and height-specific dSNPs with ChromHMM states from Roadmap epigenomes based on top-level tissue group matching. Most of our MS- and height-specific dSNPs mapped to predicted active chromatin states (82–86%), whereas nearly half of MDD-specific dSNPs mapped to inactive chromatin states (43%). (D) Tissue enrichment with FANTOM gene expression data. The top 15 significantly enriched tissues are shown (all p-values≤0.05).
Fig 4
Fig 4. Context-related regulatory capacity of dSNPs.
(A): Heatmap showing the percentage of overlap of MS-, MDD-, and height-specific dSNPs or their proxies (r2≥0.5) with cis-meQTL and cis-eQTL data from multiple resources, see also S2–S4 Tables. (B): Heatmap depicting GTEx tissue groups and DeepWAS top-level tissue category overlap among the MS-specific dSNP FUs.
Fig 5
Fig 5. QTL network.
(A) Network showing one of the putative key regulators for MS, dSNP rs175714 on chromosome 14. DSNP rs175714 is associated with differential TF binding of the TF MAZ, one of the top-associated loci in the KKNMS GWAS, where no significant transcriptional effect could be identified in the post hoc analysis. Edges represent the associations between dSNPs and chromatin features with or without treatment, cell lines, top-level tissue group, CpGs, and genes through dummy nodes identified either using DeepWAS or QTLs. Dummy nodes are used for preserving all entities of dSNP and QTL associations. Edges highlighted in red show the DeepWAS results for MAZ, in yellow show the eQTL connections illustrated in B, and shades refer to downstream QTL results shown in B. (B) Box plot of GTEx whole blood eQTL data showing the relationship between PSAP gene expression and dSNP rs11000015 genotype. (C-D) Chromatin feature probabilities for the significant FU of the dSNP sequences carrying the reference (black) and alternative (gray) allele.

Similar articles

Cited by

References

    1. Edwards SL, Beesley J, French JD, Dunning AM. Beyond GWASs: illuminating the dark road from association to function. The American Journal of Human Genetics. 2013;93: 779–797. 10.1016/j.ajhg.2013.10.012 - DOI - PMC - PubMed
    1. Tak YG, Farnham PJ. Making sense of GWAS: using epigenomics and genome engineering to understand the functional relevance of SNPs in non-coding regions of the human genome. Epigenetics & Chromatin. 2015;8: 57. - PMC - PubMed
    1. Robertson G, Hirst M, Bainbridge M, Bilenky M, Zhao Y, Zeng T, et al. Genome-wide profiles of STAT1 DNA association using chromatin immunoprecipitation and massively parallel sequencing. Nat Methods. 2007;4: 651–657. 10.1038/nmeth1068 - DOI - PubMed
    1. Thomas-Chollier M, Hufton A, Heinig M, OKeeffe S, Masri NE, Roider HG, et al. Transcription factor binding predictions using TRAP for the analysis of ChIP-seq data and regulatory SNPs. Nat Protoc. 2011;6: 1860–1869. 10.1038/nprot.2011.409 - DOI - PubMed
    1. Gamazon ER, Badner JA, Cheng L, Zhang C, Zhang D, Cox NJ, et al. Enrichment of cis-regulatory gene expression SNPs and methylation quantitative trait loci among bipolar disorder susceptibility variants. Mol Psychiatry. 2013;18: 340–346. 10.1038/mp.2011.174 - DOI - PMC - PubMed

Publication types