. 2020 Feb 3;16(2):e1008285.
doi: 10.1371/journal.pgen.1008285. eCollection 2020 Feb.

Evolutionary dynamics of microRNA target sites across vertebrate evolution

Affiliations

Evolutionary dynamics of microRNA target sites across vertebrate evolution

Alfred Simkin et al. PLoS Genet. .

Abstract

MicroRNAs (miRNAs) control the abundance of the majority of the vertebrate transcriptome. The recognition sequences, or target sites, for bilaterian miRNAs are found predominantly in the 3' untranslated regions (3'UTRs) of mRNAs, and are amongst the most highly conserved motifs within 3'UTRs. However, little is known regarding the evolutionary pressures that lead to loss and gain of such target sites. Here, we quantify the selective pressures that act upon miRNA target sites. Notably, selective pressure extends beyond deeply conserved binding sites to those that have undergone recent substitutions. Our approach reveals that even amongst ancient animal miRNAs, which exert the strongest selective pressures on 3'UTR sequences, there are striking differences in patterns of target site evolution between miRNAs. Considering only ancient animal miRNAs, we find three distinct miRNA groups, each exhibiting characteristic rates of target site gain and loss during mammalian evolution. The first group both loses and gains sites rarely. The second group shows selection only against site loss, with site gains occurring at a neutral rate, whereas the third loses and gains sites at neutral or above expected rates. Furthermore, mutations that alter the strength of existing target sites are disfavored. Applying our approach to individual transcripts reveals variation in the distribution of selective pressure across the transcriptome and between miRNAs, ranging from strong selection acting on a small subset of targets of some miRNAs, to weak selection on many targets for other miRNAs. miR-20 and miR-30, and many other miRNAs, exhibit broad, deeply conserved targeting, while several other comparably ancient miRNAs show a lack of selective constraint, and a small number, including mir-146, exhibit evidence of rapidly evolving target sites. Our approach adds valuable perspective on the evolution of miRNAs and their targets, and can also be applied to characterize other 3'UTR regulatory motifs.


Conflict of interest statement

The authors have declared that no competing interests exist.

Figures

Fig 1
Fig 1. Simulated 3′UTR sequences recapitulate patterns of sequence evolution observed for sequence motifs.
A) Mammalian phylogeny used in this study. Branch lengths are measured in substitutions per nucleotide site, as inferred from the UCSC hg38 100way whole genome syntenic alignment. Scale bar (and numbers) represent inferred number of substitutions per site of the original 100 way syntenic alignment. B) Schematic showing how ancestral nodes of a phylogeny are generated, and example comparisons between ancestral nodes and their direct descendants (left). Flowchart of experimental pipeline (right). C) Comparison of losses (left) and gains (right) of each possible 8mer across 3′UTR sequences, summed across species detailed in panel A, compared between simulated (x-axis; values are mean of 100 simulations) and observed (y-axis). Count densities (see log2 scalebar), represent the number of points within a distance of 3 from the point in question, and have a pseudocount of 1 added to avoid taking the log of 0. Dashed red line indicates an idealized x = y relationship between simulated and observed counts.
Fig 2
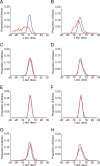
Fig 2. Target sites of deeply conserved miRNAs are lost and gained rarely in 3′UTRs.
Each panel depicts the proportion of all 8mers (y-axis) that fall at a given number of standard deviations above or below the mean of simulations (x-axis). All 65,536 8mers are plotted in blue, and 8mer miRNA target sites in red. (A, B) Analysis of miRNA target site loss and gain events (respectively) in 3′UTRs, for 75 deeply conserved vertebrate miRNAs. (C, D) Analysis of miRNA target site loss and gain events (respectively) in intronic sequence, for deeply conserved miRNAs. (E, F) Analysis of miRNA target site loss and gain events (respectively) in shuffled 3′UTRs, for deeply conserved miRNAs. (G, H) Analysis of miRNA target site loss and gain events (respectively) in 3′UTRs, for moderately conserved miRNAs.
Fig 3
Fig 3. MiRNA target sites with recent substitutions are under strong selection.
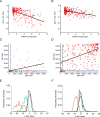
Analyses of the subset of target sites that have undergone at least one substitution within mammals are depicted (A, B; losses and gains, respectively), both for all 8mers (in blue) and for targets of deeply conserved miRNAs (in red), otherwise as described in Fig 2.
Fig 4
Fig 4. Selection against gain and loss of miRNA target sites correlates with miRNA age.
The age of each miRNA, as measured by the summed branch length across which each full length miRNA is conserved (x-axis measured in genome-wide substitutions per site, larger numbers represent greater conservation), compared against the strength of selection acting on each target site (y-axis, standard deviations below the mean of simulated values), for losses and gains of sites (A and B, respectively). (C, D) miRNA gain ranks of individual miRNAs relative to all 8mers (x-axis, ranked by standard deviations above or below the mean of simulations) versus miRNA loss ranks relative to all 8mers (y-axis), analyzed for 75 deeply conserved miRNAs (C) and 299 moderately conserved miRNAs (D). miRNAs considered to be under negative selection are those below a rank of 3277 (5% of 65,536, dashed lines). (E, F) Skew of proportion of miRNA loss ranks (E) and gain ranks (F) at a given number of standard deviations from simulated values for 75 deeply conserved miRNAs, as described in Fig 2, separated into those in miRNA group 1 (constrained below 5% threshold for gains and losses in panel C; in red), group 2 (constrained for losses but not gains; in green), and group 3 (not constrained for gains nor losses; in black) as compared to the proportions of all 65,536 8mers (blue).
Fig 5
Fig 5. Patterns of selection observed in mammals are recapitulated in Drosophila.
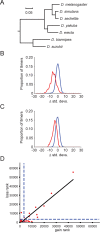
(A) Phylogeny of Drosophila species, as gathered from the UCSC dm6 multiz 15 way syntenic genome-wide alignment. Branch lengths are measured in units of inferred substitutions per site (relative to each ancestral sequence). (B, C) skews in proportion of 43 deeply conserved insect miRNAs a given number of standard deviations from the mean of simulated values, as described in Fig 2. (D) Individual gain and loss ranks of 43 insect miRNAs, as described in Fig 4C. Blue dotted lines represent a 5% threshold below which the turnover rates of the binding sites of a miRNA are considered ‘constrained’.
Fig 6
Fig 6. Target sites for individual miRNAs exhibit distinct patterns of selection.
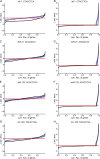
For each miRNA, all 3′UTRs that undergo substitutions that destroy or create an 8mer miRNA target site were analyzed. For each 3′UTR, the total number of such substitutions was evaluated relative to the mean of simulated substitutions for that 3′UTR, and the number of standard deviations above or below the mean recorded (y-axis), ordering genes from those that fall the greatest number of standard deviations below the mean to those that fall the greatest number of standard deviations above the mean (x-axis). The black line represents scores for the observed dataset as compared to the mean of 99 simulated datasets. The purple lines represent scores for each of the 100 simulated datasets as compared to the mean of the remaining 99 simulations, and serve as a measure of expected stochastic fluctuations. Regions in which the black line is above all other lines represent an excess of substitution events (positive selection favoring substitutions), while regions in which the black line is below all other lines represent a depletion of substitution events (negative selection against substitutions). (A, C, E, G) Analysis of target site loss rates (left panels) for the 8mer target sites corresponding to the miRNAs let-7, mir-21, mir-122, and mir-148, respectively. (B, D, F, H) Analysis of target site gain rates (right panels), otherwise as for panels A, C, E, and G.
Fig 7
Fig 7. Interconversions that strengthen or weaken miRNA target sites are disfavored.
Each panel calculates pairwise comparisons between the foreground and background rates at which the indicated miRNA target sites undergo substitutions (see methods). The ancestral target site type is represented along the x-axis, and the descendant along the y-axis. Substitutions that increase the average strength of a target site are below and to the left of the diagonal (grey boxes), while substitutions that decrease the average strength are above and to the right. Significance is color-coded (see legend) and plotted as -log10(P-value), using Wilcoxon rank-sum comparisons between the background (all 8mers) and foreground (miRNA sequences) rates. Insignificant P-values (P>0.05) are color coded white, and significant P-values that favor strengthening or weakening of miRNA target sites (most of which are only nominally significant, and not significant with a multiple comparison correction) are marked with an asterisk. (A) Analysis of target site conversion events for all 75 deeply conserved vertebrate miRNAs (B, C, D) Analysis of target site conversion events for deeply conserved miRNAs with strong selection against both gain and loss events in their target sites (B; referred to as group 1 in the main text), deeply conserved miRNAs with strong selection against loss events but not gain events (C; group 2), and deeply conserved miRNAs with no strong selection against loss or gain events (D, group 3).
Fig 8
Fig 8. Analysis of rates of loss and gain of functional 3′UTR regulatory elements.
(A, B) Fractions of the 1,000 most constrained 8mers corresponding to miRNA target sites, Pumilio response elements, poly(A) signal sequences, Fox protein binding sites, AU rich elements, and motifs of unknown function, for losses (A) and gains (B), analyzed as described in Fig 1. (C, D) Fractions of the 1,000 least constrained 8mers, otherwise as described in panels A and B.

Similar articles

Cited by

References

    1. Schmitz JF, Zimmer F, Bornberg-Bauer E. Mechanisms of transcription factor evolution in Metazoa. Nucleic Acids Res. 2016;44(13):6287–97. 10.1093/nar/gkw492 - DOI - PMC - PubMed
    1. Schwaiger M, Schonauer A, Rendeiro AF, Pribitzer C, Schauer A, Gilles AF, et al. Evolutionary conservation of the eumetazoan gene regulatory landscape. Genome Res. 2014;24(4):639–50. 10.1101/gr.162529.113 - DOI - PMC - PubMed
    1. Vinogradov AE, Anatskaya OV. Organismal complexity, cell differentiation and gene expression: human over mouse. Nucleic Acids Res. 2007;35(19):6350–6. 10.1093/nar/gkm723 - DOI - PMC - PubMed
    1. The Chimpanzee Sequencing and Analysis Consortium. Initial sequence of the chimpanzee genome and comparison with the human genome. Nature. 2005;437(7055):69–87. 10.1038/nature04072 . - DOI - PubMed
    1. Kent WJ, Sugnet CW, Furey TS, Roskin KM, Pringle TH, Zahler AM, et al. The human genome browser at UCSC. Genome Res. 2002;12(6):996–1006. 10.1101/gr.229102 - DOI - PMC - PubMed

Publication types