. 2020 Feb 3;16(2):e1008608.
doi: 10.1371/journal.pgen.1008608. eCollection 2020 Feb.

Interaction of yeast Rad51 and Rad52 relieves Rad52-mediated inhibition of de novo telomere addition

Affiliations

Interaction of yeast Rad51 and Rad52 relieves Rad52-mediated inhibition of de novo telomere addition

Esther A Epum et al. PLoS Genet. .

Abstract

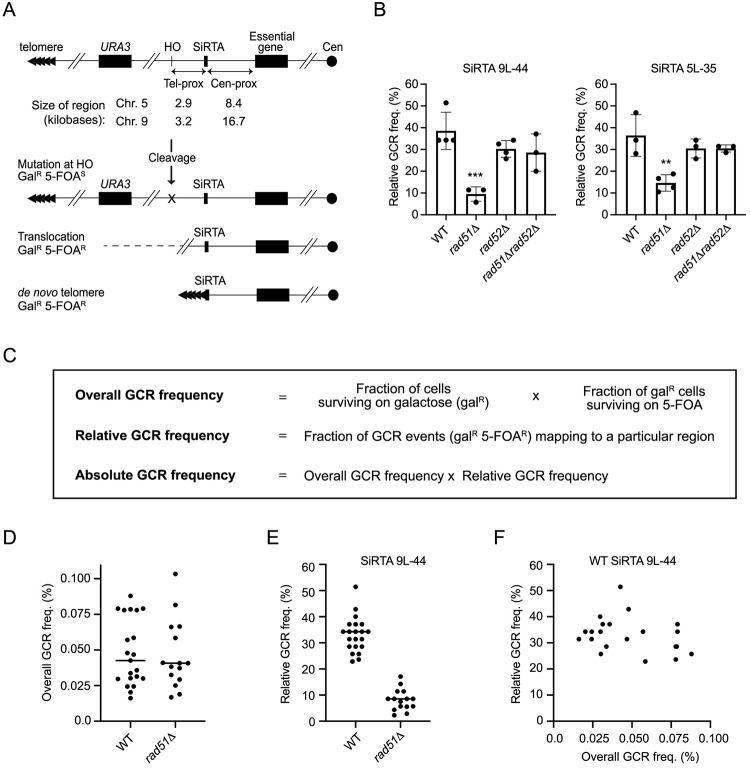
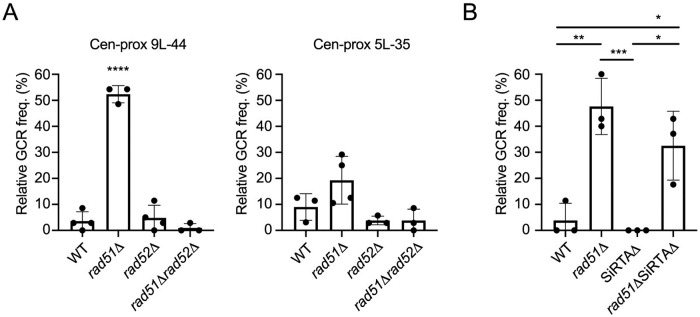
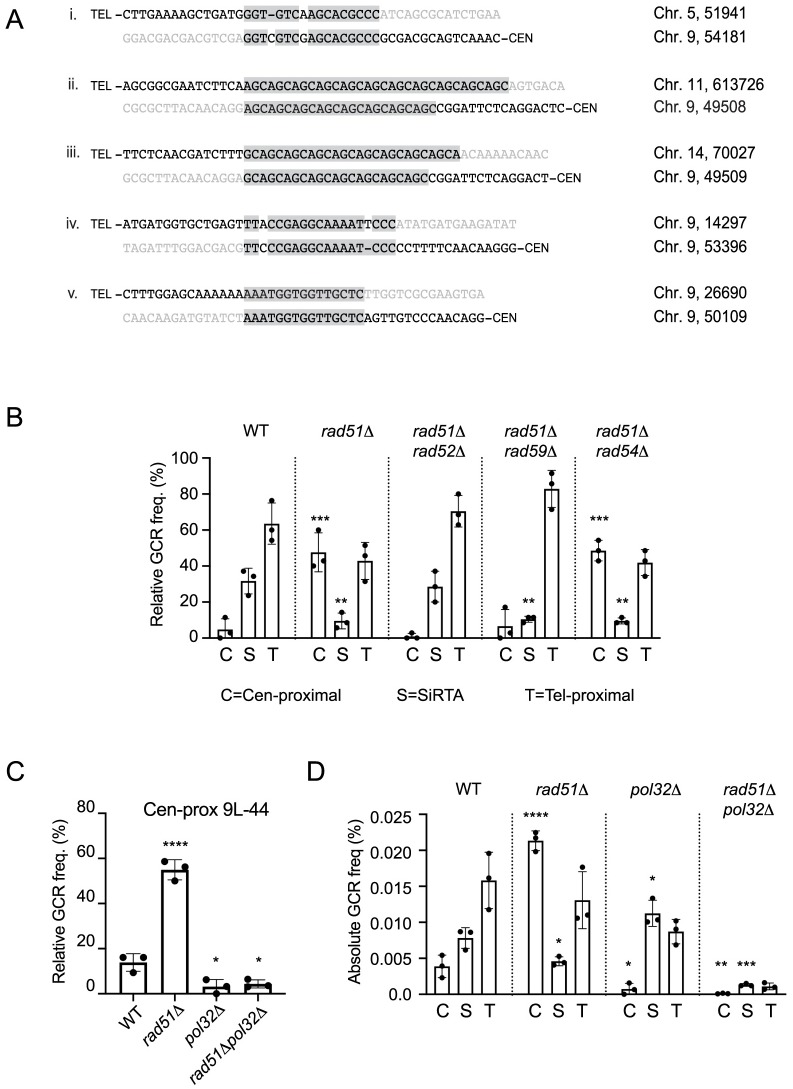
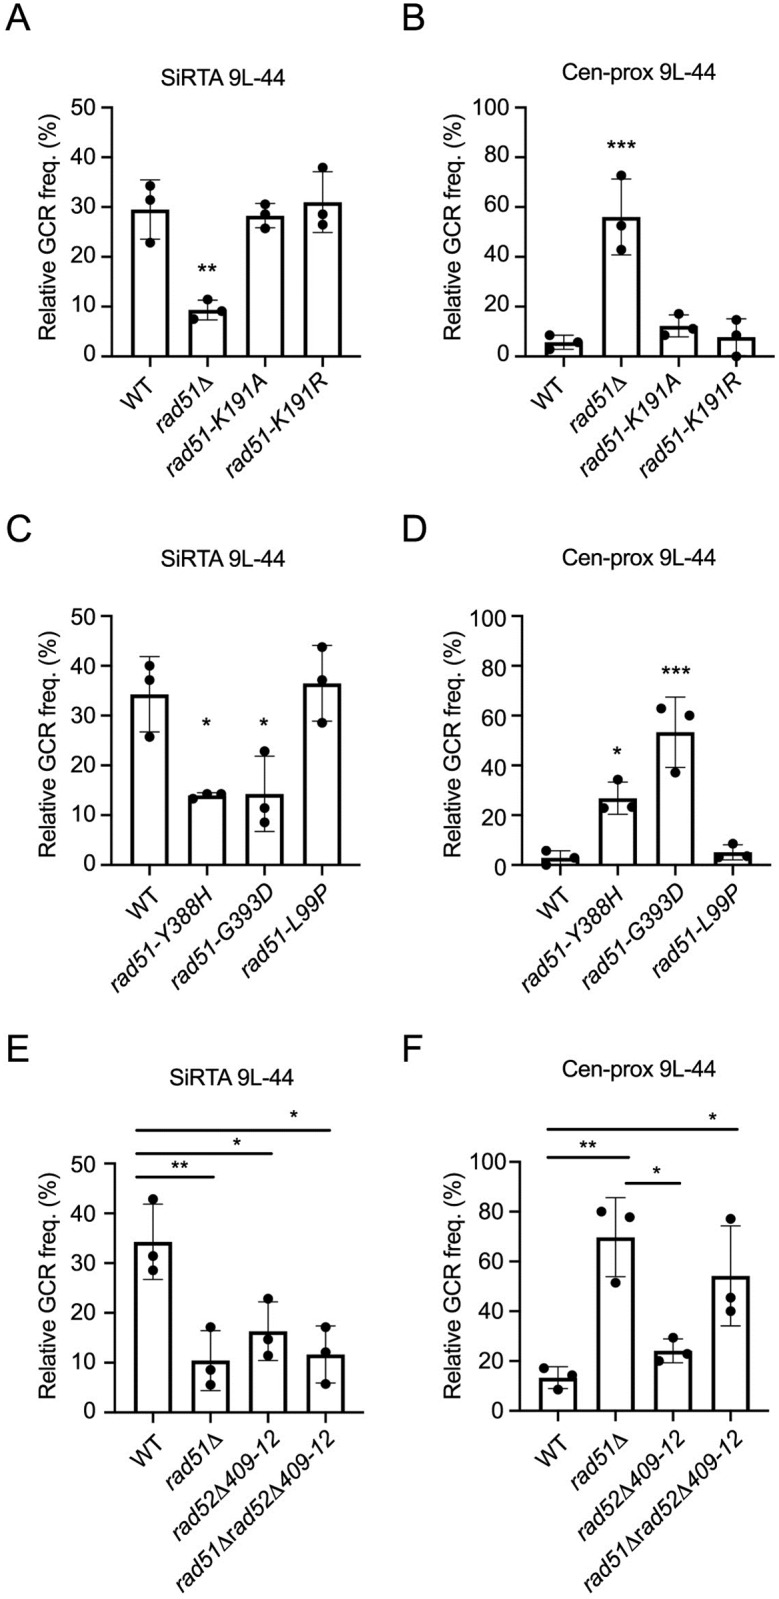
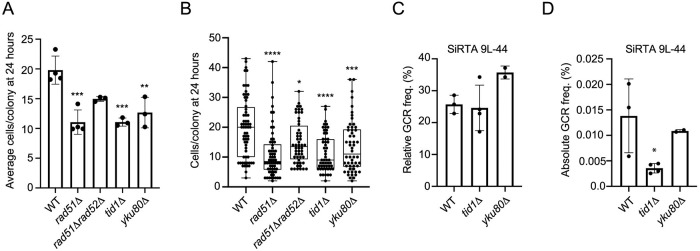
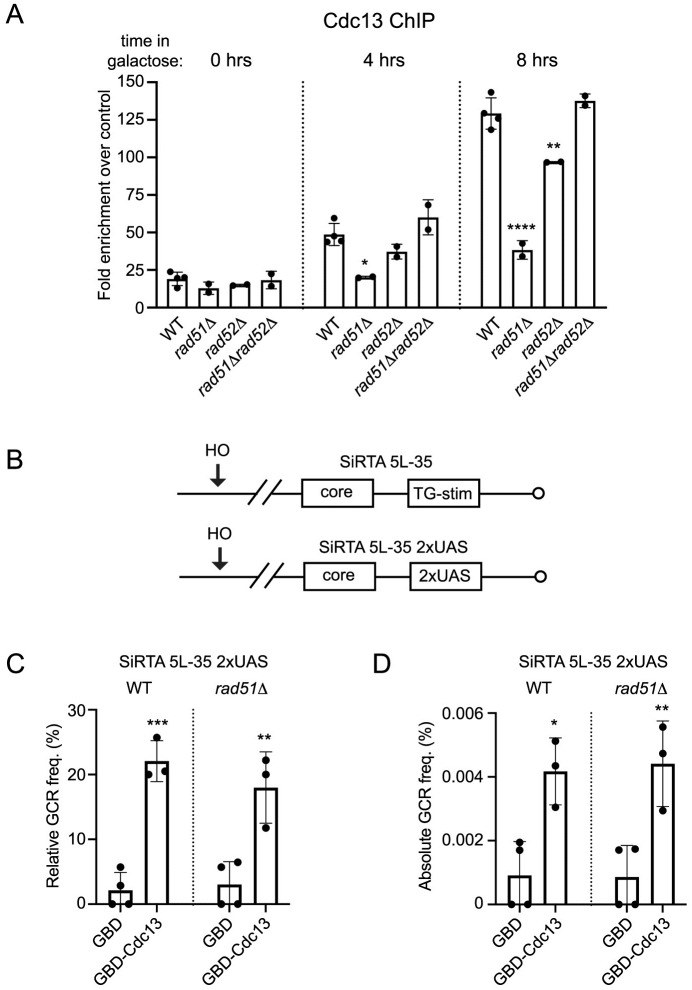
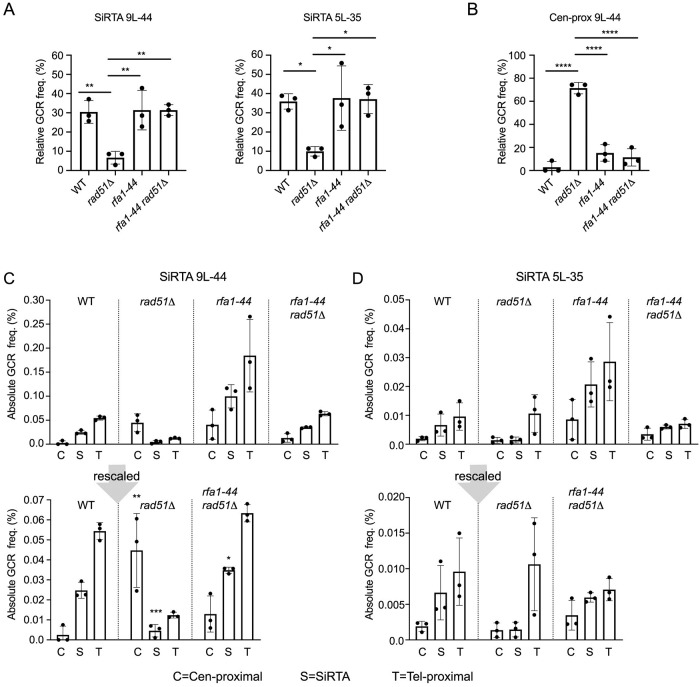
DNA double-strand breaks (DSBs) are toxic forms of DNA damage that must be repaired to maintain genome integrity. Telomerase can act upon a DSB to create a de novo telomere, a process that interferes with normal repair and creates terminal deletions. We previously identified sequences in Saccharomyces cerevisiae (SiRTAs; Sites of Repair-associated Telomere Addition) that undergo unusually high frequencies of de novo telomere addition, even when the original chromosome break is several kilobases distal to the eventual site of telomerase action. Association of the single-stranded telomere binding protein Cdc13 with a SiRTA is required to stimulate de novo telomere addition. Because extensive resection must occur prior to Cdc13 binding, we utilized these sites to monitor the effect of proteins involved in homologous recombination. We find that telomere addition is significantly reduced in the absence of the Rad51 recombinase, while loss of Rad52, required for Rad51 nucleoprotein filament formation, has no effect. Deletion of RAD52 suppresses the defect of the rad51Δ strain, suggesting that Rad52 inhibits de novo telomere addition in the absence of Rad51. The ability of Rad51 to counteract this effect of Rad52 does not require DNA binding by Rad51, but does require interaction between the two proteins, while the inhibitory effect of Rad52 depends on its interaction with Replication Protein A (RPA). Intriguingly, the genetic interactions we report between RAD51 and RAD52 are similar to those previously observed in the context of checkpoint adaptation. Forced recruitment of Cdc13 fully restores telomere addition in the absence of Rad51, suggesting that Rad52, through its interaction with RPA-coated single-stranded DNA, inhibits the ability of Cdc13 to bind and stimulate telomere addition. Loss of the Rad51-Rad52 interaction also stimulates a subset of Rad52-dependent microhomology-mediated repair (MHMR) events, consistent with the known ability of Rad51 to prevent single-strand annealing.


Conflict of interest statement

The authors have declared that no competing interests exist.

Figures

Fig 1
Fig 1. Rad51 promotes de novo telomere addition at SiRTAs 9L-44 and 5L-35 by inhibiting Rad52 function.
(A) Schematic of the HO cleavage assay system. MCM10 and PCM1 are the most distal essential genes on the left arms of chromosome 9 and 5, respectively. Cleavage is induced by the expression of HO endonuclease upon plating on galactose-containing medium, surviving colonies lacking URA3 function are selected on media containing 5-FOA, and the approximate location of each GCR event is mapped by PCR to the SiRTA, the region centromere-proximal to the SiRTA (Cen-prox), or the region telomere-proximal to the SiRTA (Tel-prox). The sizes in kilobases of each of these regions are shown for the SiRTAs on chromosomes 5 and 9. (B) The relative GCR frequency within the indicated SiRTA is shown for WT and mutant strains. Averages from at least three independent experiments are shown with standard deviations. Strains statistically different from WT by ANOVA with Dunnett’s multiple comparisons test are indicated by asterisks (**p <0.01; ***p <0.001). (C) Definitions and methods for calculating the overall, relative, and absolute frequencies of GCR formation. (D) Overall GCR frequency (%) determined in multiple independent experiments in the RAD51 (WT) and rad51Δ strains after HO cleavage on chromosome 9. Sample numbers are 21 for WT and 15 for rad51Δ. (E) Relative GCR frequency in SiRTA 9L-44 from the same experiments shown in D. p<0.0001 by Student’s t test. (F) Plot of overall GCR frequency versus relative GCR frequency in SiRTA 9L-44 for the WT experiments shown in D and E.
Fig 2
Fig 2. A subset of repair events centromere-proximal to SiRTA 9L-44 increases in frequency upon deletion of RAD51.
(A) The relative GCR frequency in the region centromere-proximal to SiRTAs 9L-44 and 5L-35 is shown for the indicated strains. The strain statistically different from WT by ANOVA with Dunnett’s multiple comparisons test is indicated by asterisks. (B) The relative GCR frequency in the region centromere-proximal to SiRTA 9L-44 is shown for the indicated strains. In the SiRTAΔ strain, no GCR events were observed in the centromere-proximal region. Values are averages from three independent experiments; error bars represent standard deviation. Averages indicated by asterisks are statistically different by ANOVA with Tukey’s multiple comparisons test (*p<0.05; **p <0.01; ***p<0.001; ****p<0.0001).
Fig 3
Fig 3. Microhomology-mediated repair requires Rad52, Pol32, and Rad59 and is inhibited by Rad51.
(A) Unique breakpoint sequences identified by nanopore sequencing in twelve independent rad51Δ strains are shown. Event (iv) was recovered independently eight times, while the other rearrangements occurred once. Bases in gray are present on the original chromosome, while bases in black are those retained in the rearranged chromosome. The shaded regions indicate microhomologies utilized in mediating repair. The chromosome coordinate of each rearrangement is indicated. Additional information is available in S1 Data. (B) The relative GCR frequency in each region on chromosome 9 is shown in the indicated strains. C, S, and T indicate centromere-proximal, SiRTA, and telomere-proximal events, respectively. Data for rad51Δ rad52Δ are repeated from Figs 1B and 2A for comparison. Values are averages from 3 independent experiments with standard deviation. For the centromere-proximal and SiRTA regions only, averages were compared to the WT sample in that same region by ANOVA with Dunnett’s multiple comparisons test. (C) The relative GCR frequency in the region centromere-proximal to SiRTA 9L-44 is shown for the indicated strains. Averages indicated by asterisks are statistically different by ANOVA with Dunnett’s multiple comparisons test. (D) The absolute GCR frequency (see Fig 1C for calculation) in each region on chromosome 9 is shown in the indicated strains from the same experiments as panel C. Values are averages from 3 independent experiments with standard deviation. For the centromere-proximal and SiRTA regions only, averages were compared to the WT sample in that same region by ANOVA with Dunnett’s multiple comparisons test (*p<0.05; **p <0.01; ***p<0.001; ****p<0.0001).
Fig 4
Fig 4. The Rad52-dependent effects of Rad51 on telomere addition and micro-homology mediated repair require the Rad51-Rad52 interaction.
(A-D) The relative GCR frequency in SiRTA 9L-44 (A, C) or the centromere-proximal region (B, D) is shown for the indicated strains. Averages and standard deviations are from three independent experiments. Strains statistically different from the corresponding WT control strain by ANOVA with Dunnett’s multiple comparisons test are indicated by asterisks. (E-F) The relative GCR frequency in SiRTA 9L-44 (E) or the centromere-proximal region (F) is shown for the indicated strains. Averages and standard deviations are from three independent experiments. Values that are statistically different by ANOVA with Tukey’s multiple comparison test are indicated by asterisks (*p<0.05, **p<0.01; ***p<0.001). Overall GCR frequencies of the strains analyzed in this figure did not differ significantly from those frequencies measured in the RAD51 and rad51Δ strains.
Fig 5
Fig 5. Adaptation-defective strains do not show consistently reduced GCR formation at SiRTA.
Individual unbudded cells from the indicated strains were micro-manipulated on an agar plate containing galactose (to induce HO endonuclease expression). After 24 hours, the number of cells in each colony was determined. (A) The average number of cells per colony after 24 hours is plotted as an average and standard deviation of 3 or 4 independent experiments. Each experiment followed the growth of 11–18 micromanipulated cells. Values that are statistically different from WT by ANOVA with Tukey’s multiple comparisons test are indicated by asterisks. All other pairwise comparisons are not significant. (B) Box and whisker plots show the median and 25 and 75% range of colony size for all micromanipulated cells analyzed in experiments summarized in A. Values that are statistically different from WT by ANOVA with Tukey’s multiple comparisons test are indicated by asterisks. All other pairwise comparisons are not significant. (C) The relative GCR frequency in SiRTA 9L-44 is shown for the indicated strains. (D) The absolute GCR frequency in SiRTA 9L-44 is shown for the indicated strains from the same experiment shown in C. For C and D, averages and standard deviations are from at least two independent experiments. Strains statistically different from the corresponding WT control strain by ANOVA with Dunnett’s multiple comparisons test are indicated by asterisks (*p <0.05; **p<0.01; ***p<0.001; ****p<0.0001).
Fig 6
Fig 6. Rad51 promotes the recruitment of Cdc13 to SiRTAs.
(A) ChIP analyses of Cdc13 binding at SiRTA 9L-44 in WT, rad51Δ, rad52Δ, and rad51Δ rad52Δ strains are shown for the indicated timepoints following induction of HO cleavage. SiRTA 9L-44 IP signals are normalized to signal at the control ARO1 locus at the 0 hr timepoint (see Methods). Within a given timepoint, strains that differ significantly from WT by ANOVA with Dunnett’s multiple comparisons test are indicated. (B) Diagram of SiRTA 5L-35 showing the core and TG-stim sequences in an unaltered strain (top). In the experimental strain used in panel C, the TG-stim sequence is replaced with two copies of the Gal4 upstream activating sequence (UAS; bottom). (C) The relative GCR frequency in SiRTA 5L-35 is shown for WT or rad51Δ strains containing two copies of the Gal4-UAS sequence integrated in place of the SiRTA-Stim. Cells are transformed with vector expressing GBD only (GBD) or vector expressing full-length Cdc13 fused to the Gal4 DNA binding domain (GBD-Cdc13). Data are averages and standard deviations from at least three independent experiments. Averages indicated by asterisks are statistically different from the corresponding GBD control strains by ANOVA with Tukey’s multiple comparisons test. Average relative GCR frequencies measured in the presence of GBD only or GBD-Cdc13 are not different between the WT and rad51Δ backgrounds. (D) The absolute GCR frequency in SiRTA 5L-35 is shown in the indicated strains from the same experiments shown in panel C. Values are averages from at least 3 independent experiments with standard deviation. Averages indicated by asterisks are statistically different from the corresponding GBD control strains by ANOVA with Tukey’s multiple comparisons test. Average absolute GCR frequencies measured in the presence of GBD only or GBD-Cdc13 are not different between the WT and rad51Δ backgrounds. (*p<0.05; **p <0.01; ***p<0.001; ****p<0.0001).
Fig 7
Fig 7. Disruption of the Rad52-Rfa1 interaction suppresses the de novo telomere addition defect of rad51Δ.
(A) The relative GCR frequency in SiRTA 9L-44 and 5L-35 is shown for the indicated strains. (B) The relative GCR frequency in the region centromere-proximal to SiRTA 9L-44 is shown for the same experiments presented in panel A (left graph). Averages and standard deviations are from three independent experiments. Averages indicated by asterisks are statistically different by ANOVA with Tukey’s multiple comparisons test. (C, D) Because the GCR frequency of the rfa1-44 strain is significantly higher than WT on both chromosomes 5 and 9, the absolute GCR frequency in each region of chromosome 9 (C) or 5 (D) is shown from the same experiments as panel A. Values are averages from three independent experiments with standard deviation. Results for the WT, rad51Δ, and rad51Δ rfa1-44 strains are shown on a different scale underneath. Statistical significance is only shown on the rescaled graph. For the centromere-proximal and SiRTA regions only, averages were compared to the WT sample in that same region by ANOVA with Dunnett’s multiple comparisons test (*p <0.05; **p<0.01; ***p<0.001; ****p<0.0001).

Similar articles

Cited by

References

    1. Wellinger RJ, Zakian VA. Everything you ever wanted to know about Saccharomyces cerevisiae telomeres: beginning to end. Genetics. 2012;191(4):1073–105. 10.1534/genetics.111.137851 - DOI - PMC - PubMed
    1. Osterhage JL, Friedman KL. Chromosome end maintenance by telomerase. J Biol Chem. 2009;284(24):16061–5. 10.1074/jbc.R900011200 - DOI - PMC - PubMed
    1. Mehta A, Haber JE. Sources of DNA double-strand breaks and models of recombinational DNA repair. Cold Spring Harb Perspect Biol. 2014;6(9):a016428 10.1101/cshperspect.a016428 - DOI - PMC - PubMed
    1. Aylon Y, Kupiec M. DSB repair: the yeast paradigm. DNA Repair (Amst). 2004;3(8–9):797–815. 10.1016/j.dnarep.2004.04.013 - DOI - PubMed
    1. Brill SJ, Stillman B. Replication factor-A from Saccharomyces cerevisiae is encoded by three essential genes coordinately expressed at S phase. Genes Dev. 1991;5(9):1589–600. 10.1101/gad.5.9.1589 - DOI - PubMed

Publication types

MeSH terms

Substances