. 2020 Feb 3;15(2):e0222689.
doi: 10.1371/journal.pone.0222689. eCollection 2020.

AIRE is induced in oral squamous cell carcinoma and promotes cancer gene expression

Affiliations

AIRE is induced in oral squamous cell carcinoma and promotes cancer gene expression

Chi Thi Kim Nguyen et al. PLoS One. .

Abstract

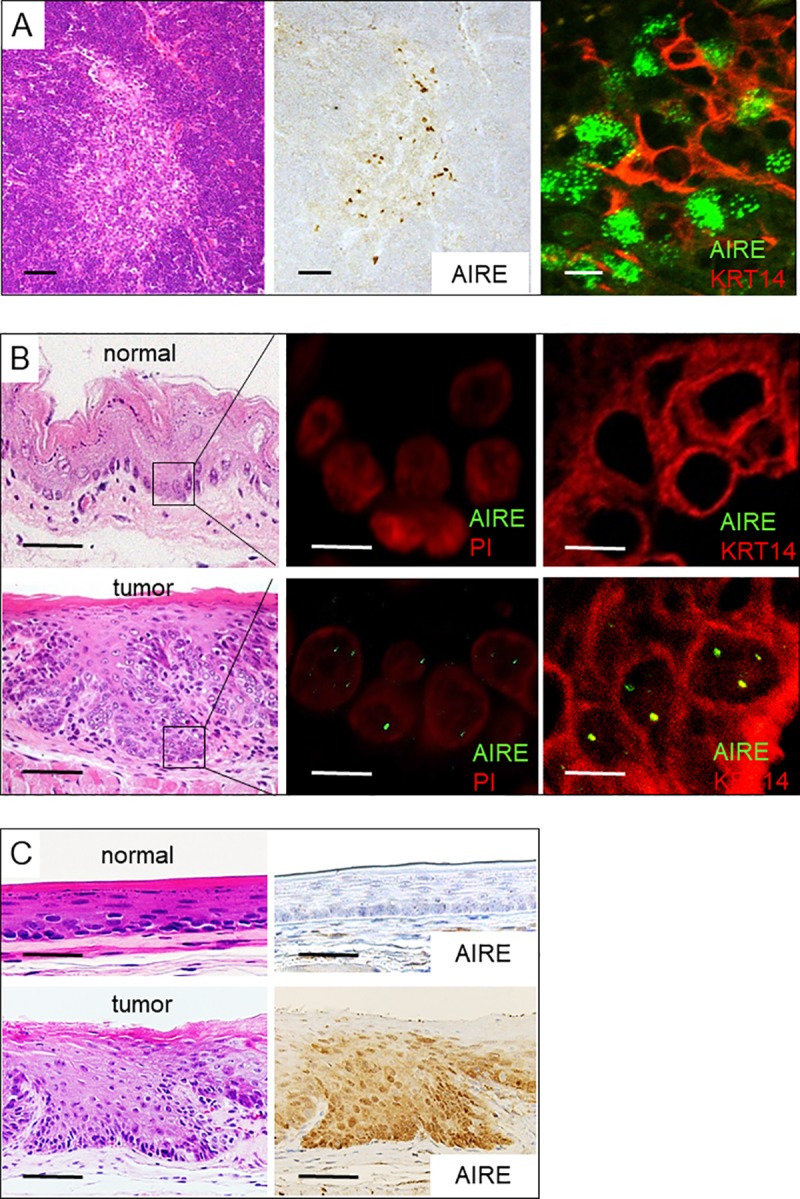
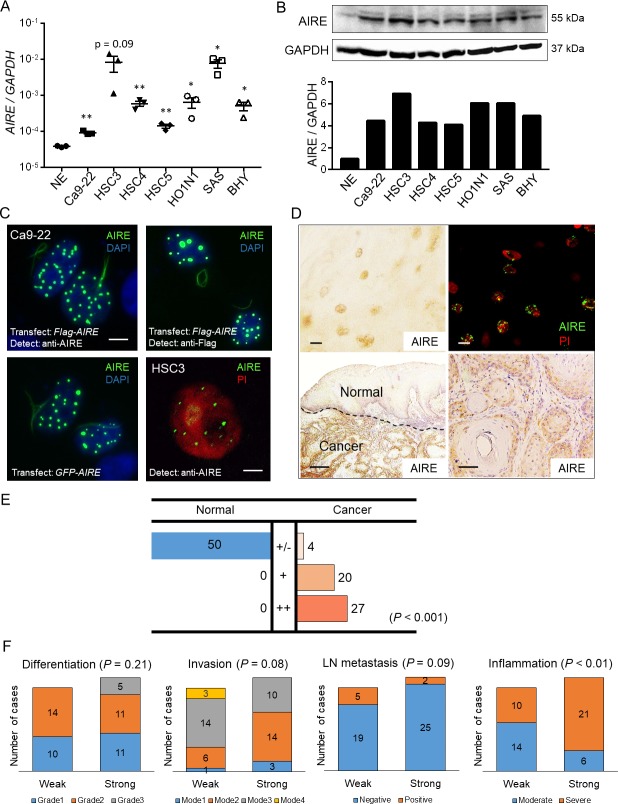
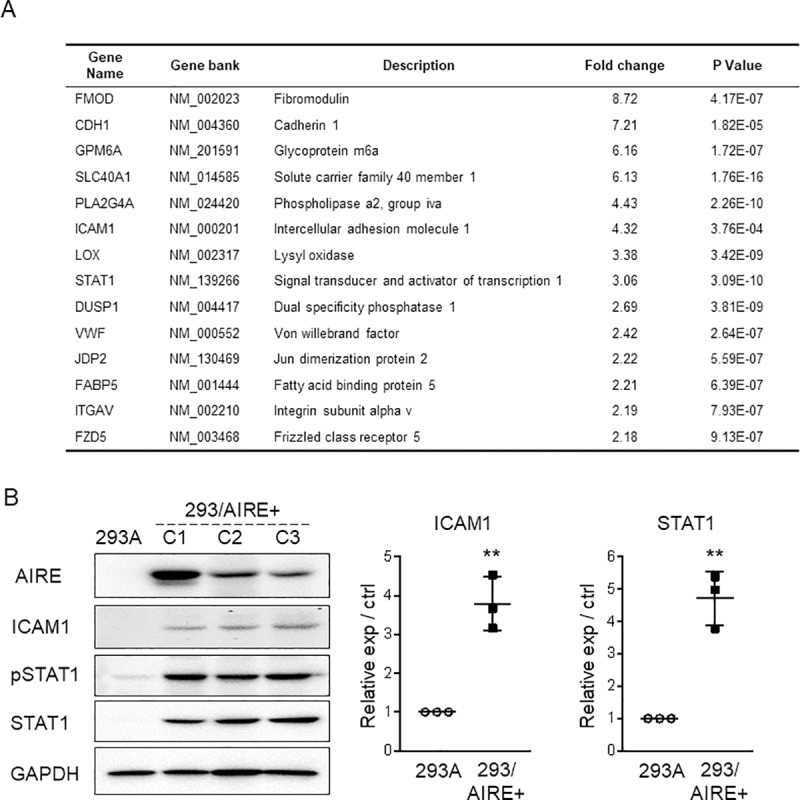
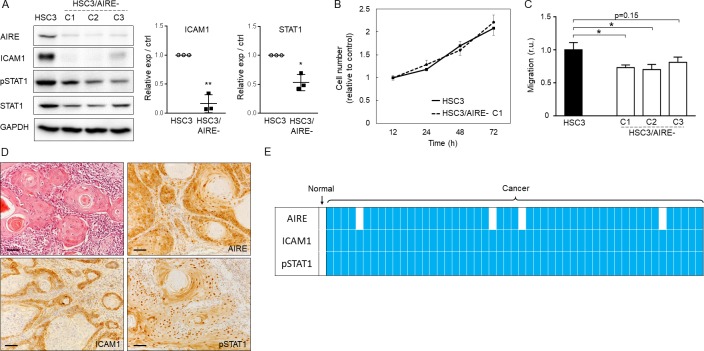
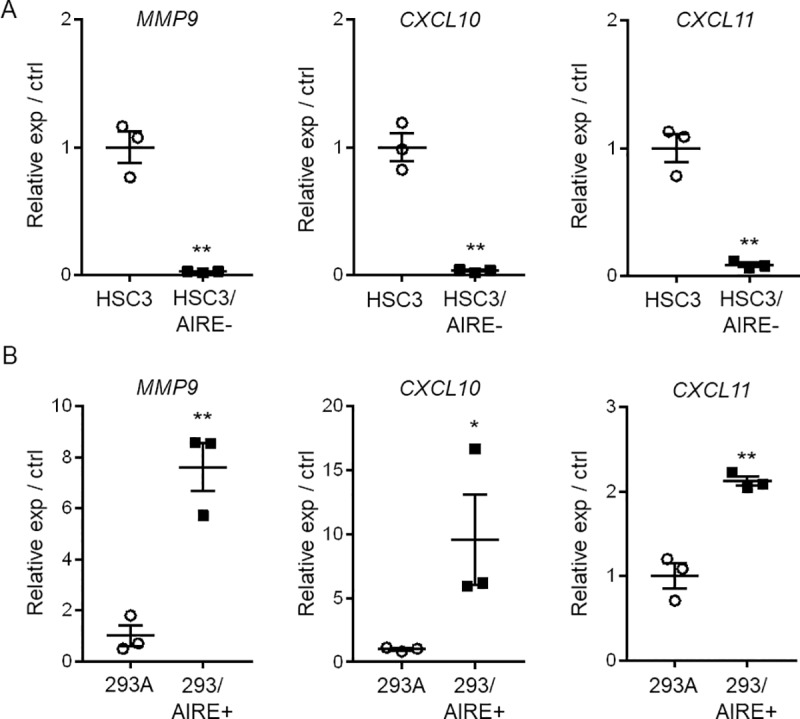
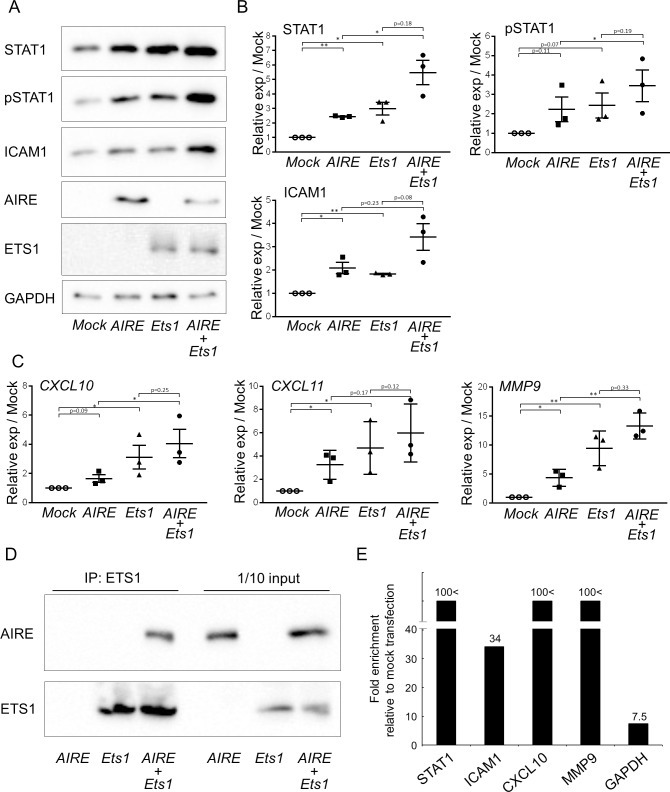
Autoimmune regulator (AIRE) is a transcriptional regulator that is primarily expressed in medullary epithelial cells, where it induces tissue-specific antigen expression. Under pathological conditions, AIRE expression is induced in epidermal cells and promotes skin tumor development. This study aimed to clarify the role of AIRE in the pathogenesis of oral squamous cell carcinoma (OSCC). AIRE expression was evaluated in six OSCC cell lines and in OSCC tissue specimens. Expression of STAT1, ICAM1, CXCL10, CXCL11, and MMP9 was elevated in 293A cells stably expressing AIRE, and conversely, was decreased in AIRE-knockout HSC3 OSCC cells when compared to the respective controls. Upregulation of STAT1, and ICAM in OSCC cells was confirmed in tissue specimens by immunohistochemistry. We provide evidence that AIRE exerts transcriptional control in cooperation with ETS1. Expression of STAT1, ICAM1, CXCL10, CXCL11, and MMP9 was increased in 293A cells upon Ets1 transfection, and coexpression of AIRE further increased the expression of these proteins. AIRE coprecipitated with ETS1 in a modified immunoprecipitation assay using formaldehyde crosslinking. Chromatin immunoprecipitation and quantitative PCR analysis revealed that promoter fragments of STAT1, ICAM1, CXCL10, and MMP9 were enriched in the AIRE precipitates. These results indicate that AIRE is induced in OSCC and supports cancer-related gene expression in cooperation with ETS1. This is a novel function of AIRE in extrathymic tissues under the pathological condition.


Conflict of interest statement

The authors have declared that no competing interests exist.

Figures

Fig 1
Fig 1. AIRE expression in esophageal tumors in mice.
A) AIRE expression in the thymic medullary epithelium. Hematoxylin and eosin staining (left panel), immunohistochemical staining using 3,3'-DAB (middle panel), and immunofluorescence double staining with KRT14 (right panel). Scale bar: 50 μm (left and middle panels), 10 μm (right panel). B) AIRE expression in neoplastic cells of the esophagus. Immunofluorescence staining (middle panel) and immunofluorescence double staining with KRT14 (right panel). PI: propidium iodide. Scale bar: 50 μm (left), 5 μm (middle and right panels). C) Expression of AIRE in neoplastic cells of the esophagus as revealed by immunohistochemical staining using DAB. Scale bar: 50 μm. A representative negative-control image using nonspecific rabbit IgG instead of anti-AIRE antibody is shown in S1 Fig.
Fig 2
Fig 2. AIRE expression in OSCC.
A) Real-time RT-PCR analysis of various cancer cell lines. NE: normal epithelium from gingiva. GAPDH was used for normalization. Data are shown on a logarithmic scale as the mean ± SEM of technical triplicates. * P < 0.05, ** P < 0.01 by Student’s t-test. B) Upper panel: Western blot analysis of cancer cell lysates using anti-AIRE antibody. GAPDH was used as a loading control. Lower panel: Densitometric quantification of the western blot data. NE: normal epithelial primary cultured cells derived from neonatal foreskin. C) Nuclear localization of AIRE in cultured cells. Upper left and right panels: Ca9-22 cells were transfected with Flag-AIRE. The cells were fixed and subjected to immunofluorescence staining. Lower left panel: Ca9-22 cells were transfected with GFP-AIRE. The cells were examined under ultraviolet light. Lower right panel: endogenous AIRE in the nucleus of an HSC3 cell as revealed by immunofluorescence staining using laser scanning microscopy. PI: propidium iodide. Scale bar: 10 μm in upper left panel, 5 μm in lower right panel, scale bars were omitted in upper right and lower left panels. D) Representative images of immunohistochemical staining of AIRE in OSCC tissue specimens. Upper left, lower left, lower right panels: chromogenic detection using DAB. A representative negative-control image using nonspecific mouse IgG instead of anti-AIRE antibody is shown in S2 Fig. Upper right panel: fluorescence detection. Scale bar: 10 μm (upper left, upper right), 500 μm (lower left), 50 μm (lower right). E) Summary of immunohistochemical evaluation of AIRE in OSCC tissue specimens. Expression was compared between normal squamous epithelium and cancer in the same specimen and was scored as +/–: no upregulation in cancer; +: upregulation in cancer; ++: strong upregulation in cancer. Mann-Whitney U test. F) Comparison of AIRE expression with clinicopathological parameters (Mann-Whitney U test). “Weak” refers to cases with the score +/–or + in E), “strong” refers to the cases with score ++ in E).
Fig 3
Fig 3. AIRE promotes the expression of ICAM1 and STAT1 in 293A cells.
A) Genes that were upregulated more than 2-fold in in 293/AIRE+ (C-3) when compared to non-transfected 293A cells in at least three spots on the cDNA microarray. B) Left panel: Western blot analysis of ICAM1 and STAT1 in 293/AIRE+ cells. Right panel: Densitometric quantification of the western blot data. ** P < 0.01, by ratio t test.
Fig 4
Fig 4. STAT1, and ICAM1 are upregulated in OSCC.
A) Left panel: Western blot analysis of ICAM1, pSTAT1, and STAT1 in HSC3/AIREclones (C1, C2, C3). GAPDH was used as a loading control. Right panel: Densitometric quantification of the western blot data. * P < 0.05; ** P < 0.01, by ratio t test. B) Cell proliferation of HSC3 and HSC3/AIREC1. Data are shown as the mean + SEM of biological triplicates. C2 and C3 also showed similar proliferation rates as HSC3. Student’s t-test. C) Transwell migration assay. Data are shown as the mean + SEM of biological triplicates. *P < 0.05, by Student’s t-test. D) Representative images of immunohistochemical staining. Scale bar: 50 μm. Representative negative-control images are shown in S2E Fig) Schematic summary of immunohistochemical expression or AIRE, ICAM1, and pSTAT1 in 51 cases of OSCC. Horizontal grids represent the cases. Filled squares denote upregulation compared to normal epithelium in the same specimen. Blank squares denote no upregulation, i.e., similar staining intensity as in normal epithelium.
Fig 5
Fig 5. Relative expression of proinflammatory genes.
Gene expression in A) HSC3/AIRE, and B) 293/AIRE+ in comparison to respective non-transformed cells as measured by real-time RT-PCR. GAPDH was used for normalization. Data are shown as the mean + SEM of technical triplicates and are representative of three independent experiments. *P < 0.05, ** P < 0.01, by Student’s t-test.
Fig 6
Fig 6. Physical and functional interaction of AIRE and ETS1.
A) Expression of STAT1, pSTAT1, and ICAM1 in 293A cells 48 h after transfection with Flag-AIRE or/and ETS1, or mock transfection. The blot shown is representative of three independent experiments. B) Densitometric analysis of data in A). Data are shown as the mean ± SEM of technical triplicates and are representative of three independent experiments. *P < 0.05, **P < 0.01, by ratio t-test. C) Relative gene expression of CXCL10, CXCL11, and MMP9 in comparison to mock transfection as revealed by real-time PCR. Data are shown as the mean ± SEM of triplicate wells and are representative of two independent experiments. * P < 0.05, ** P < 0.01, by ratio t-test. D) Immunoprecipitation and western blot analysis of ETS1 and AIRE. Formaldehyde crosslinking was performed prior to lysis. The lysates were sonicated to shear the DNA. Immunoprecipitation with the anti-ETS1 antibody was performed, and recovered protein was examined by western blot analysis. One tenth of the sample used for immunoprecipitation was loaded as a control. E) ChIP assay of 293A cells transiently transfected with Flag-AIRE. Enrichment of promoter fragments was measured by real-time PCR. Values were standardized to the input, and then to mock transfection. Relative values higher than 100 are indicated as 100< and a scale break was used in the Y-axis to allow intuitive interpretation of the relative expression. GAPDH was used as a reference. Data are representative of three independent experiments.

Similar articles

Cited by

References

    1. Torre LA, Bray F, Siegel RL, Ferlay J, Lortet-Tieulent J, Jemal A. Global cancer statistics, 2012. CA Cancer J Clin. 2015;65: 87–108. 10.3322/caac.21262 - DOI - PubMed
    1. Hanahan D, Weinberg RA. Hallmarks of cancer: the next generation. Cell. 2011;144: 646–674. 10.1016/j.cell.2011.02.013 - DOI - PubMed
    1. Chen C, Mendez E, Houck J, Fan W, Lohavanichbutr P, Doody D, et al. Gene expression profiling identifies genes predictive of oral squamous cell carcinoma. Cancer Epidemiol Biomarkers Prev. 2008;17: 2152–2162. 10.1158/1055-9965.EPI-07-2893 - DOI - PMC - PubMed
    1. Reis PP, Waldron L, Perez-Ordonez B, Pintilie M, Galloni NN, Xuan Y, et al. A gene signature in histologically normal surgical margins is predictive of oral carcinoma recurrence. BMC Cancer. 2011;11: 437-2407-11–437. - PMC - PubMed
    1. Depianto D, Kerns ML, Dlugosz AA, Coulombe PA. Keratin 17 promotes epithelial proliferation and tumor growth by polarizing the immune response in skin. Nat Genet. 2010;42: 910–914. 10.1038/ng.665 - DOI - PMC - PubMed

Publication types

Substances