. 2020 Feb 3;15(2):e0228068.
doi: 10.1371/journal.pone.0228068. eCollection 2020.

The expression patterns of immune response genes in the Peripheral Blood Mononuclear cells of pregnant women presenting with subclinical or clinical HEV infection are different and trimester-dependent: A whole transcriptome analysis

Affiliations

The expression patterns of immune response genes in the Peripheral Blood Mononuclear cells of pregnant women presenting with subclinical or clinical HEV infection are different and trimester-dependent: A whole transcriptome analysis

Ashwini Y Ramdasi et al. PLoS One. .

Abstract

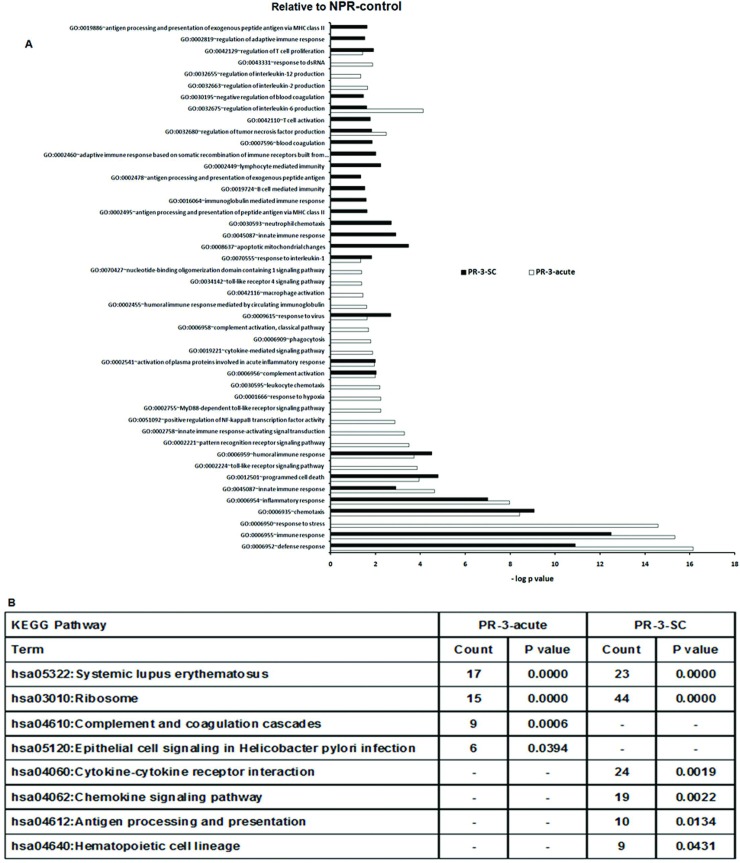
Hepatitis E is an enteric disease highly prevalent in the developing countries. The basis for high mortality among pregnant hepatitis E patients remains unclear. Importantly, a large proportion of infected pregnant women present with subclinical infection as well. In order to understand the possible mechanisms influencing clinical presentation of hepatitis E in pregnant women, we explored a system biology approach. For this, PBMCs from various categories were subjected to RNAseq analysis. These included non-pregnant (NPR, acute and convalescent phases) and pregnant (PR, 2nd and 3rd trimesters, acute phase and subclinical HEV infections) patients and corresponding healthy controls. The current study deals with immune response genes. In contrast to exclusive up-regulation of nonspecific, early immune response transcripts in the NPR patients, the PR patients exhibited broader and heightened expression of genes associated with innate as well as adaptive T and B cell responses. The study identified for the first time (1) inverse relationship of immunoglobulin (Ig) genes overexpression and (2) association of differential expression of S100 series genes with disease presentation. The data suggests possible involvement of TLR4 and NOD1 in pregnant patients and alpha defensins in all patient categories suggesting a role in protection. Induction of IFNγ gene was not detected during the acute phase irrespective of pregnancy. Association of response to vitamin D, transcripts related to NK/NKT and regulatory T cells during subclinical infection are noteworthy. The data obtained here could be correlated with several studies reported earlier in hepatitis E patients suggesting utility of PBMCs as an alternate specimen. The extensive, informative data provided here for the first time should form basis for future studies that will help in understanding pathogenesis of fulminant hepatitis E.


Conflict of interest statement

The authors have declared that no competing interests exist.

Figures

Fig 1
Fig 1
A Principal Component Analysis (PCA) to assess the variation among all samples under study. PCA was done on log10FPKM values to assess sample similarity in each group and to identify outlier samples. (Tools: Base package of R). The alphabets in the plot indicate study groups. The proportion of the variance explained by the principal components is indicated in parentheses. The study groups are: A = NPR-controls, B = PR-1-controls, C = PR-2-controls, D = PR-3-controls, E = NPR-acute, F = NPR-conv, G = PR-2-acute, H = PR-3-acute, I = PR-1-SC, J = PR-2-SC and K = PR-3-SC. All the samples within groups are intact and there are no outliers. (Data for the first trimester i.e., groups B and I is not included in the present study). Fig 1B Correlation Plot of all samples under study. Correlation analysis was performed on log10FPKM values. The plot shows the pair-wise Pearson's correlation coefficients between the expression values of the samples. Pairs of samples coming from the same group showed high correlation values (Tools: Lattice package of R). The alphabets in the plot indicate study groups. The scale bar indicates Pearson's correlation coefficients.The study groups are: The study groups are:(A):NPR-control, (B):PR-1-control, (C):PR-2-control, (D):PR-3-control, (E):NPR-acute, (F):NPR-conv, (G):PR-2-acute, (H):PR-3-acute, (I):PR-1-SC, (J):PR-2-SC and (K):PR-3-SC. All the samples within groups are intact and there are no outlier samples. (Data generated from groups B and I is not included in this study).
Fig 2
Fig 2. Changes in gene expression and biologic pathways affected following HEV infection in acute and convalescent non-pregnant patients with reference to the non-pregnant controls.
Differential expression analysis in PBMCs from NPR patients during acute (NPR-acute) and convalescent phase (NPR-conv) as compared to healthy non-pregnant controls (NPR-control). (A) Venn diagram displaying numbers of differentially expressed up-regulated genes in PBMCs from NPR-acute and NPR-conv patients as compared to healthy non-pregnant controls (NPR-Control). The green and orange circle represents DEGs in NPR-conv and NPR-acute patients and shadow of corresponding colors represent overlapping genes between the two groups. (B) DAVID was used to identify over-represented Gene Ontology (GO) terms. Significant enriched GO terms of differentially expressed up-regulated genes in NPR-acute and NPR-conv patients. The vertical axis is the GO category and the horizontal axis is–log P value <0.05. (C) The enriched KEGG pathways of differentially expressed up-regulated genes in NPR-acute and NPR-conv patients (P value <0.05). (P value is modified Fisher’s Exact test P- value or EASE score).
Fig 3
Fig 3. Changes in gene expression and biologic pathways affected following HEV infection: Comparison of acute-phase, non-pregnant and pregnant patients with reference to the non-pregnant controls.
Differential expression analysis in PBMCs from pregnant (PR-2-acute and PR-3-acute) and non-pregnant (NPR-acute) clinical patients as compared to healthy non-pregnant controls (NPR-control). (A) Venn diagram showing the number of genes uniquely expressed by NPR-acute (orange), PR-2-acute (green) and PR-3-acute (violet) patients as compared to healthy non-pregnant controls (NPR-control) and shadows of corresponding colors denote genes commonly expressed in the respective patient groups. (B) DAVID was used to identify over-represented Gene Ontology (GO) terms. Significant enriched GO terms of differentially expressed up-regulated genes in PR-2-acute, PR-3-acute and NPR-acute patients. The vertical axis is the GO category and the horizontal axis is–log P value <0.05.(C) The enriched KEGG pathways of differentially expressed up-regulated genes in PR-2-acute, PR-3-acute and NPR-acute patients (P value <0.05). (P value is modified Fisher’s Exact test P- value or EASE score).
Fig 4
Fig 4. Changes in gene expression and biologic pathways affected following HEV infection: Comparison of acute-phase, non-pregnant and pregnant patients with reference to the pregnant controls from corresponding trimesters.
Differential expression analysis in PBMCs from pregnant (PR-2-acute and PR-3-acute) acute patients as compared to respective healthy pregnant controls and non-pregnant acute patients (NPR-acute) as compared to healthy non-pregnant controls (NPR-control). (A) Venn diagram showing the number of genes uniquely expressed by NPR-acute (orange), PR-2-acute (green) and PR-3-acute (violet) patients as compared to respective healthy pregnant controls (PR-control) and shadows of corresponding colors denote genes commonly expressed in the respective patient groups. (B) DAVID was used to identify over-represented Gene Ontology (GO) terms. Significant enriched GO terms of differentially expressed up-regulated genes in PR-2-acute, PR-3-acute and NPR-acute patients. The vertical axis is the GO category and the horizontal axis is–log P value <0.05. (C) The enriched KEGG pathways of differentially expressed up-regulated genes in PR-2-acute, PR-3-acute and NPR-acute patients (P value <0.05). (P value is modified Fisher’s Exact test P- value or EASE score).
Fig 5
Fig 5. Numbers of differentially expressed genes among HEV infected pregnant women presenting with subclinical and acute infection during 2nd /3rd trimester.
Venn diagram A and B, C and D displaying numbers of differentially expressed up-regulated genes as compared to healthy non-pregnant controls (NPR-control) and respective healthy trimester 2 and 3 controls (PR-2-control and PR-3-control) respectively. The green and orange circle represents DEGs in PR-2-SC/ PR-3-SC and PR-2-acute/PR-3-acute patients and shadow of corresponding colors represent overlapping genes between the groups respectively.
Fig 6
Fig 6. Changes in gene expression and biologic pathways affected following subclinical or acute HEV infection in the pregnant women in 2nd trimester with reference to the non-pregnant controls.
Differential expression analysis in PBMCs from pregnant subclinical (PR-2-SC) and acute (PR-2-acute) patients as compared to healthy non-pregnant controls (NPR-control). (A) DAVID was used to identify over-represented Gene Ontology (GO) terms. Significant enriched GO terms of differentially expressed up-regulated genes in PR-2-SC and PR-2-acute patients. The vertical axis is the GO category and the horizontal axis is–log P value <0.05. (B) The enriched KEGG pathways of differentially expressed up-regulated genes in PR-2-SC and PR-2-acute patients (P value <0.05). (P value is modified Fisher’s Exact test P- value or EASE score).
Fig 7
Fig 7. Changes in gene expression and biologic pathways affected following subclinical or acute HEV infection in the pregnant women in 3rd trimester with reference to non-pregnant controls.
Differential expression analysis in PBMCs from pregnant subclinical (PR-3-SC) and acute (PR-3-acute) patients as compared to healthy non-pregnant controls (NPR-control). (A) DAVID was used to identify over-represented Gene Ontology (GO) terms. Significant enriched GO terms of differentially expressed up-regulated genes in PR-3-SC and PR-3-acute patients. The vertical axis is the GO category and the horizontal axis is–log P value <0.05.(B)The enriched KEGG pathways of differentially expressed up-regulated genes in PR-3-SC and PR-3-acute patients (P value <0.05).(P value is modified Fisher’s Exact test P- value or EASE score).
Fig 8
Fig 8. Changes in gene expression and biologic pathways affected following subclinical or acute HEV infection in the pregnant women in 2nd trimester with reference to pregnant controls from corresponding trimesters.
Differential expression analysis in PBMCs from pregnant subclinical (PR-2-SC) and acute (PR-2-acute) patients as compared to respective healthy pregnant controls. (A) DAVID was used to identify over-represented Gene Ontology (GO) terms. Significant enriched GO terms of differentially expressed up-regulated genes in PR-2-SC and PR-2-acute patients. The vertical axis is the GO category and the horizontal axis is–log P value <0.05. (B)The enriched KEGG pathways of differentially expressed up-regulated genes in PR-2-SC and PR-2-acute patients (P value <0.05).(P value is modified Fisher’s Exact test P- value or EASE score).
Fig 9
Fig 9. Changes in gene expression and biologic pathways affected following subclinical or acute HEV infection in the pregnant women with reference to pregnant controls from corresponding trimesters.
Differential expression analysis in PBMCs from pregnant subclinical (PR-3-SC) and acute (PR-3-acute) patients as compared to respective healthy pregnant controls. (A) DAVID was used to identify over-represented Gene Ontology (GO) terms. Significant enriched GO terms of differentially expressed up-regulated genes in PR-3-SC and PR-3-acute patients. The vertical axis is the GO category and the horizontal axis is–log P value <0.05. (B)The enriched KEGG pathways of differentially expressed up-regulated genes in PR-3-SC and PR-3-acute patients (P value <0.05).(P value is modified Fisher’s Exact test P- value or EASE score).
Fig 10
Fig 10. Changes in gene expression and biologic pathways affected following HEV infection in acute or convalescent patients with reference to non-pregnant controls.
Differential expression analysis in PBMCs from NPR patients during acute (NPR-acute) and convalescent phase (NPR-conv) as compared to healthy non-pregnant controls (NPR-control). (A) Venn diagram displaying numbers of differentially expressed down-regulated genes in PBMCs from NPR-acute and NPR-conv HEV infected patients as compared to healthy non-pregnant controls (NPR-control). The green and orange circle represents DEGs in NPR-conv and NPR-acute patients and shadow of corresponding colors represent overlapping genes between the two groups. DAVID was used to identify over-represented Gene Ontology (GO) terms. (B) Significant enriched GO terms of differentially expressed down-regulated genes in NPR-acute and NPR-conv patients. The vertical axis is the GO category and the horizontal axis is–log P value <0.05. (C) The enriched KEGG pathways of differentially expressed down-regulated genes in NPR-acute and NPR-conv patients (P value <0.05). (P value is modified Fisher’s Exact test P- value or EASE score).
Fig 11
Fig 11. Summary of transcriptome modulation by HEV and pregnancy (duration).
Abbreviations: GO, Gene Ontology terms; PRRS, pattern recognition receptors;TGF-β, transforming growth factor-beta; NOD, nucleotide-binding oligomerization domain; TLR, toll- like receptor; My-D88, myeloid differentiation primary response 88; T-regs, regulatory T-cells.
Fig 12
Fig 12
A Validation of RNA-Seq data. Correlation plot of log2 transformed values of expression of genes in RNA-Seq and RT-PCR. Spearman rank Correlation coefficient value is 0.7788, P value 2.20E-16. The plus signs in the plot indicates genes with similar expression pattern (red) and genes with different expression pattern (green) in RNA-Seq and RT-PCR. Samples from healthy pregnant all trimesters, acute and convalescent phase non-pregnant patients and acute later trimester pregnant patients were taken for validation of RNA-Seq data. Fig 12B Relative gene expression by SYBR green-based Real Time-PCR in different study groups. The XY plots represent normalized log fold expression of defensin genes (DEFA1 and DEFA4) estimated by Real-Time PCR and RNA Seq analysis when compared to healthy non-pregnant controls. Fig 12C Relative gene expression by SYBR green-based Real Time-PCR in different study groups. The XY plots represent normalized log fold expression of S100A6, S100A8, S100A9 and S100A12 genes estimated by Real-Time PCR and RNA Seq analysis, when compared to healthy non-pregnant controls in NPR-Acute, PR-2-Acute PR-3-Acute and PR-3-SC. Fig 12D Relative gene expression by SYBR green-based Real Time-PCR in different study groups. The XY plots represent normalized log fold expression of immunoglobulin IGJ gene estimated by Real-Time PCR and RNA Seq analysis. PR-2-SC, PR-3-SC, PR-2-CONTROL and PR-3-CONTROL groups were compared with healthy non-pregnant controls while PR-2-Acute, PR-3-Acute groups are compared with respective healthy trimester controls using Taqman assay.

Similar articles

Cited by

References

    1. Arankalle VA, Chobe LP, Jha J, Chadha MS, Banerjee K, et al. Aetiology of Acute Sporadic Non-A, Non-B Viral Hepatitis in India. J Med Virol 1993; 40:121–125. 10.1002/jmv.1890400208 - DOI - PubMed
    1. Arankalle VA, Chadha MS, Tsarev SA, Emerson SU, Risbud AR, et al. Seroepidemiology of water-borne hepatitis in India and evidence for a third enterically-transmitted hepatitis agent. Proc Natl Acad Sci 1994; 91: 3428–3432. 10.1073/pnas.91.8.3428 - DOI - PMC - PubMed
    1. Arankalle VA, Chadha MS, Chitambar SD, Walimbe AM, Chobe LP, et al. Changing epidemiology of hepatitis A and hepatitis E in urban and rural India (1982–98). J Viral Hepat 2001; 8: 293–303. 10.1046/j.1365-2893.2001.00279.x - DOI - PubMed
    1. Khuroo MS, Duermeyer W, Zargar SA, Ahanger MA, Shah MA. Acute sporadic non-A, non-B hepatitis in India. Am J Epidemiol 1983;118: 360–4. 10.1093/oxfordjournals.aje.a113643 - DOI - PubMed
    1. Chadha MS, Walimbe AM, Chobe LP, Arankalle VA. Comparison of Etiology of Sporadic Acute and Fulminant Viral Hepatitis in Hospitalized Patients in Pune, India During 1978–81 and 1994–1997. Indian J Gastroenterol 2003; 22:11–15. - PubMed

Publication types