. 2020 May 22;75(6):1073-1078.
doi: 10.1093/gerona/glz280.

Neuropeptide Y Enhances Progerin Clearance and Ameliorates the Senescent Phenotype of Human Hutchinson-Gilford Progeria Syndrome Cells

Affiliations

Neuropeptide Y Enhances Progerin Clearance and Ameliorates the Senescent Phenotype of Human Hutchinson-Gilford Progeria Syndrome Cells

Célia A Aveleira et al. J Gerontol A Biol Sci Med Sci. .

Abstract

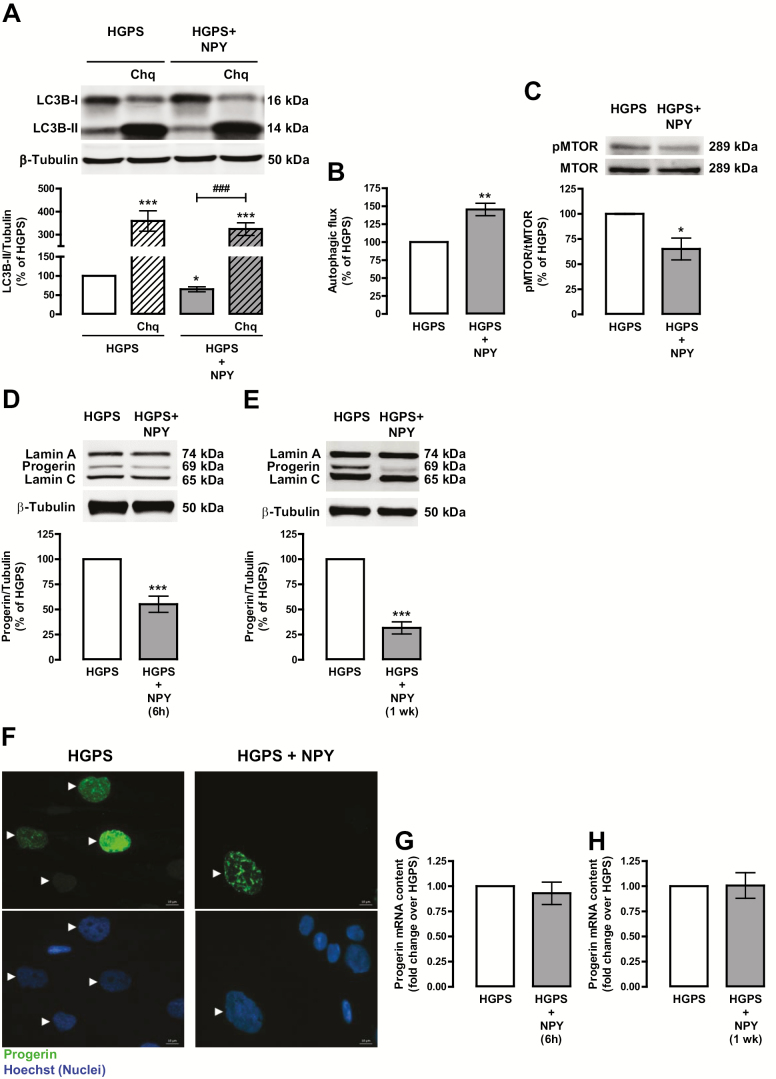
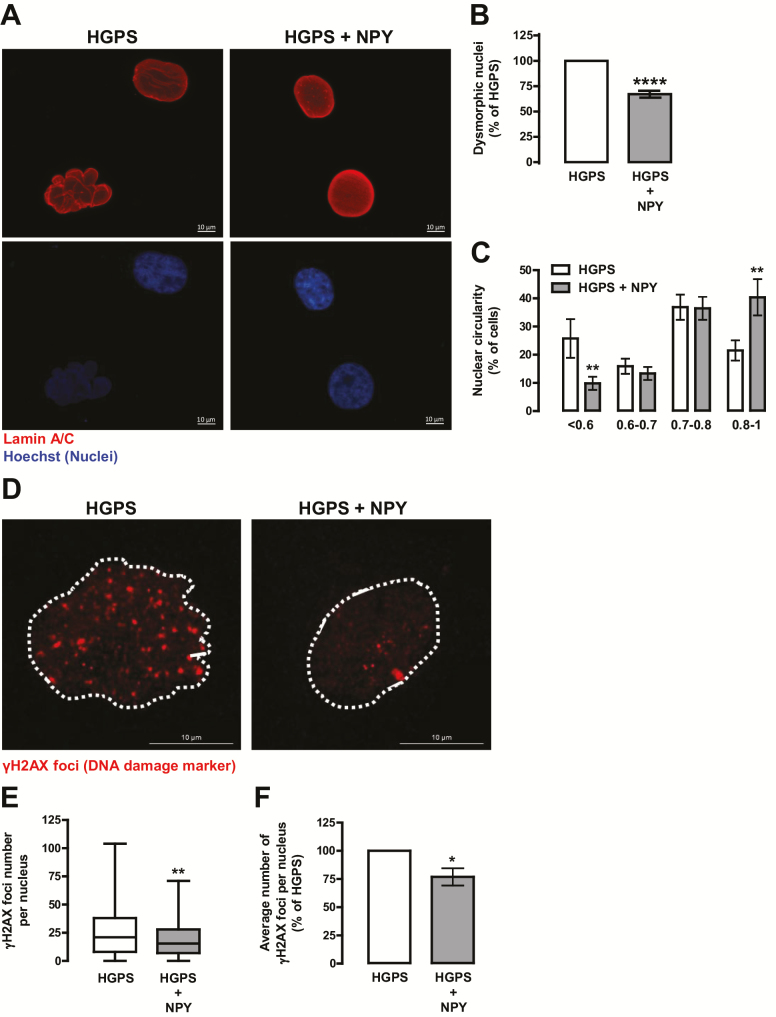
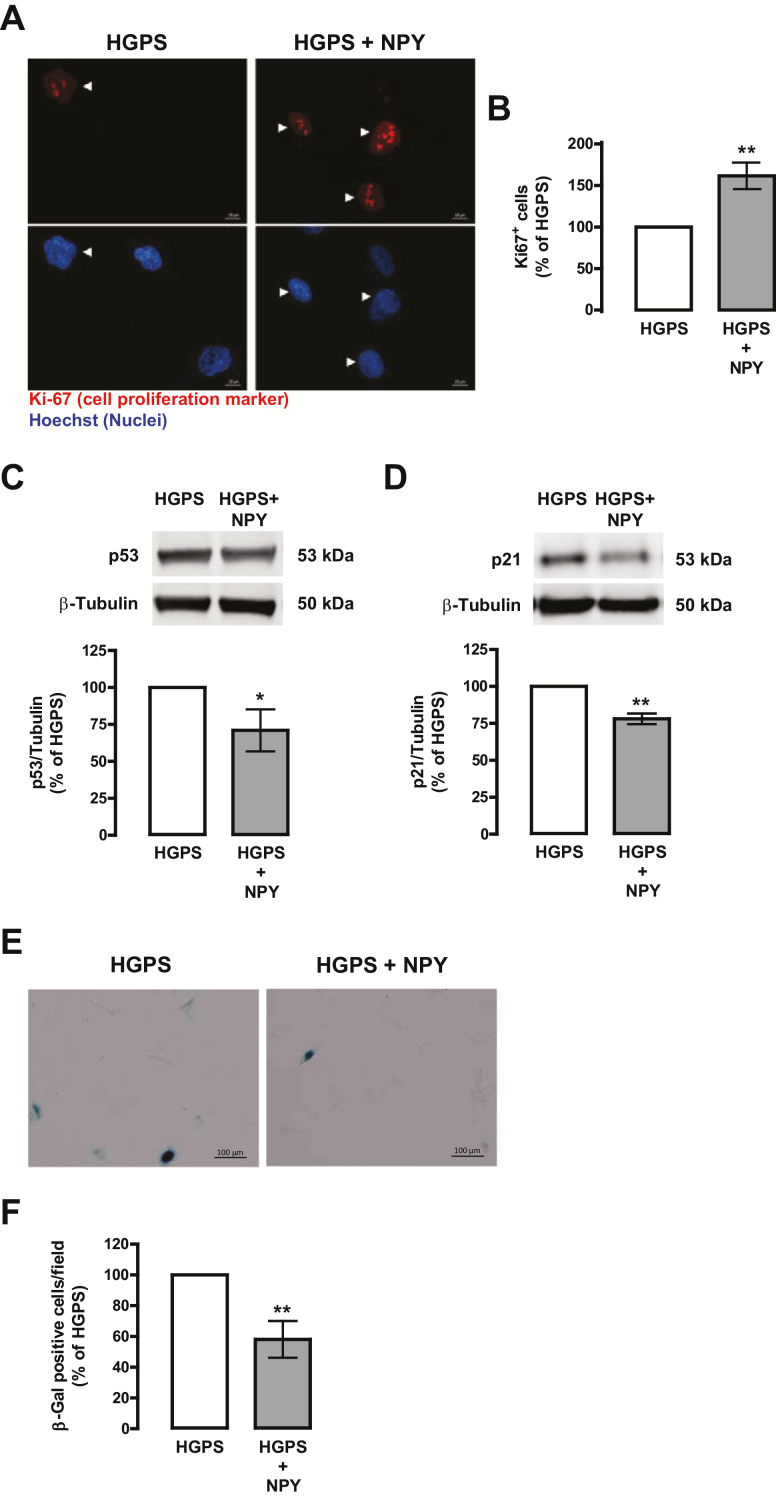
Hutchinson-Gilford progeria syndrome (HGPS, or classical progeria) is a rare genetic disorder, characterized by premature aging, and caused by a de novo point mutation (C608G) within the lamin A/C gene (LMNA), producing an abnormal lamin A protein, termed progerin. Accumulation of progerin causes nuclear abnormalities and cell cycle arrest ultimately leading to cellular senescence. Autophagy impairment is a hallmark of cellular aging, and the rescue of this proteostasis mechanism delays aging progression in HGPS cells. We have previously shown that the endogenous Neuropeptide Y (NPY) increases autophagy in hypothalamus, a brain area already identified as a central regulator of whole-body aging. We also showed that NPY mediates caloric restriction-induced autophagy. These results are in accordance with other studies suggesting that NPY may act as a caloric restriction mimetic and plays a role as a lifespan and aging regulator. The aim of the present study was, therefore, to investigate if NPY could delay HGPS premature aging phenotype. Herein, we report that NPY increases autophagic flux and progerin clearance in primary cultures of human dermal fibroblasts from HGPS patients. NPY also rescues nuclear morphology and decreases the number of dysmorphic nuclei, a hallmark of HGPS cells. In addition, NPY decreases other hallmarks of aging as DNA damage and cellular senescence. Altogether, these results show that NPY rescues several hallmarks of cellular aging in HGPS cells, suggesting that NPY can be considered a promising strategy to delay or block the premature aging of HGPS.

Keywords: Autophagy; Caloric restriction mimetic; Cellular senescence; Human aging.


Figures

Figure 1.
Figure 1.
NPY increases autophagic flux and decreases progerin levels in HGPS fibroblasts. HGPS fibroblasts were exposed to NPY (100 nM) for 6 h (HGPS + NPY) (A, B, C, D, and G) in the presence or absence of chloroquine (Chq, 100 μM), a lysosomal degradation inhibitor, or for 1 week (E, F, and H). Untreated cells were used as control (HGPS). Whole cell extracts were assayed for LC3B (A), pMTOR/tMTOR (C), Lamin A/Progerin/Lamin C (D and E) and β-tubulin (loading control) immunoreactivity through western blotting analysis. Representative western blots for each protein are presented above each respective graph. Autophagic flux analysis in HGPS cells (B) is shown. Autophagic flux was determined in the presence of the lysosomal inhibitor chloroquine, and expressed as “Autophagic flux” calculated by subtracting the densitometric value of LC3B-II – Chq from those corresponding LC3B-II + Chq values. (F) NPY decreased progerin immunoreactivity. Cells were immunolabeled for progerin (top panels, green) and nuclei were stained with Hoechst (bottom panels, blue). Representative images of three independent experiments are shown. Scale bar, 10 µm. (G and H) Quantitative polymerase chain reaction analysis of progerin mRNA levels in HGPS fibroblasts (n = 5). The results represent the mean ± SEM of, at least, four independents experiments, and are expressed as percentage of HGPS. *p < .05, **p < .01, ***p < .001, significantly different compared to HGPS; ###p < .001, significantly different compared to NPY, as determined by analysis of variance, followed Bonferroni’s post-test, or Student’s t test. HGPS = Hutchinson-Gilford progeria syndrome; NPY = Neuropeptide Y; wk = week.
Figure 2.
Figure 2.
NPY rescues nuclear morphology and decreases DNA damage in HGPS fibroblasts. HGPS fibroblasts were exposed to NPY (100 nM; HGPS + NPY) for 1 week. Untreated cells were used as control (HGPS). (A) HGPS fibroblasts were immunolabeled for Lamin A/C (top panels, red) and nuclei were stained with Hoechst (bottom panels, blue). Representative images of four independent experiments are shown. Scale bar, 10 µm. Quantification of the number of abnormal nuclei (B) and nuclear circularity (C) upon NPY treatment. For each condition, an equal number of nuclei (>400) were randomly analyzed. Circularity (defined as: 4*π*area/perimeter^2) was measured using ImageJ. A circularity value equal to 1 corresponds to perfectly circular nuclei. (D–F) NPY decreased γH2AX immunoreactivity. Cells were immunolabeled for γH2AX (red) and nuclei were stained with Hoechst (blue). Representative images of three independent experiments are shown. Scale bar, 10 µm. (E and F) Quantification of γH2AX foci number using ImageJ analysis and customized macros of three independent experiments; >200 cells analyzed) (E) Boxplot of the number of γH2AX foci per nucleus in all the cells for each experimental group. (F) Average number of γH2AX foci per nucleus. The results represent the mean ± SEM of, at least, three independents experiments, and are expressed as percentage of HGPS. *p < .05, **p < .01, ****p < .0001, significantly different from HGPS, as determined by Student’s t test. HGPS = Hutchinson-Gilford progeria syndrome; NPY = Neuropeptide Y.
Figure 3.
Figure 3.
NPY enhances cell proliferation and delays cellular senescence in HGPS fibroblasts. HGPS fibroblasts were exposed to NPY (100 nM; HGPS + NPY) for 1 week. Untreated cells were used as control (HGPS). (A) NPY increases cell proliferation, as determined by Ki-67 immunoreactivity. Cells were immunolabeled for Ki-67 (top panels, red) and nuclei were stained with Hoechst (bottom panels, blue). Representative images of five independent experiments are shown. Scale bar, 10 µm. (B) Quantification of the number of Ki-67-positive cells in HGPS and NPY-treated HGPS cells. (C and D) Whole cell extracts were assayed for p53 (C), p21 (D), and β-tubulin (loading control) immunoreactivity through western blotting analysis. Representative western blots for each protein are presented above each respective graph. (E–F) NPY decreases cellular senescence, as determined by SA-β-Gal activity. Representative images of four independent experiments are shown. Scale bar, 100 µm. (F) Quantification of SA-β-Gal-positive cells. All the results represent the mean ± SEM of, at least, four independents experiments, and are expressed as percentage of HGPS. *p < .05, **p < .01, significantly different from HGPS, as determined by Student’s t test. HGPS = Hutchinson-Gilford progeria syndrome; NPY = Neuropeptide Y.

References

    1. Gordon LB, Rothman FG, López-Otín C, Misteli T. Progeria: a paradigm for translational medicine. Cell. 2014;156:400–407. doi: 10.1016/j.cell.2013.12.028 - PMC - PubMed
    1. Ullrich NJ, Gordon LB. Hutchinson-Gilford progeria syndrome. Handb Clin Neurol. 2015;132:249–264. doi: 10.1016/B978-0-444-62702-5.00018-4 - PubMed
    1. De Sandre-Giovannoli A, Bernard R, Cau P, et al. . Lamin a truncation in Hutchinson-Gilford progeria. Science. 2003;300:2055. doi: 10.1126/science.1084125 - PubMed
    1. Eriksson M, Brown WT, Gordon LB, et al. . Recurrent de novo point mutations in lamin A cause Hutchinson-Gilford progeria syndrome. Nature. 2003;423:293–298. doi: 10.1038/nature01629 - PMC - PubMed
    1. Cao K, Capell BC, Erdos MR, Djabali K, Collins FS. A lamin A protein isoform overexpressed in Hutchinson-Gilford progeria syndrome interferes with mitosis in progeria and normal cells. Proc Natl Acad Sci USA 2007;104:4949–4954. doi: 10.1073/pnas.0611640104 - PMC - PubMed

Publication types