Observational Study
. 2020 Nov;72(5):1541-1555.
doi: 10.1002/hep.31160.

Characterizing Hepatitis C Virus-Specific CD4+ T Cells Following Viral-Vectored Vaccination, Directly Acting Antivirals, and Spontaneous Viral Cure

Affiliations
Observational Study

Characterizing Hepatitis C Virus-Specific CD4+ T Cells Following Viral-Vectored Vaccination, Directly Acting Antivirals, and Spontaneous Viral Cure

Felicity Hartnell et al. Hepatology. 2020 Nov.

Abstract

Background and aims: Induction of functional helper CD4+ T cells is the hallmark of a protective immune response against hepatitis C virus (HCV), associated with spontaneous viral clearance. Heterologous prime/boost viral vectored vaccination has demonstrated induction of broad and polyfunctional HCV-specific CD8+ T cells in healthy volunteers; however, much less is known about CD4+ T-cell subsets following vaccination.

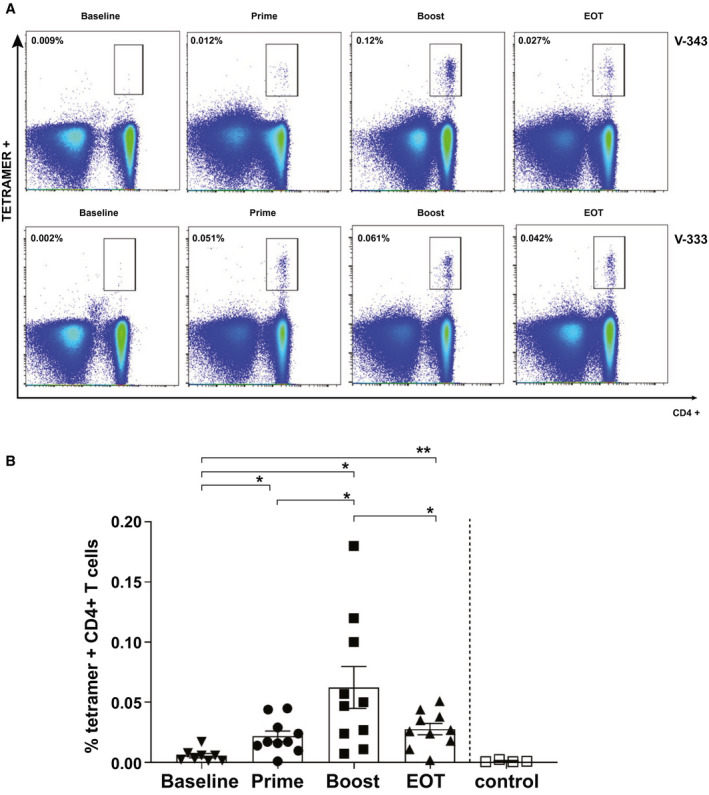
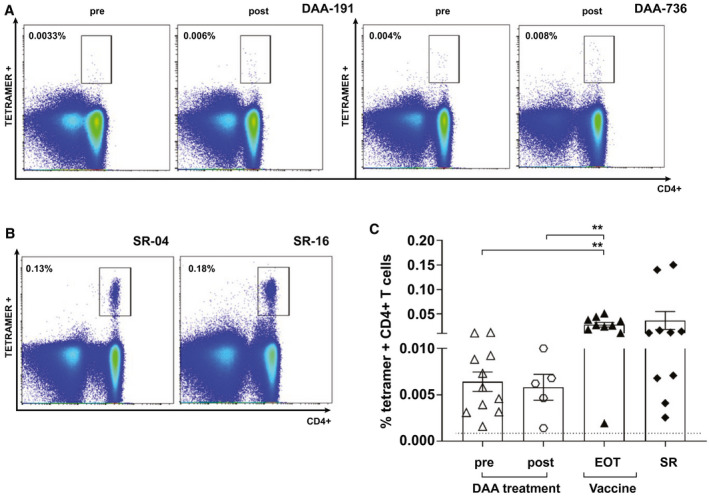
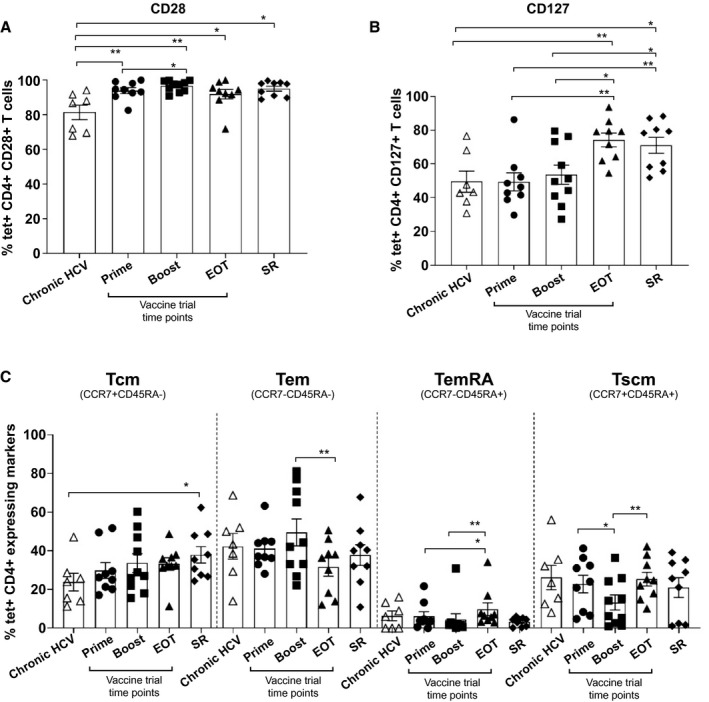
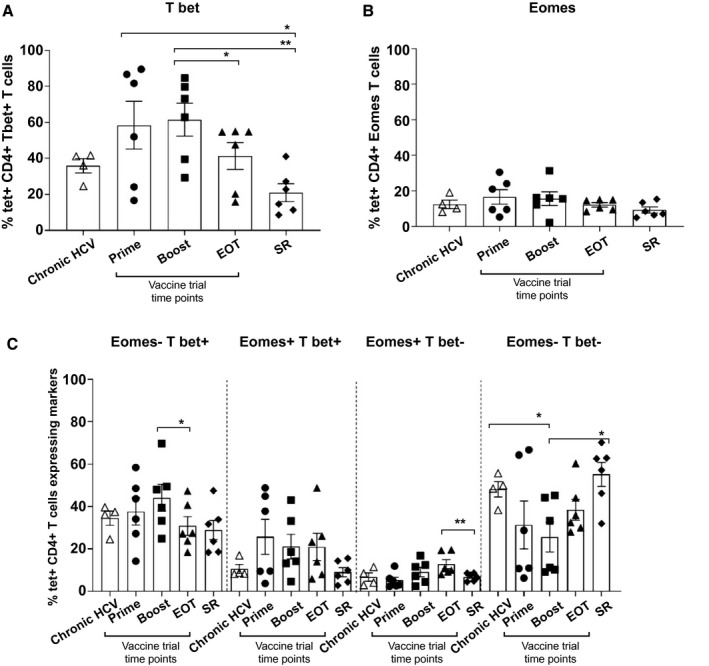
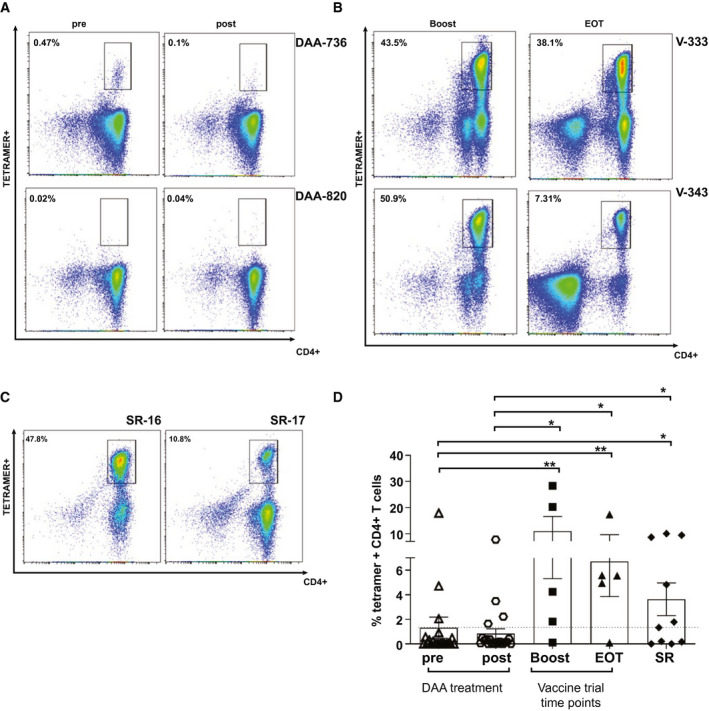
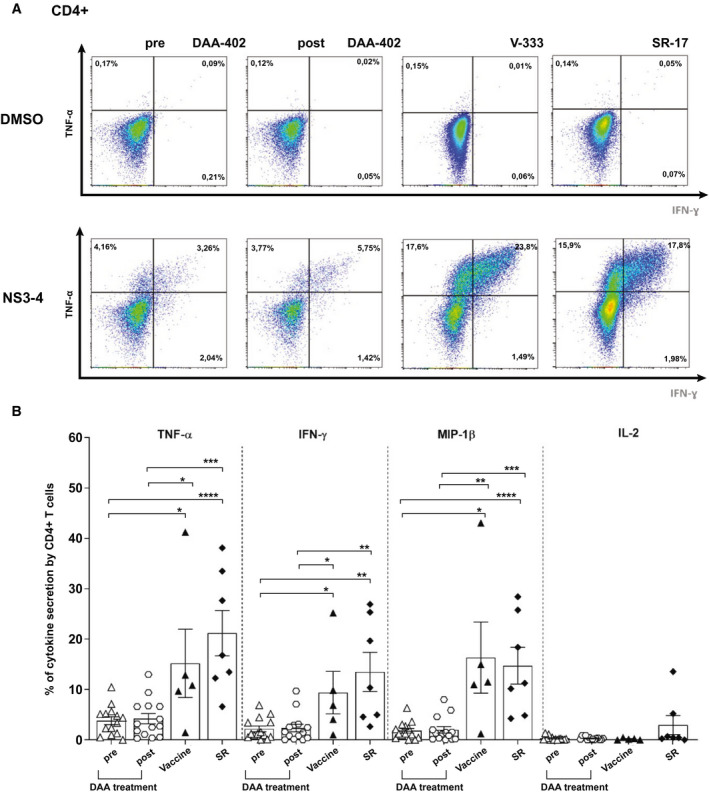
Approach and results: We analyzed HCV-specific CD4+ T-cell populations using major histocompatibility complex class II tetramers in volunteers undergoing HCV vaccination with recombinant HCV adenoviral/modified vaccinia Ankara viral vectors. Peptide-specific T-cell responses were tracked over time, and functional (proliferation and cytokine secretion) and phenotypic (cell surface and intranuclear) markers were assessed using flow cytometry. These were compared to CD4+ responses in 10 human leukocyte antigen-matched persons with HCV spontaneous resolution and 21 chronically infected patients treated with directly acting antiviral (DAA) therapy. Vaccination induced tetramer-positive CD4+ T cells that were highest 1-4 weeks after boosting (mean, 0.06%). Similar frequencies were obtained for those tracked following spontaneous resolution of disease (mean, 0.04%). In addition, the cell-surface phenotype (CD28, CD127) memory subset markers and intranuclear transcription factors, as well as functional capacity of peptide-specific CD4+ T-cell responses characterized after vaccination, are comparable to those following spontaneous viral resolution. In contrast, helper responses in chronic infection were infrequently detected and poorly functional and did not consistently recover following HCV cure.

Conclusions: Helper CD4+ T-cell phenotype and function following HCV viral vectored vaccination resembles "protective memory" that is observed following spontaneous clearance of HCV. DAA cure does not promote resurrection of exhausted CD4+ T-cell memory in chronic infection.


Figures

Fig. 1
Fig. 1
HCV‐specific MHC class II tetramer+ CD4+ T cells following viral vectored vaccination. (A) Example FACS plot of staining with tetramers 14 HCV‐NS4B1806‐1818 in 2 vaccinated healthy volunteers over the study course. Gating is on live CD3+ cells. Values indicate the percentage of CD4+ T cells binding the tetramer. (B) Percentage of tetramer+ CD4+ cells after ex vivo staining in vaccinated healthy volunteers at different time points of the vaccination regimen. Controls are represented by healthy volunteers stained with mismatched MHC class II tetramer. Error bars represent the SEM.
Fig. 2
Fig. 2
Assessment of ex vivo tetramer+ CD4+ T cells pre‐DAA and post‐DAA treatment, following vaccination and in SR volunteers. (A,B) FACS example plot of staining with tetramers 14 HCV‐NS4B1806‐1818, 24 HCV‐NS31535‐1551 or pool of tetramers 17 HCV‐NS31582‐1597, tetramer 18 HCV‐NS31411‐1425, and tetramer 19 HCV‐NS31535‐1551 in 2 DAA patients pretherapy and posttherapy and in 2 SRs. Gating is on live CD3+ cells. Values indicate the percentage of CD4+ T cells binding the tetramer. (C) Percentage of tetramer+ CD4+ cells after ex vivo staining at the end of study of vaccinated healthy volunteers, DAA pretherapy and posttherapy, and in SR persons. Error bars represent the SEM. Only statistical differences are shown.
Fig. 3
Fig. 3
Analysis of costimulatory and memory cell‐surface markers in chronic HCV, vaccinated, and SR volunteers. (A,B) Thawed PBMCs were costained with MHC class II tetramers and anti‐CD127 and ‐CD28 antibodies in chronic HCV patients, vaccinated volunteers at different trial time points, and in SR persons. (C) Proportion of tetramer+ cells expressing Tcm, Tem, Temra, and Tscm phenotype in the same cohorts. All tetramer staining and phenotyping were performed ex vivo. Error bars represent the SEM. Only statistical differences are shown.
Fig. 4
Fig. 4
TF analysis in chronic HCV, vaccinated, and SR volunteers. (A,B) Percentage of tetramer+ CD4+ T cells expressing T‐bet and Eomes in chronic HCV patients, vaccinated volunteers, and SR persons. (C) Costaining with class II tetramers and anti‐human T‐bet and Eomes antibodies in the same cohorts. Error bars represent the SEM. Only statistical differences are shown.
Fig. 5
Fig. 5
Proliferative capacity of CD4+ T cells in pre‐DAA– and post‐DAA–treated patients, vaccinated, and SR volunteers. (A‐C) Example FACS plots of tetramer+ CD4+ T cells after 14 days of culture with peptide matching tetramer sequence in 2 DAA patients pretreatment and posttreatment (A), 2 vaccinated volunteers at boost and EOT (B), and 2 SR persons (C). Values indicate the percentage of CD4+ T cells binding tetramer. (D) Scatter plot with bar showing the percentage of tetramer+ CD4+ T cells after culture in pre‐DAA and post‐DAA, vaccination, and SR. Error bars represent the SEM. Only statistical differences are shown.
Fig. 6
Fig. 6
Functional capacity of CD4+ T cells in pre‐DAA– and post‐DAA–treated patients, vaccinated, and SR volunteers. (A) Example FACS plots showing TNFα/IFN‐γ after intracellular cytokine staining are shown for CD4+ T cells stimulated with NS3‐4 or DMSO control in DAA patients pretreatment and posttreatment, vaccine volunteers (after boost vaccination), and SR. (B) Comparison of cytokine production by CD4+ T cells pre‐DAA (n = 14) and post‐DAA treatment (n = 14), after ChAd3/MVA vaccination (n = 5), and in SR (n = 7). PBMCs were cultured for 14 days with peptide matching NS3‐4 (pools F+G+H), rested, and restimulated with the same peptides overnight. Staining in DMSO wells was subtracted. Error bars represent the SEM. Only statistical differences are shown.

References

    1. WHO . Global Hepatitis Report, 2017. Geneva, Switzerland: WHO; 2017:1‐83.
    1. Lauer GM, Walker BD. Hepatitis C virus infection. N Engl J Med 2001;345:41‐52. - PubMed
    1. Grakoui A, Shoukry NH, Woollard DJ, Han JH, Hanson HL, Ghrayeb J, et al. HCV persistence and immune evasion in the absence of memory T cell help. Science 2003;302:659‐662. - PubMed
    1. Diepolder HM, Zachoval R, Hoffmann RM, Jung MC, Pape GR, Wierenga EA, et al. Possible mechanism involving T‐lymphocyte response to non‐structural protein 3 in viral clearance in acute hepatitis C virus infection. Lancet 1995;346:1006‐1007. - PubMed
    1. Missale G, Bertoni R, Lamonaca V, Valli A, Massari M, Mori C, et al. Different clinical behaviors of acute hepatitis C virus infection are associated with different vigor of the anti‐viral cell‐mediated immune response. J Clin Invest 1996;98:706‐714. - PMC - PubMed

Publication types

MeSH terms