. 2020 Jan 28;10(2):49.
doi: 10.3390/metabo10020049.

A Data Mining Metabolomics Exploration of Glaucoma

Affiliations

A Data Mining Metabolomics Exploration of Glaucoma

Judith Kouassi Nzoughet et al. Metabolites. .

Abstract

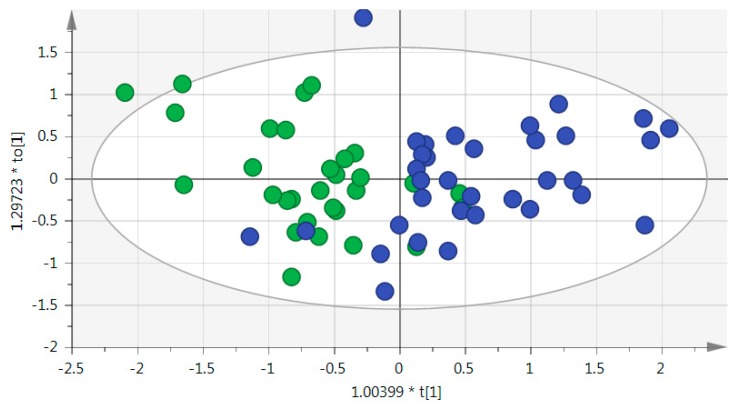
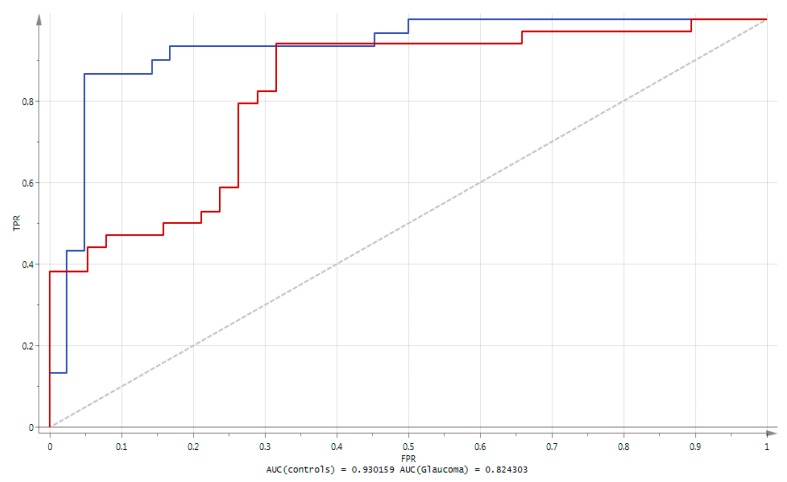
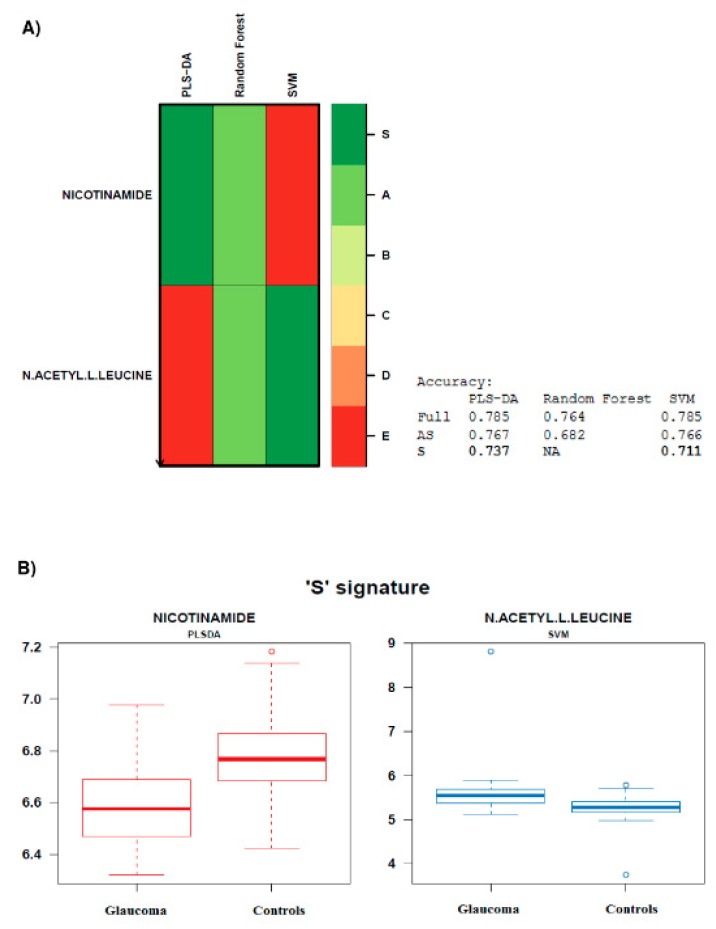
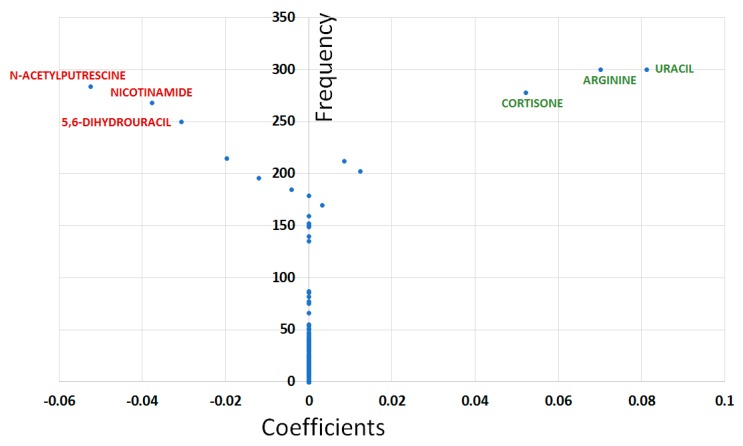
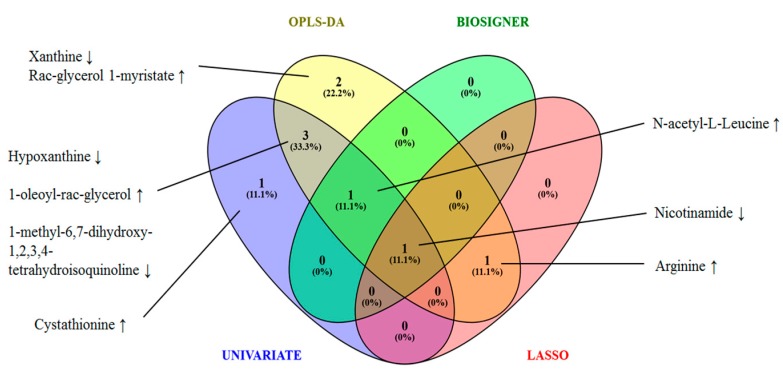
Glaucoma is an age related disease characterized by the progressive loss of retinal ganglion cells, which are the neurons that transduce the visual information from the retina to the brain. It is the leading cause of irreversible blindness worldwide. To gain further insights into primary open-angle glaucoma (POAG) pathophysiology, we performed a non-targeted metabolomics analysis on the plasma from POAG patients (n = 34) and age- and sex-matched controls (n = 30). We investigated the differential signature of POAG plasma compared to controls, using liquid chromatography coupled to high resolution mass spectrometry (LC-HRMS). A data mining strategy, combining a filtering method with threshold criterion, a wrapper method with iterative selection, and an embedded method with penalization constraint, was used. These strategies are most often used separately in metabolomics studies, with each of them having their own limitations. We opted for a synergistic approach as a mean to unravel the most relevant metabolomics signature. We identified a set of nine metabolites, namely: nicotinamide, hypoxanthine, xanthine, and 1-methyl-6,7-dihydroxy-1,2,3,4-tetrahydroisoquinoline with decreased concentrations and N-acetyl-L-Leucine, arginine, RAC-glycerol 1-myristate, 1-oleoyl-RAC-glycerol, cystathionine with increased concentrations in POAG; the modification of nicotinamide, N-acetyl-L-Leucine, and arginine concentrations being the most discriminant. Our findings open up therapeutic perspectives for the diagnosis and treatment of POAG.

Keywords: data mining; metabolomics; mitochondrial dysfunction; optic neuropathy; primary open-angle glaucoma.


Conflict of interest statement

The authors declare no conflict of interest.

Figures

Figure 1
Figure 1
Score plot for the orthogonal partial least squares-discriminant analysis (OPLS-DA) model based on the 8 most significant metabolites from the S-plot. Control samples are represented by green circles; POAG (primary open-angle glaucoma) plasma is represented by blue circles. Goodness of fit (R2) Y (cum) = 0.5, goodness of prediction (Q2) (cum) = 0.4; coefficient of variation (CV) Anova p-value = 1.8042 × 10⁻⁵; Intercepts from the permutation test permR2 = 0.0355, permQ2 = −0.101.
Figure 2
Figure 2
Results of the Receiver Operating Characteristic (ROC) curve analysis using the 8 metabolites derived from the multivariate OPLS-DA model. The blue line represents the Area Under the ROC Curve (AUC) obtained for controls, whilst the red line represents the AUC obtained for glaucoma patients. The ROC plots represent the sensitivity (i.e., True Positive Rate TPR) versus 1—the specificity (i.e., False Positive Rate FPR).
Figure 3
Figure 3
Biosigner signature. (A) The algorithm assessed the relevance of the 160 metabolites identified for the prediction performances of Partial Least Squares-Discriminant Analysis (PLS-DA), Random Forest (RF), and Support Vector Machines (SVM) classifier models and subsequently identified 2 robust ‘S tier’ features, i.e., nicotinamide and N-acetyl L-leucine. The accuracies of the PLS-DA and SVM models on the final S signature were respectively 73.7% and 71.1% for nicotinamide and N-acetyl L-leucine. (B) The boxplots depict the metabolite levels in glaucoma and control groups. Error bars represent ± s.e.m and the solid bars within the boxplots represent the median level of metabolite (log transformed peak area) for each group.
Figure 4
Figure 4
Least Absolute Shrinkage and Selection Operator (LASSO) Y‒plot displaying coefficients (x‒axis) and the number of models in which each variable appears (frequency, y‒axis) in the 303 models with highest predictive capabilities in the test set. Features from the first group show the highest absolute coefficient values. Positive and negative coefficients indicate relative higher and lower values for the corresponding feature in the glaucoma plasma compared to controls, and have been highlighted using green and red scriptures, respectively.
Figure 5
Figure 5
Venn diagram illustrating the global POAG signature.

References

    1. Kingman S. Glaucoma is second leading cause of blindness globally. Bull. World Health Organ. 2004;82:887–888. - PMC - PubMed
    1. Quigley H.A., Broman A.T. The number of people with glaucoma worldwide in 2010 and 2020. Br. J. Ophthalmol. 2006;90:262–267. doi: 10.1136/bjo.2005.081224. - DOI - PMC - PubMed
    1. Güngör K., Hotez P.J., Özdemir V., Aynacıoğlu Ş. Glaucomics: A Call for Systems Diagnostics for 21st Century Ophthalmology and Personalized Visual Health. OMICS J. Integr Biol. 2014;18:275–279. doi: 10.1089/omi.2014.0040. - DOI - PubMed
    1. Barbosa-Breda J., Himmelreich U., Ghesquière B., Rocha-Sousa A., Stalmans I. Clinical Metabolomics and Glaucoma. Ophthalmic Res. 2018;59:1–6. doi: 10.1159/000479158. - DOI - PubMed
    1. Kell D.B., Brown M., Davey H.M., Dunn W.B., Spasic I., Oliver S.G. Metabolic footprinting and systems biology: The medium is the message. Nat. Rev. Microbiol. 2005;3:557–565. doi: 10.1038/nrmicro1177. - DOI - PubMed

LinkOut - more resources