. 2020 Jan 28;12(2):306.
doi: 10.3390/cancers12020306.

Synthetic Lethal Targeting of Mitotic Checkpoints in HPV-Negative Head and Neck Cancer

Affiliations

Synthetic Lethal Targeting of Mitotic Checkpoints in HPV-Negative Head and Neck Cancer

Alexander Y Deneka et al. Cancers (Basel). .

Abstract

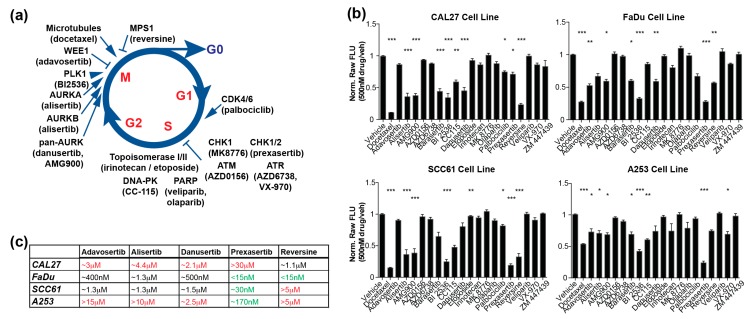
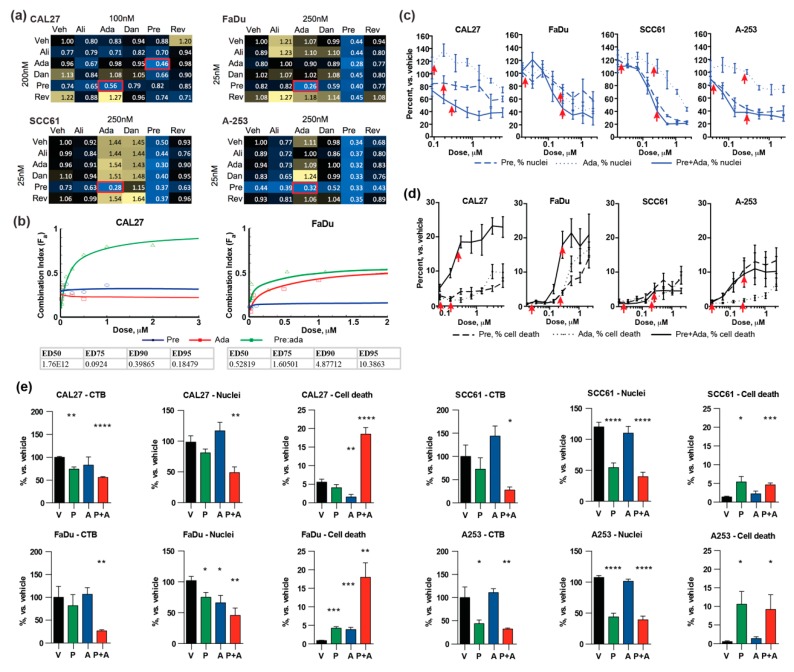
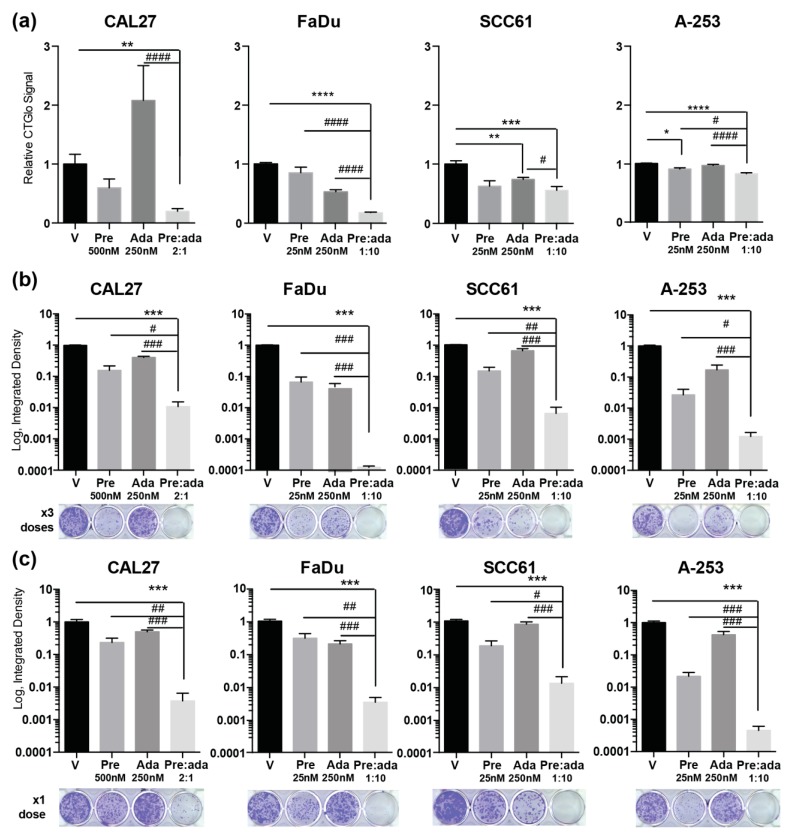
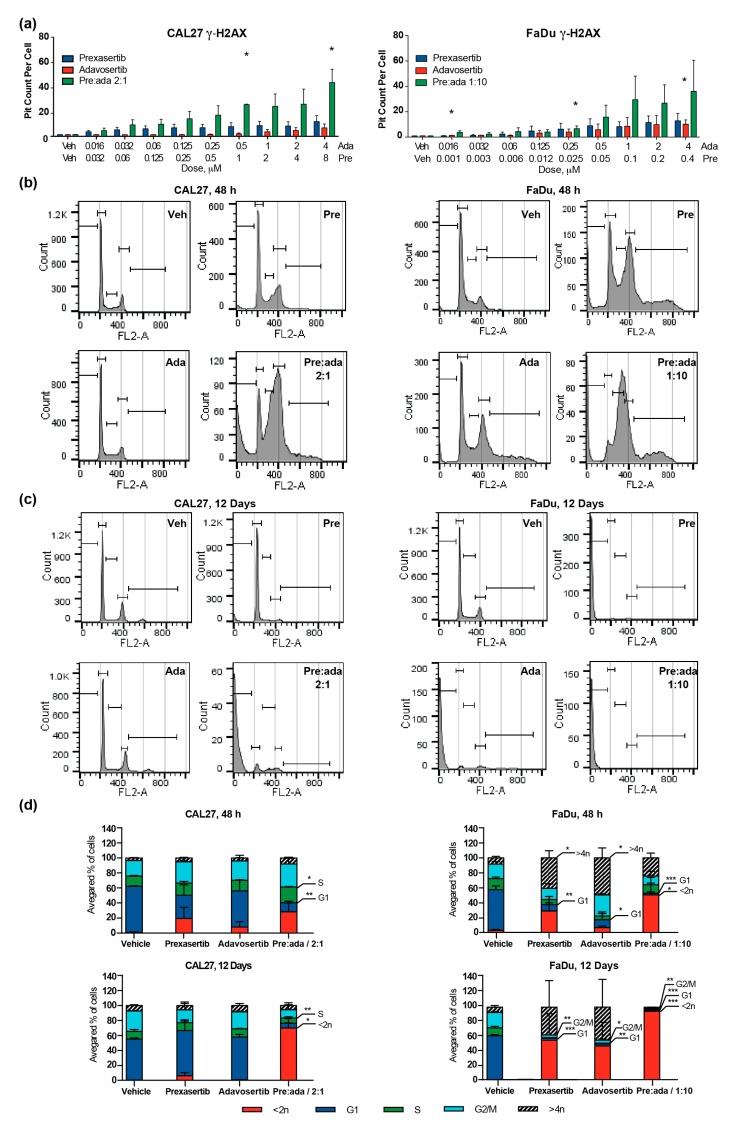
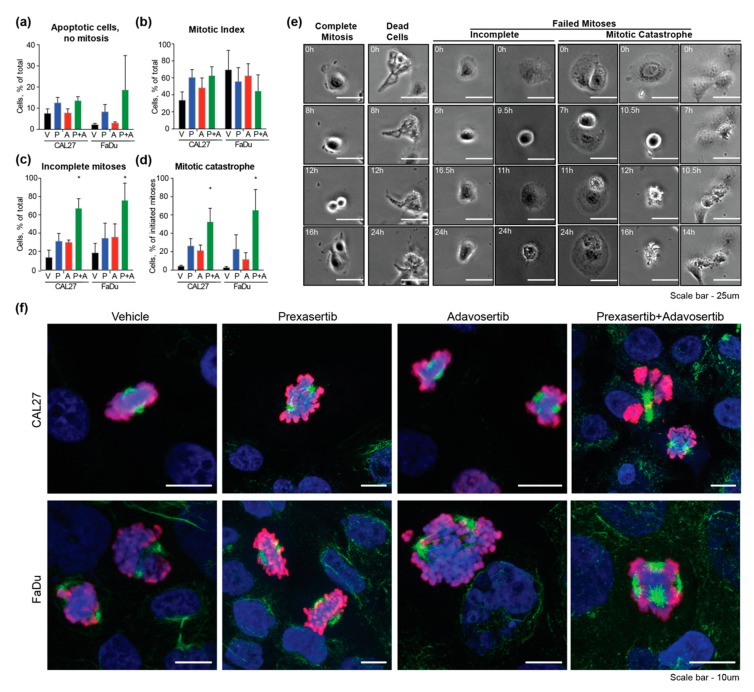
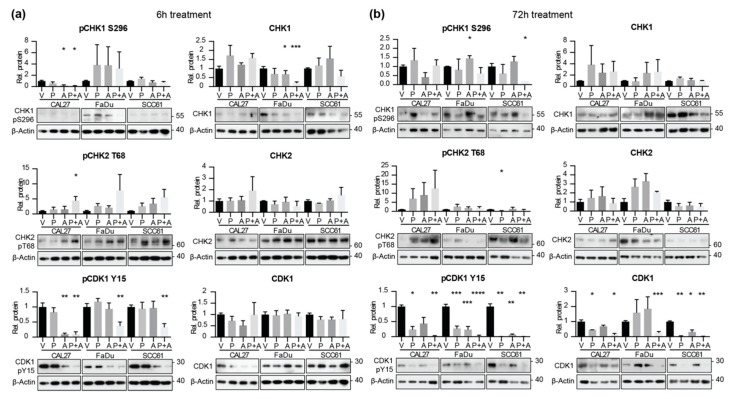
Head and neck squamous cell carcinomas (HNSCC) affect more than 800,000 people annually worldwide, causing over 15,000 deaths in the US. Among HNSCC cancers, human papillomavirus (HPV)-negative HNSCC has the worst outcome, motivating efforts to improve therapy for this disease. The most common mutational events in HPV-negative HNSCC are inactivation of the tumor suppressors TP53 (>85%) and CDKN2A (>57%), which significantly impairs G1/S checkpoints, causing reliance on other cell cycle checkpoints to repair ongoing replication damage. We evaluated a panel of cell cycle-targeting clinical agents in a group of HNSCC cell lines to identify a subset of drugs with single-agent activity in reducing cell viability. Subsequent analyses demonstrated potent combination activity between the CHK1/2 inhibitor LY2606268 (prexasertib), which eliminates a G2 checkpoint, and the WEE1 inhibitor AZD1775 (adavosertib), which promotes M-phase entry, in induction of DNA damage, mitotic catastrophe, and apoptosis, and reduction of anchorage independent growth and clonogenic capacity. These phenotypes were accompanied by more significantly reduced activation of CHK1 and its paralog CHK2, and enhanced CDK1 activation, eliminating breaks on the mitotic entry of cells with DNA damage. These data suggest the potential value of dual inhibition of CHK1 and WEE1 in tumors with compromised G1/S checkpoints.

Keywords: adavosertib; head and neck cancer; mitotic catastrophe; prexasertib.


Conflict of interest statement

Barbara Burtness reports consulting fees from Astra-Zeneca. The funders had no role in the design of the study; in the collection, analyses, or interpretation of data; in the writing of the manuscript, or in the decision to publish the results.

Figures

Figure 1
Figure 1
Initial high throughput screening results in multiple HNSCC cell lines using 24 compounds. (a) Schematic representation of drugs targeting proteins active in cell cycle regulation; (b) Cell viability determination by CellTiterBlue assay for 4 cell lines treated with drugs indicated at 500 nM concentration; (с) Summary of IC50 values for selected compounds for four cell lines. Greater resistance, red font; more sensitive, green font. See also Figure S1. All graphs: *, p ≤ 0.05; **, p ≤ 0.01; ***, p ≤ 0.001 relative to vehicle control.
Figure 2
Figure 2
Evaluation of combination effect of selected cell cycle inhibitors. (a) Heatmaps representing values from CellTiterBlue (CTB) assays for combinations of the indicated targeted drugs, at the concentrations indicated. Values indicate reduction in cell metabolic activity normalized to vehicle control; blue, positive combination activity; yellow, antagonistic combination activity; red boxes, optimal combination; (b) combination index (CI) calculation results for the CAL27 and FaDu cell lines to assess synergistic effects of pre:ada drug combination; (c,d) dose response curves indicating viable cells (based on nuclear count) (c) and inviable cells (based on failure to exclude propidium iodide) (d). Arrows indicate concentrations comparable to those shown in CTB assays in (a); (e) Comparison of results from assays in (a–d) at drug concentrations used in (a). All graphs: *, p ≤ 0.05; **, p ≤ 0.01; ***, p ≤ 0.001; ****, p ≤ 0.0001 relative to vehicle controls.
Figure 3
Figure 3
Combination of adavosertib and prexasertib in assays for anchorage-independent growth and clonogenic survival. (a) Metabolic activity measured by CellTiterGlo in cells grown in anchorage-independent conditions for 72 h of treatment with vehicle or indicated drugs; (b,c) quantification and representative images for clonogenic growth after 12 days of treatment with drugs indicated, either followed by replenishment of drugs at 3-day intervals (b), or with cells receiving only a single initial dose (c). All graphs: * or #, p ≤ 0.05; ** or ##, p ≤ 0.01; *** or ###, p ≤ 0.001, **** or ####, p ≤ 0.0001 relative to indicated comparator. We note that NHTBE cells must be grown under specialized conditions, at an air-medium interface, and hence cannot be used for a clonogenic assay; further, because they are highly migratory, IMR90 cells do not form colonies; see Figure S2 for further analysis.
Figure 4
Figure 4
Combination of prexasertib and adavosertib enhances DNA breaks and aneuploidy. (a) γ-H2AX-positive foci in CAL27 and FaDu cell lines, 72 h after treatment with vehicle or drugs at concentrations indicated; (b,c) representative histograms from single runs of FACS analysis of CAL27 and FaDu cells from short term (48 h) (b) and long term (12 days) (с) treatment with vehicle, or drugs indicated; (d) quantification of cell cycle compartmentalization changes, averaged from three repetitions of experiments shown in (b), (c). All graphs: *, p ≤ 0.05; **, p ≤ 0.01; ***, p ≤ 0.001 relative to vehicle controls.
Figure 5
Figure 5
Combination of prexasertib and adavosertib causes mitotic catastrophe. (a–d) Quantification of percent of CAL27 and FaDu cells (a) undergoing apoptosis without prior mitosis; (b) entering into mitosis; (c) unable to successfully complete mitosis; (d) undergoing apoptosis after initially entering mitosis over 24 h of live cell imaging following addition of indicated drugs; and (e) representative images of CAL27 cells related to (a–d). Scale bar, 30 um; (f) confocal images of cells, stained with DAPI to visualize nuclei (blue), and antibody to acetylated α-tubulin to visualize mitotic spindle (green), or to phospho-histone H3 to visualize DNA breaks (red), 24 h after treatment with indicated drugs. Scale bar, 10 um. All graphs: *, p ≤ 0.05; relative to vehicle controls.
Figure 6
Figure 6
Combined application of prexasertib and adavosertib enhances CDK1 activation. (a,b) Quantification (top) and representative western blot images (bottom) for indicated phospho- and total proteins in HNSCC cell lines, after 6 (a) or 72 h (b) of treatment with indicated drugs. All graphs: *, p ≤ 0.05; **, p ≤ 0.01; ***, p ≤ 0.001, ****, p ≤ 0.0001 relative to vehicle controls.

References

    1. Siegel R.L., Miller K.D., Jemal A. Cancer statistics, 2019. CA Cancer J. Clin. 2019;69:7–34. doi: 10.3322/caac.21551. - DOI - PubMed
    1. Burtness B., Harrington K.J., Greil R., Soulieres D., Tahara M., de Castro G., Jr., Psyrri A., Baste N., Neupane P., Bratland A., et al. Pembrolizumab alone or with chemotherapy versus cetuximab with chemotherapy for recurrent or metastatic squamous cell carcinoma of the head and neck (KEYNOTE-048): A randomised, open-label, phase 3 study. Lancet. 2019;394:1915–1928. doi: 10.1016/S0140-6736(19)32591-7. - DOI - PubMed
    1. Comprehensive genomic characterization of head and neck squamous cell carcinomas. Nature. 2015;517:576–582. doi: 10.1038/nature14129. - DOI - PMC - PubMed
    1. Cramer J.D., Burtness B., Le Q.T., Ferris R.L. The changing therapeutic landscape of head and neck cancer. Nat. Rev. Clin. Oncol. 2019 doi: 10.1038/s41571-019-0227-z. - DOI - PubMed
    1. Zeman M.K., Cimprich K.A. Causes and consequences of replication stress. Nat. Cell Biol. 2014;16:2–9. doi: 10.1038/ncb2897. - DOI - PMC - PubMed