. 2020 Jan 28;20(3):723.
doi: 10.3390/s20030723.

Deep Learning with Dynamically Weighted Loss Function for Sensor-Based Prognostics and Health Management

Affiliations

Deep Learning with Dynamically Weighted Loss Function for Sensor-Based Prognostics and Health Management

Divish Rengasamy et al. Sensors (Basel). .

Abstract

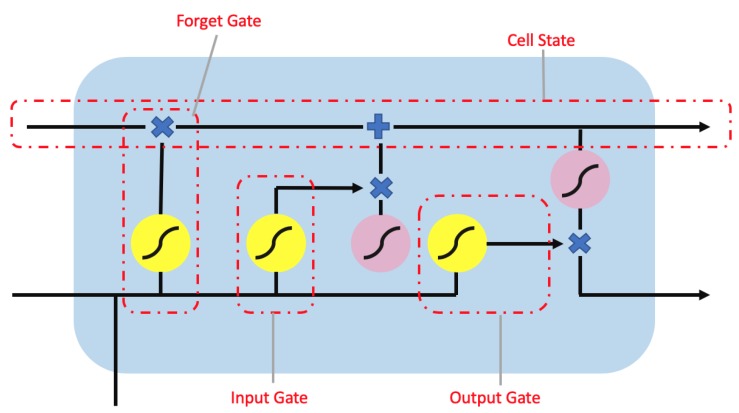
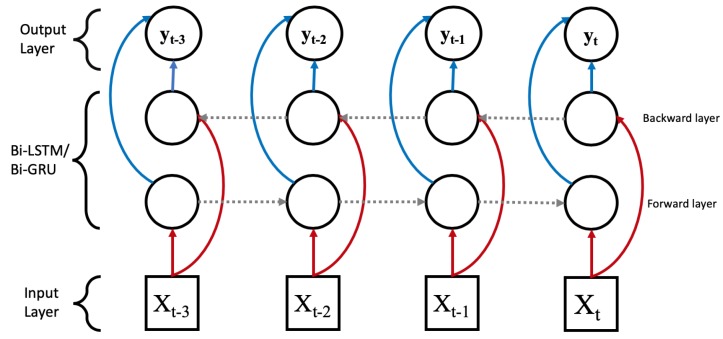
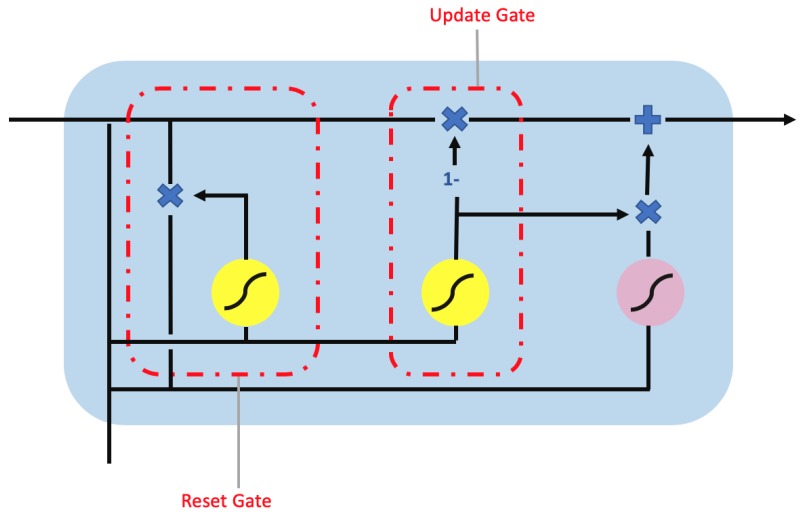
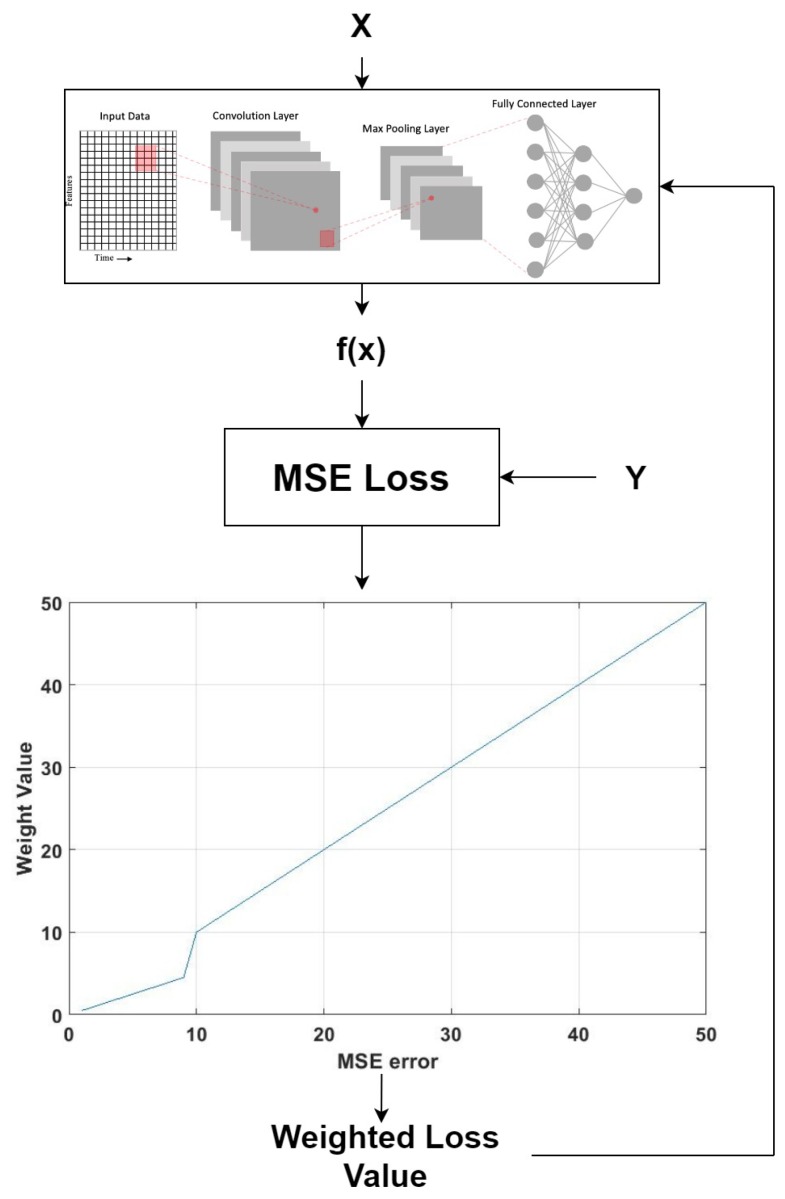
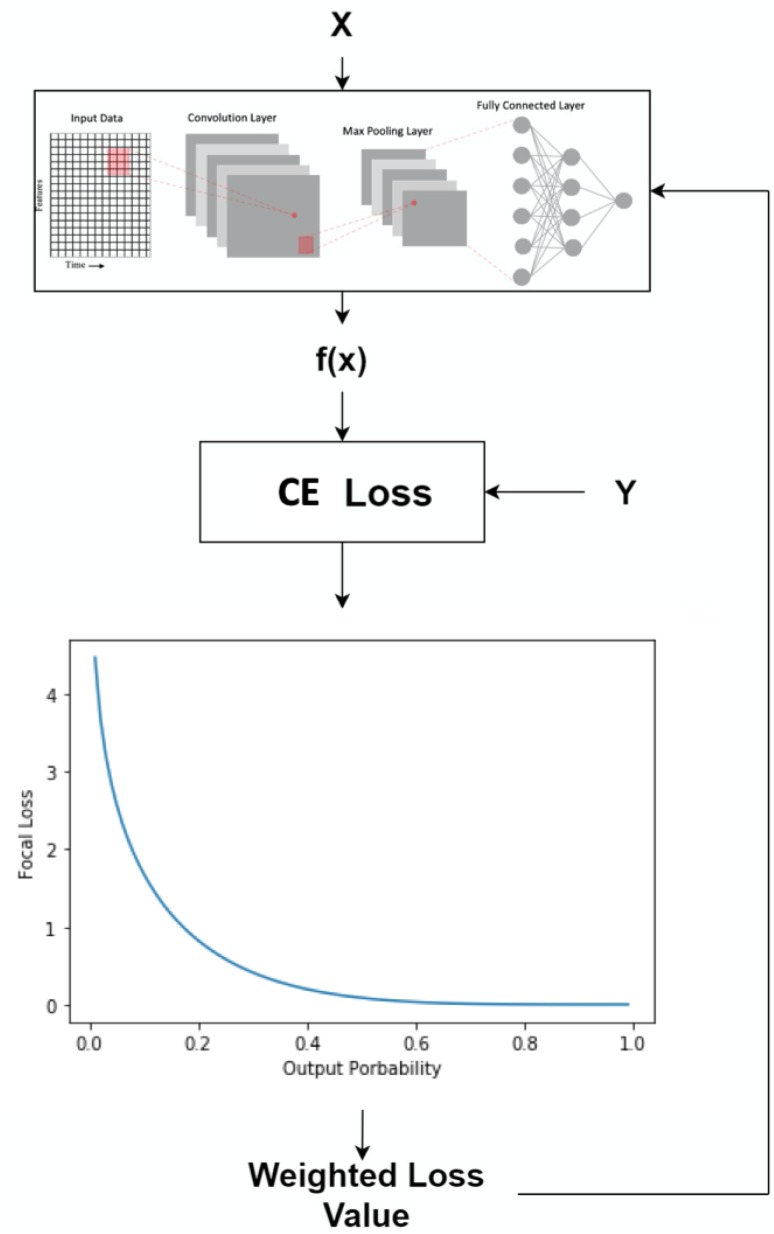
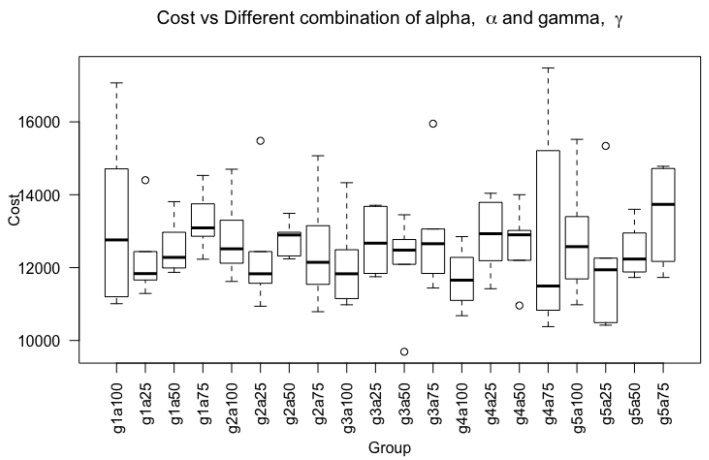
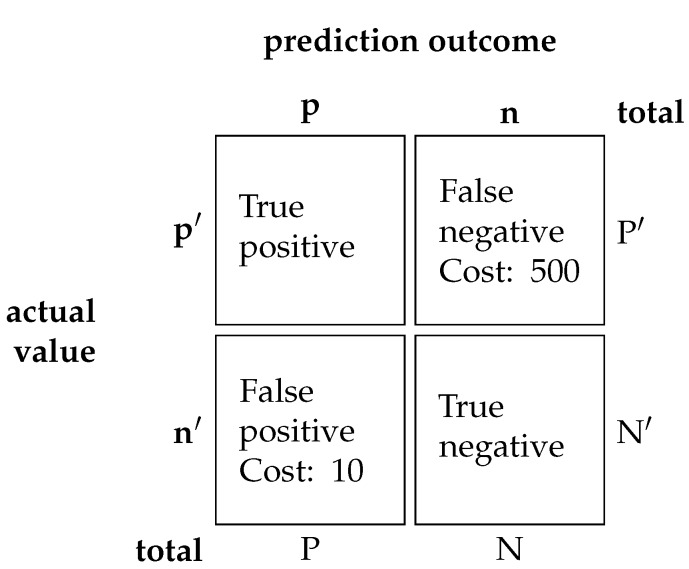
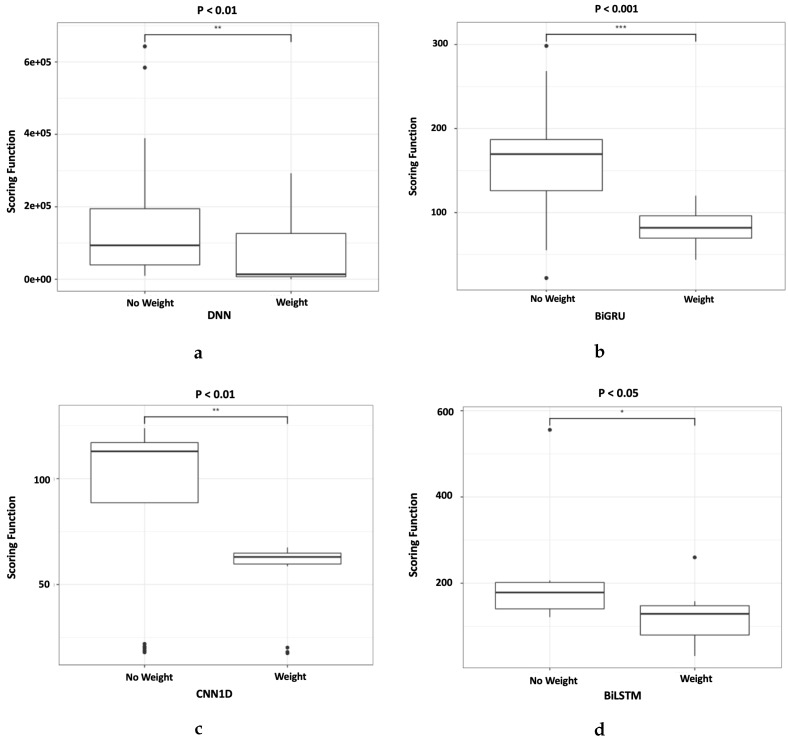
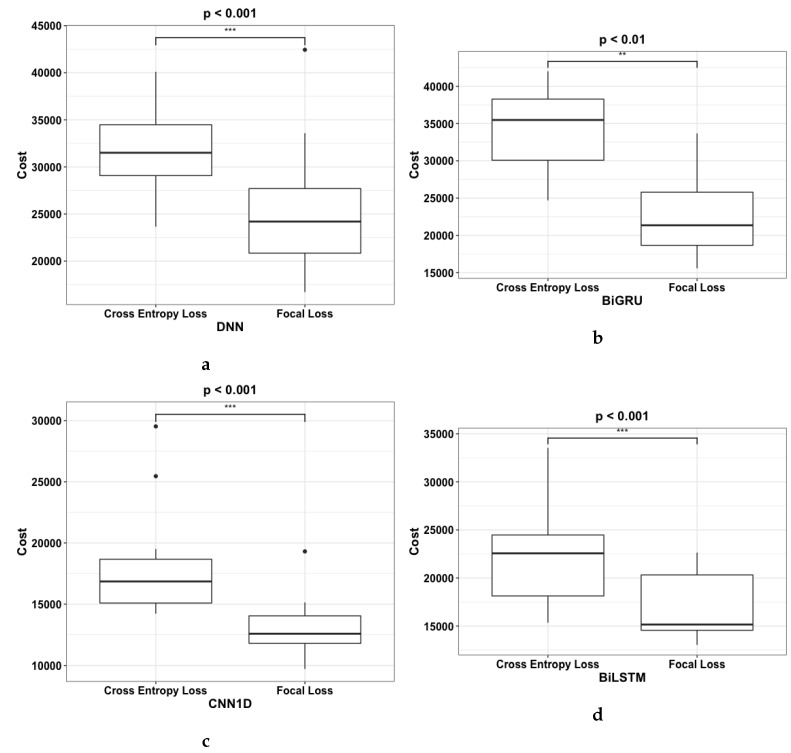
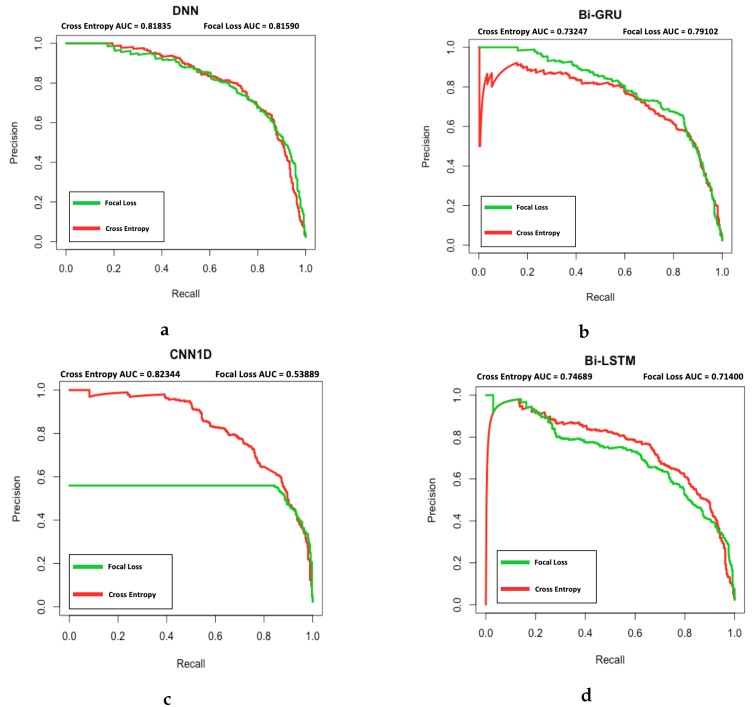
Deep learning has been employed to prognostic and health management of automotive and aerospace with promising results. Literature in this area has revealed that most contributions regarding deep learning is largely focused on the model's architecture. However, contributions regarding improvement of different aspects in deep learning, such as custom loss function for prognostic and health management are scarce. There is therefore an opportunity to improve upon the effectiveness of deep learning for the system's prognostics and diagnostics without modifying the models' architecture. To address this gap, the use of two different dynamically weighted loss functions, a newly proposed weighting mechanism and a focal loss function for prognostics and diagnostics task are investigated. A dynamically weighted loss function is expected to modify the learning process by augmenting the loss function with a weight value corresponding to the learning error of each data instance. The objective is to force deep learning models to focus on those instances where larger learning errors occur in order to improve their performance. The two loss functions used are evaluated using four popular deep learning architectures, namely, deep feedforward neural network, one-dimensional convolutional neural network, bidirectional gated recurrent unit and bidirectional long short-term memory on the commercial modular aero-propulsion system simulation data from NASA and air pressure system failure data for Scania trucks. Experimental results show that dynamically-weighted loss functions helps us achieve significant improvement for remaining useful life prediction and fault detection rate over non-weighted loss function predictions.

Keywords: deep learning; loss function; predictive maintenance; prognostics and health management; weighted loss function.


Conflict of interest statement

The authors declare no conflict of interest.

Figures

Figure 1
Figure 1
Basic components in a perceptron comprises of the input layer that can take in an arbitrary number of inputs, s, the weight, w that maps the inputs to the subsequent layer, a bias, b, activation function H to introduce non-linearity into the function and the output, Z.
Figure 2
Figure 2
An initial weight value iteratively minimized based on the partial derivative of a loss function to achieve global minima in loss.
Figure 3
Figure 3
A deep feedforward neural network (DNN) similar to the perceptron has the input layer along with the output layer. However, the DNN has a large number of hidden layers and neuron units.
Figure 4
Figure 4
The top part of the figure illustrates a normal two dimensional convolutional neural network (CNN) with its convolutional layer and max pooling layer. The max pooling layer is subsequently flattened to feed the data into a fully connected layer. The bottom figure is a one-dimensional convolutional neural network (CNN1D) network where the filter is moving in only one direction to perform the convolution and max-pooling operations.
Figure 5
Figure 5
The long short-term memory (LSTM) unit contain a forget gate, output gate and input gate. The yellow circle represents the sigmoid activation function while the pink circle represents a tanh activation function. Additionally, the ”×” and “+” symbols are the element-wise multiplication and addition operator.
Figure 6
Figure 6
The Bi-LSTM and Bi-GRU are structurally the same except for the LSTM and GRU unit. The red arrows indicate the input value flow, blue arrows are the output values, and the grey arrows represent the information flow between the LSTM/GRU units.
Figure 7
Figure 7
The gated recurrent unit (GRU) unit contain a reset gate and update gate. The yellow circle represents the sigmoid activation function while the pink circle represents a tanh activation function. Additionally, the ”×”, “+”, and ”1–” symbols are the element-wise multiplication, addition, and inversion operator.
Figure 8
Figure 8
The output f(x) from the deep learning model and the ground truth Y are used to calculate the mean square error (MSE) for one instance. The MSE is then passed through a non-linear function to produce the weight that will be used to dynamically adjust the loss function.
Figure 9
Figure 9
The output f(x) from the deep learning model and the ground truth Y are used to calculate the cross entropy (CE) loss for one instance. The CE is then combined with the weighted function to produce the weight that will be used to dynamically adjust the loss function.
Figure 10
Figure 10
Boxplot of final cost using a combination of gamma value, [1, 2, 3, 4, 5] and alpha value, [0.25, 0.5, 0.75, 1.0]. The x-axis are denoted by the combination of alpha and gamma. For instance, ’g1a100’ represents gamma value of 1 and alpha of 1.0.
Figure 11
Figure 11
A confusion matrix with the associated cost of each fault. A confusion matrix tabulates the performance of a classification model. A true positive and true negative are correct classification therefore, there are no cost associated to it. Whereas false positive and false negative receive a cost of 10 and 500 respectively. The p and n represents positive and negative class while P and N represents the total positive and negative class. The actual class is denoted by an apostrophe.
Figure 12
Figure 12
Boxplots of all scoring functions result from the four deep learning models, (a) DNN, (b) Bi-GRU, (c) CNN1D, and (d) Bi-LSTM using a dynamically weighted loss function, and without the weight. The asterisk on the top of each boxplot denotes the p-value where “***” < 0.001, “**” < 0.01, “*” < 0.05.
Figure 13
Figure 13
Boxplots of Costs result from using (a) DNN, (b) BiGRU, (c) CNN1D, and (d) BiLSTM with CE and FL respectively. The asterisk on the top of each boxplot denotes the p-value where “***” < 0.001, “**” < 0.01, “*” < 0.05.
Figure 14
Figure 14
PR Curve for (a) DNN, (b) Bi-GRU, (c) CNN1D, and (d) Bi-LSTM using focal loss (Green line) vs. cross entropy loss (Red line). The AUC of PR curves are included at the top of each plot for each loss function.

References

    1. He Y., Gu C., Chen Z., Han X. Integrated predictive maintenance strategy for manufacturing systems by combining quality control and mission reliability analysis. Int. J. Prod. Res. 2017;55:5841–5862. doi: 10.1080/00207543.2017.1346843. - DOI
    1. Short M., Twiddle J. An industrial digitalization platform for condition monitoring and predictive maintenance of pumping equipment. Sensors. 2019;19:3781. doi: 10.3390/s19173781. - DOI - PMC - PubMed
    1. Liu F., He Y., Zhao Y., Zhang A., Zhou D. Risk-oriented product assembly system health modeling and predictive maintenance strategy. Sensors. 2019;19:2086. doi: 10.3390/s19092086. - DOI - PMC - PubMed
    1. Zhu M., Liu C. A Correlation Driven Approach with Edge Services for Predictive Industrial Maintenance. Sensors. 2018;18:1844. doi: 10.3390/s18061844. - DOI - PMC - PubMed
    1. Tsui K.L., Chen N., Zhou Q., Hai Y., Wang W. Prognostics and Health Management: A Review on Data Driven Approaches. Math. Prob. Eng. 2015;2015:793161. doi: 10.1155/2015/793161. - DOI