

Transcriptomic Analyses of Camellia oleifera 'Huaxin' Leaf Reveal Candidate Genes Related to Long-Term Cold Stress
- PMID: 32013013
- PMCID: PMC7037897
- DOI: 10.3390/ijms21030846
Transcriptomic Analyses of Camellia oleifera 'Huaxin' Leaf Reveal Candidate Genes Related to Long-Term Cold Stress
Abstract
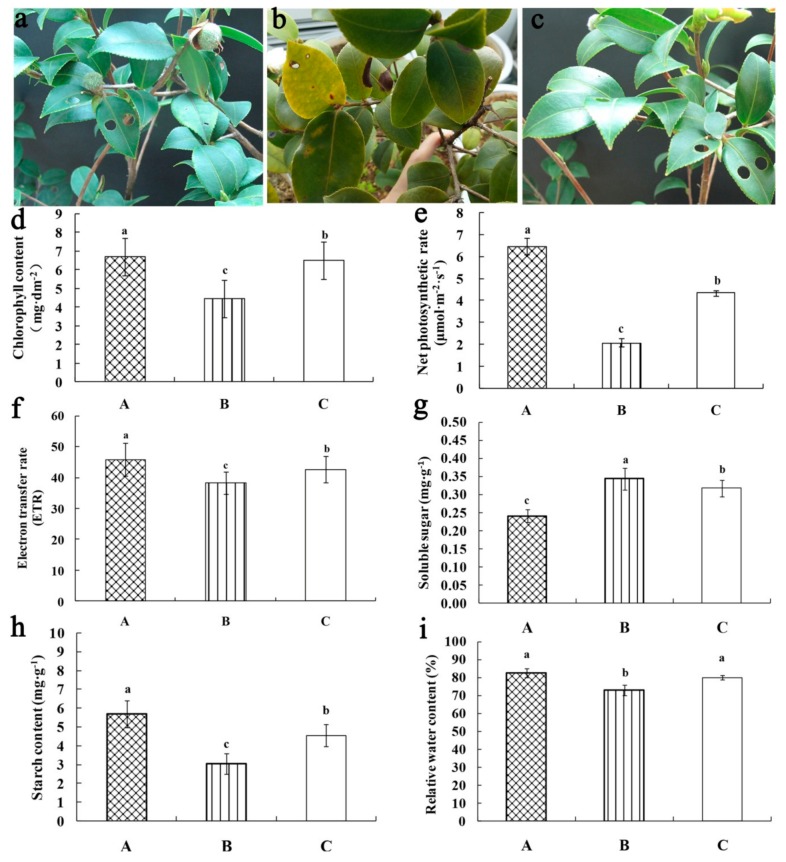
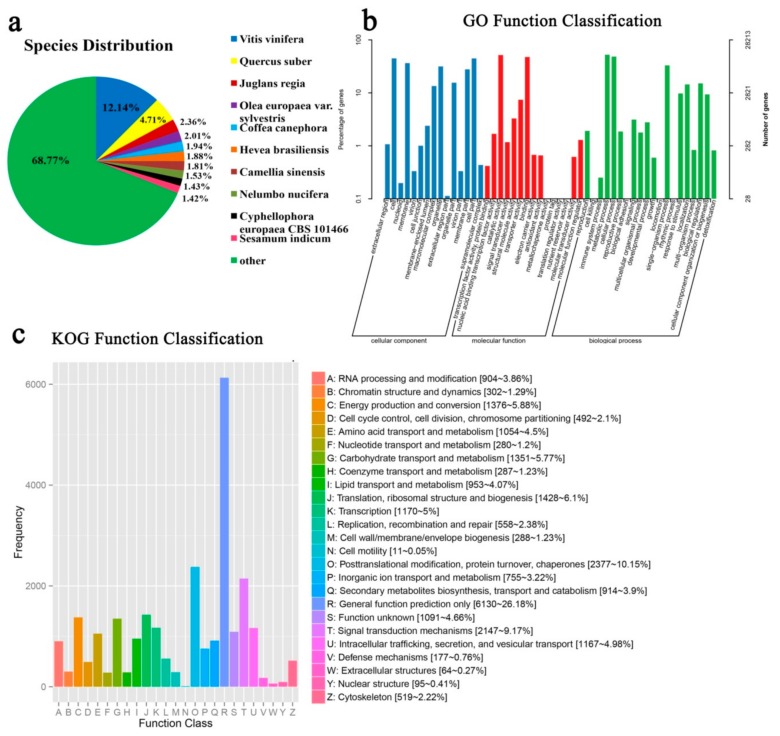
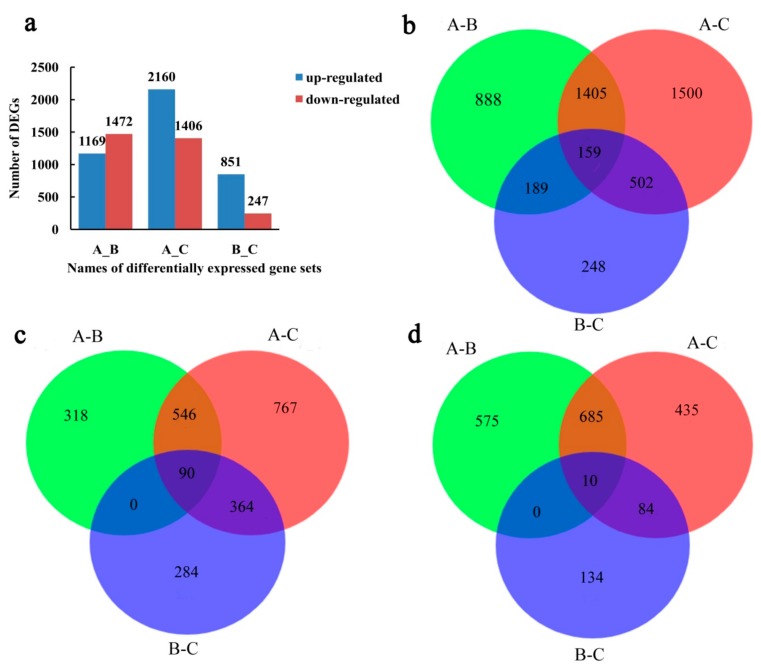
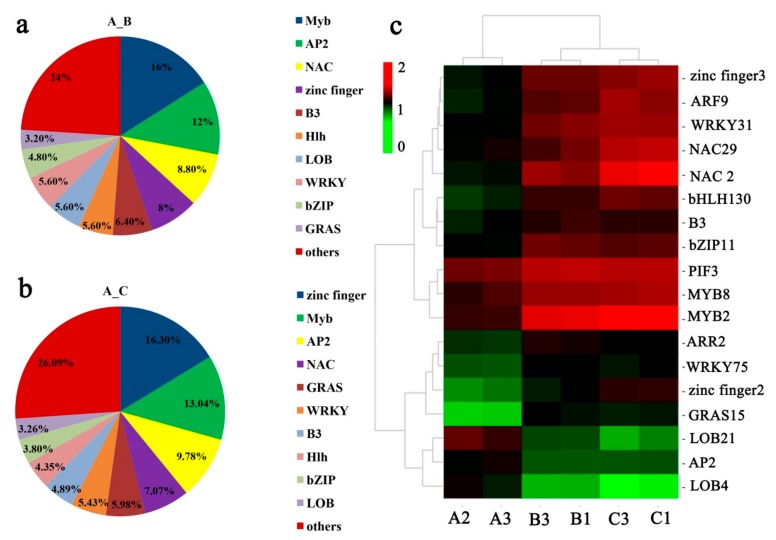
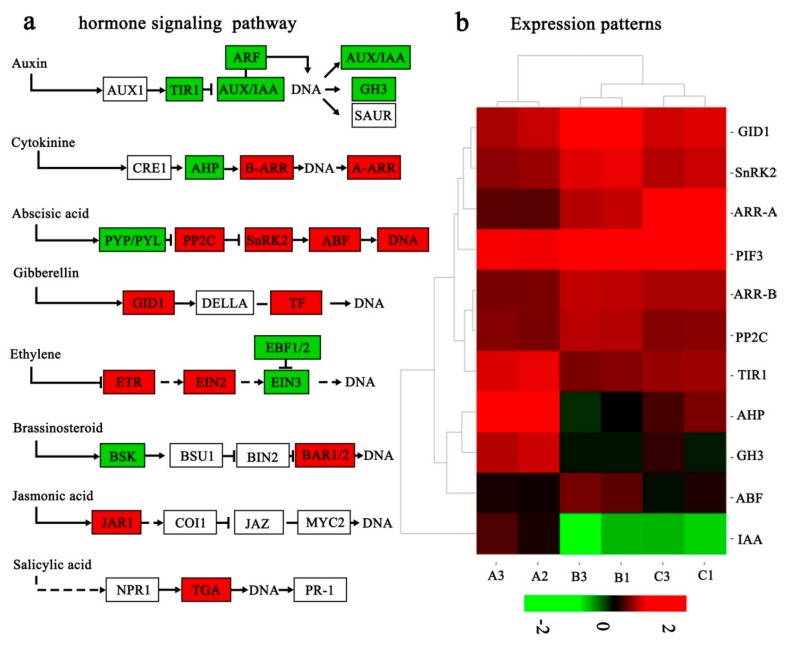
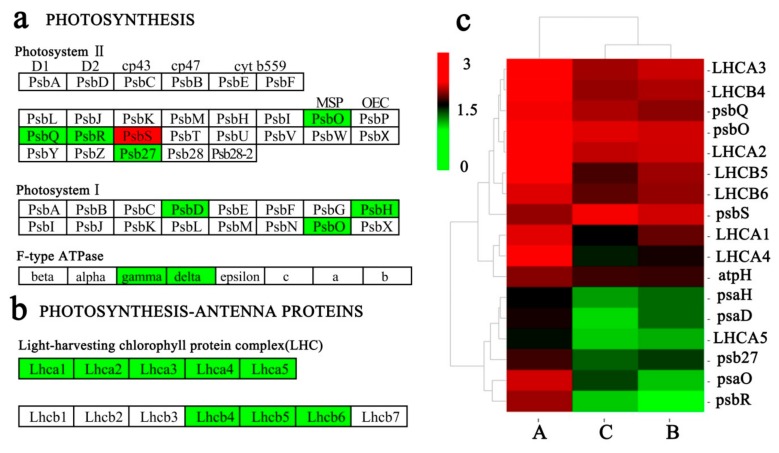
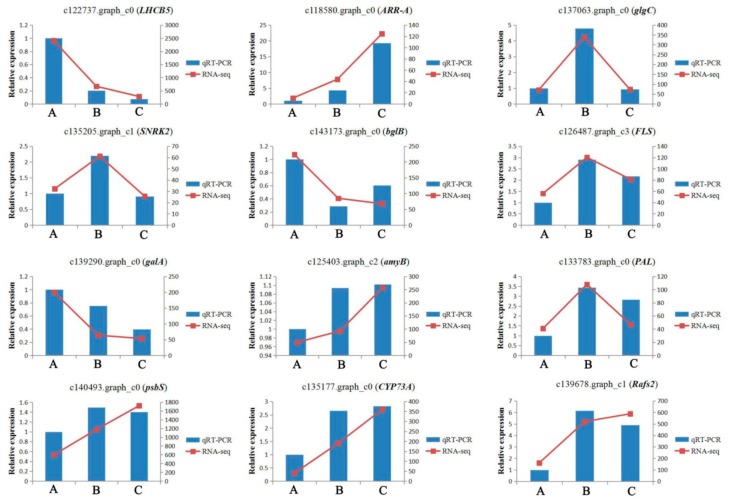
'Huaxin' is a new high-yielding timber cultivar of Camellia oleifera of high economic value, and has been widely cultivated in the red soil hilly region of Hunan Province of the People´s Republic of China in recent years. However, its quality and production are severely affected by low temperatures during flowering. To find genes related to cold tolerance and further explore new candidategenes for chilling-tolerance, Illumina NGS (Next Generation Sequencing) technology was used to perform transcriptomic analyses of C. oleifera 'Huaxin' leaves under long-term cold stress. Nine cDNA libraries were sequenced, and 58.31 Gb high-quality clean reads were obtained with an average of 5.92 Gb reads for each sample. A total of 191,150 transcripts were obtained after assembly. Among them, 100,703 unigenes were generated, and 44,610 unigenes were annotated. In total, 1564 differentially expressed genes (DEGs) were identified both in the A_B and A_C gene sets. In the current study, Gene Ontology (GO) and Kyoto Encyclopedia of Genes and Genomes (KEGG) pathway enrichment analyses were performed, andrevealed a group of cold-responsive genes related to hormone regulation, photosynthesis, membrane systems, and osmoregulation; these genes encoded many key proteins in plant biological processes, such as serine/threonine-protein kinase (STPK), transcription factors (TFs), fatty acid desaturase (FAD), lipid-transfer proteins (LTPs), soluble sugars synthetases, and flavonoid biosynthetic enzymes. Some physiological indicators of C. oleifera 'Huaxin' were determined under three temperature conditions, and the results were consistent with the molecular sequencing. In addition, the expression levels of 12 DEGs were verified using quantitative real-time polymerase chain reaction (qRT-PCR). In summary, the results of DEGs analysis together with qRT-PCR tests contribute to the understanding of cold tolerance and further exploring new candidate genes for chilling-tolerance in molecular breeding programs of C. oleifera 'Huaxin'.
Keywords: Camellia oleifera; DEGs; long-term cold stress; transcriptome sequence.
Conflict of interest statement
The authors declare that they have no conflict of interest.
Figures
References
-
- Tan X.F., Jiang G.X., Tan F.Y. Research report on industrialization development strategy of Vernicia fordii in China. Non Wood Forest Res. 2011;29:1–5.
-
- Li Z., Tan X.F., Liu Z.M., Lin Q., Zhang L., Yuan J., Zeng Y.L., Wu L.L. In vitro propagation of Camellia oleifera abel. using hypocotyl, cotyledonary node, and radicle explants. Hort Sci. 2016;51:416–421. doi: 10.21273/HORTSCI.51.4.416. - DOI
-
- Qu X.J., Wang H., Chen M., Liao J., Yuan J., Niu G.H. Drought stress–induced physiological and metabolic changes in leaves of two oil tea cultivars. J. Amer. Soc. Hort. 2019;144:1–9. doi: 10.21273/JASHS04775-19. - DOI
-
- Gao C., Yuan D.Y., Yang Y., Wang B.F., Liu D.M., Zou F. Pollen tube growth and double fertilization in Camellia oleifera. J. Amer. Soc. Hort. 2015;140:12–18. doi: 10.21273/JASHS.140.1.12. - DOI
-
- Chen J.M., Yang X.Q., Huang X.M., Duan S.H., Long C., Chen J.K., Rong J. Leaf transcriptome analysis of a subtropical evergreen broadleaf plant, wild oil-tea camellia (Camellia oleifera), revealing candidate genes for cold acclimation. BMC Genom. 2017;18:211–216. doi: 10.1186/s12864-017-3570-4. - DOI - PMC - PubMed
MeSH terms
Substances
LinkOut - more resources
Full Text Sources
