Development of a Knee Joint CT-FEM Model in Load Response of the Stance Phase During Walking Using Muscle Exertion, Motion Analysis, and Ground Reaction Force Data
- PMID: 32013100
- PMCID: PMC7074273
- DOI: 10.3390/medicina56020056
Development of a Knee Joint CT-FEM Model in Load Response of the Stance Phase During Walking Using Muscle Exertion, Motion Analysis, and Ground Reaction Force Data
Abstract
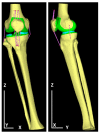
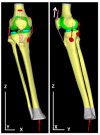
Background and objectives: There are no reports on articular stress distribution during walking based on any computed tomography (CT)-finite element model (CT-FEM). This study aimed to develop a calculation model of the load response (LR) phase, the most burdensome phase on the knee, during walking using the finite element method of quantitative CT images. Materials and Methods: The right knee of a 43-year-old man who had no history of osteoarthritis or surgeries of the knee was examined. An image of the knee was obtained using CT and the extension position image was converted to the flexion angle image in the LR phase. The bone was composed of heterogeneous materials. The ligaments were made of truss elements; therefore, they do not generate strain during expansion or contraction and do not affect the reaction force or pressure. The construction of the knee joint included material properties of the ligament, cartilage, and meniscus. The extensor and flexor muscles were calculated and set as the muscle exercise tension around the knee joint. Ground reaction force was vertically applied to suppress the rotation of the knee, and the thigh was restrained. Results: An FEM was constructed using a motion analyzer, floor reaction force meter, and muscle tractive force calculation. In a normal knee, the equivalent stress and joint contact reaction force in the LR phase were distributed over a wide area on the inner upper surface of the femur and tibia. Conclusions: We developed a calculation model in the LR phase of the knee joint during walking using a CT-FEM. Methods to evaluate the heteromorphic risk, mechanisms of transformation, prevention of knee osteoarthritis, and treatment may be developed using this model.
Keywords: equivalent stress; finite element; joint reaction force; knee joint; musculoskeletal model.
Conflict of interest statement
The authors declare no conflict of interest.
Figures


Similar articles
-
A Simulation Case Study of Knee Joint Compressive Stress during the Stance Phase in Severe Knee Osteoarthritis Using Finite Element Method.Medicina (Kaunas). 2021 May 30;57(6):550. doi: 10.3390/medicina57060550. Medicina (Kaunas). 2021. PMID: 34070851 Free PMC article.
-
Contributions to the understanding of gait control.Dan Med J. 2014 Apr;61(4):B4823. Dan Med J. 2014. PMID: 24814597 Review.
-
Finite element analysis of the femur during stance phase of gait based on musculoskeletal model simulation.Biomed Mater Eng. 2014;24(6):2485-93. doi: 10.3233/BME-141062. Biomed Mater Eng. 2014. PMID: 25226949
-
A finite element model of the human knee joint for the study of tibio-femoral contact.J Biomech Eng. 2002 Jun;124(3):273-80. doi: 10.1115/1.1470171. J Biomech Eng. 2002. PMID: 12071261
-
Muscle, ligament, and joint-contact forces at the knee during walking.Med Sci Sports Exerc. 2005 Nov;37(11):1948-56. doi: 10.1249/01.mss.0000180404.86078.ff. Med Sci Sports Exerc. 2005. PMID: 16286866 Review.
Cited by
-
Case Report: Rehabilitation of a giant meniscus cyst with a mixed tear.Front Rehabil Sci. 2025 Jan 17;5:1483226. doi: 10.3389/fresc.2024.1483226. eCollection 2024. Front Rehabil Sci. 2025. PMID: 39897944 Free PMC article.
-
Strain energy in human tibia during different exercises with adjustable leg weights: a subject-specific computational model analysis.Med Biol Eng Comput. 2025 Mar 7. doi: 10.1007/s11517-025-03335-9. Online ahead of print. Med Biol Eng Comput. 2025. PMID: 40053302
-
Simulating Knee-Stress Distribution Using a Computed Tomography-Based Finite Element Model: A Case Study.J Funct Morphol Kinesiol. 2023 Jan 27;8(1):15. doi: 10.3390/jfmk8010015. J Funct Morphol Kinesiol. 2023. PMID: 36810499 Free PMC article.
-
Toward a clear relationship between mechanical signals and bone adaptation.Mechanobiol Med. 2025 Feb 1;3(1):100115. doi: 10.1016/j.mbm.2025.100115. eCollection 2025 Mar. Mechanobiol Med. 2025. PMID: 40396131 Free PMC article. Review.
-
A Simulation Case Study of Knee Joint Compressive Stress during the Stance Phase in Severe Knee Osteoarthritis Using Finite Element Method.Medicina (Kaunas). 2021 May 30;57(6):550. doi: 10.3390/medicina57060550. Medicina (Kaunas). 2021. PMID: 34070851 Free PMC article.
References
-
- Ackroyd R.T. Finite Element Methods for Particle Transport. Research Studies Press; Taunton, Somerset, UK: 1997. pp. 8–12.
-
- Jiang B. The Least-Squares Finite Element Method. Springer; New York, NY, USA: 1998. pp. 3–10.
-
- Bessho M., Ohnishi I., Matsumoto T., Ohashi S., Matsuyama J., Tobita K., Kaneko M., Nakamura K. Prediction of proximal femur strength using a CT-based nonlinear finite element method: Differences in predicted fracture load and site with changing load and boundary conditions. Bone. 2009;45:226–231. doi: 10.1016/j.bone.2009.04.241. - DOI - PubMed
Publication types
MeSH terms
LinkOut - more resources
Full Text Sources

