. 2020 Jan 29;21(3):861.
doi: 10.3390/ijms21030861.

Comparative Transcriptome Analysis of Different Dendrobium Species Reveals Active Ingredients-Related Genes and Pathways

Affiliations

Comparative Transcriptome Analysis of Different Dendrobium Species Reveals Active Ingredients-Related Genes and Pathways

Yingdan Yuan et al. Int J Mol Sci. .

Abstract

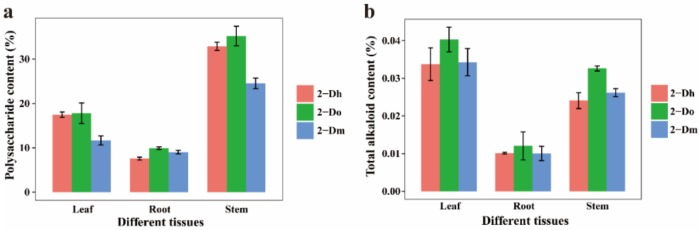
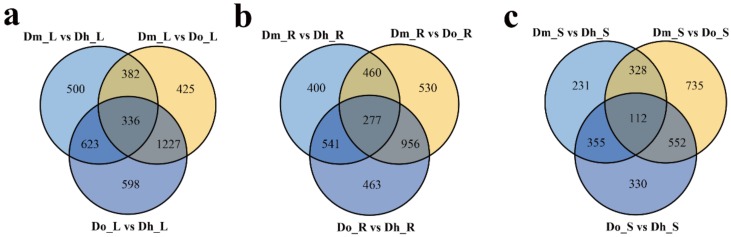
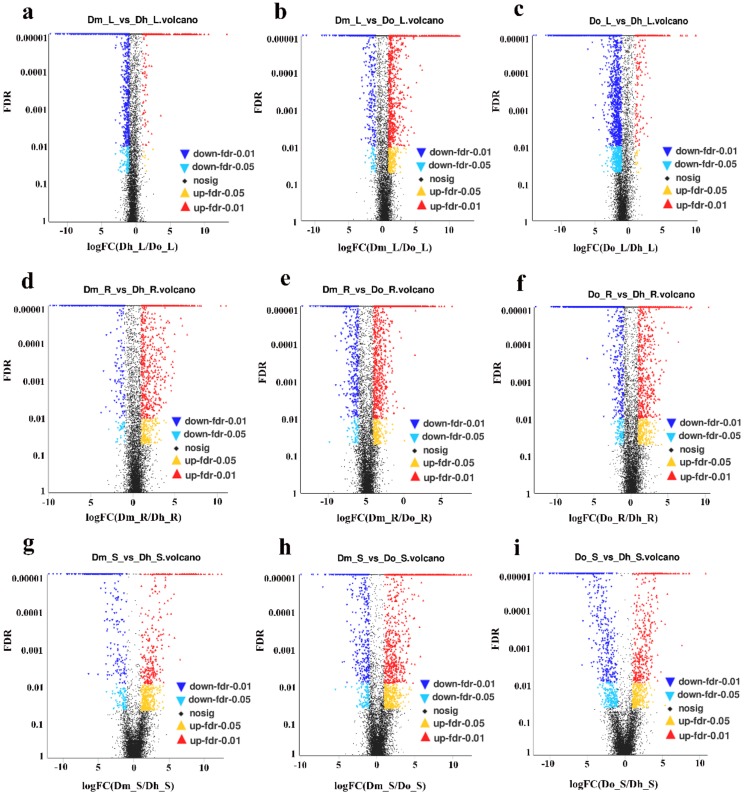
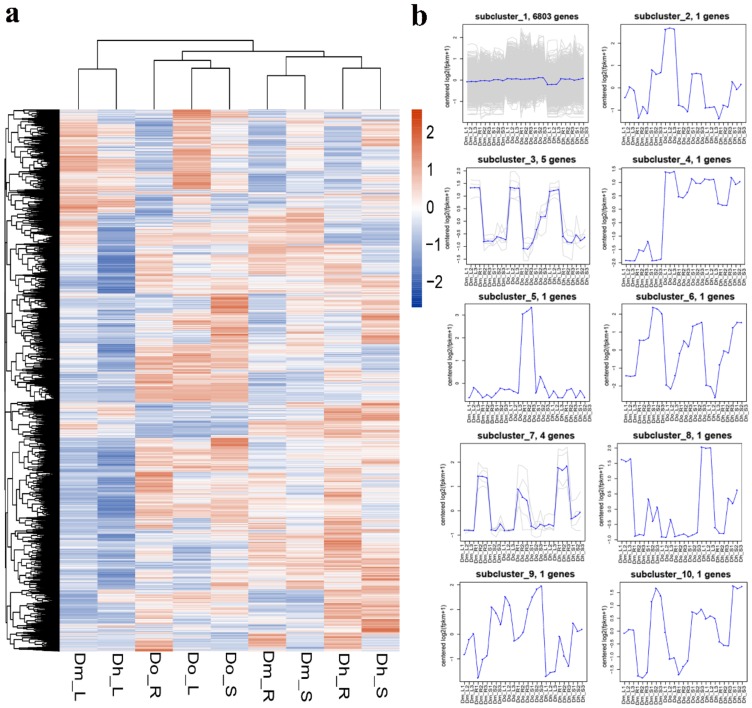
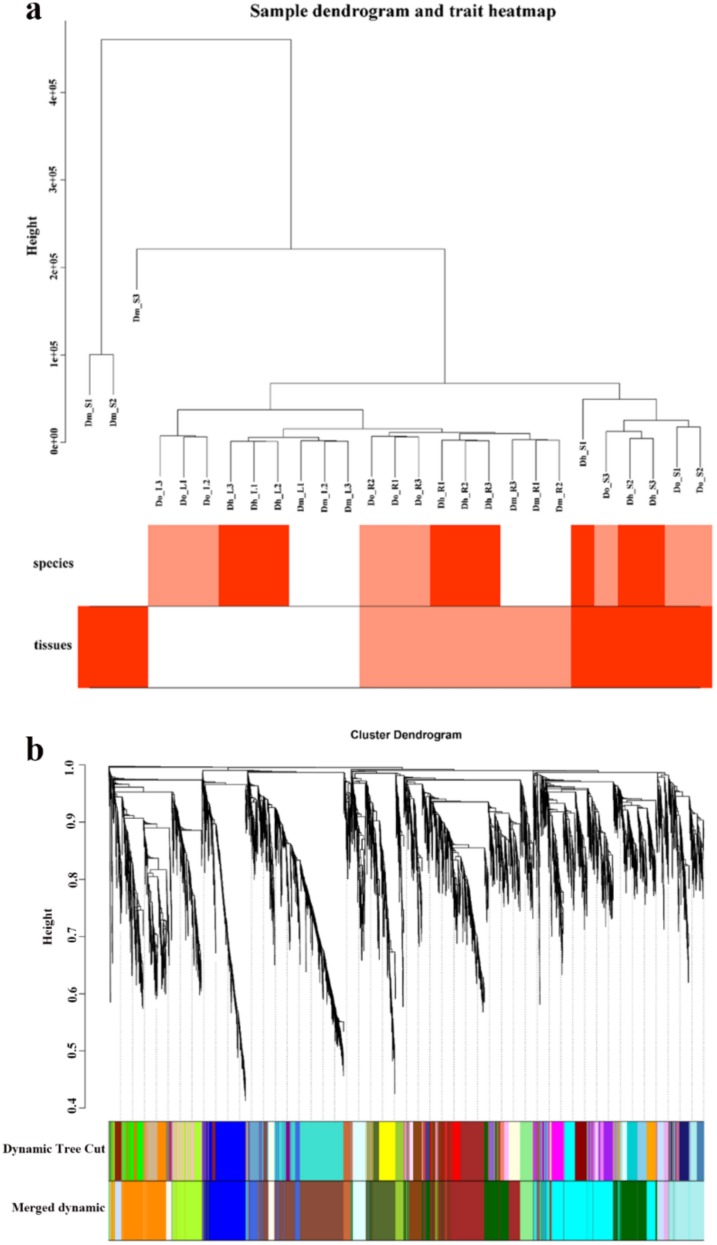
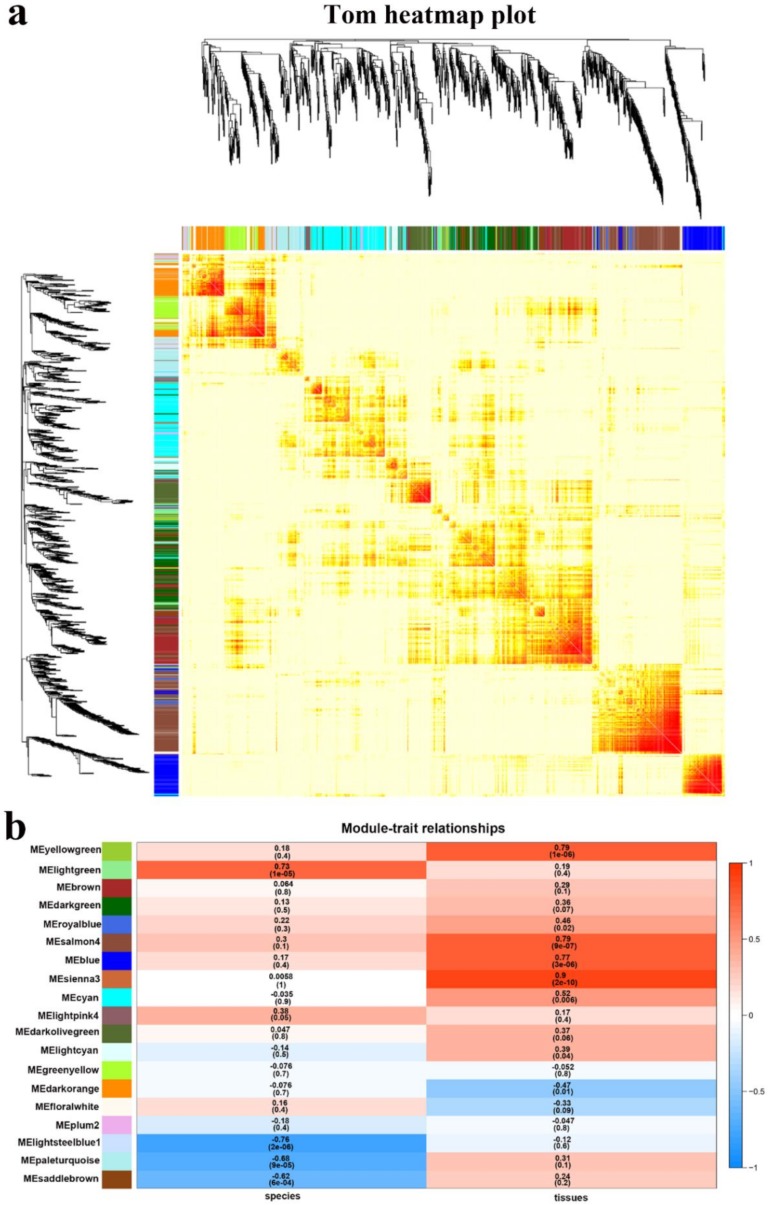
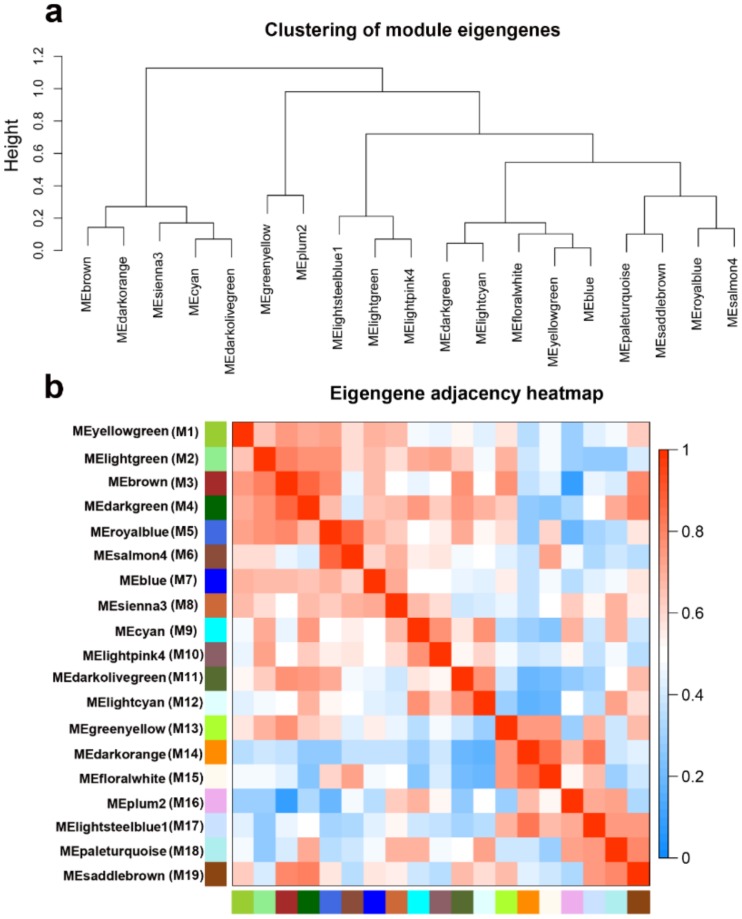
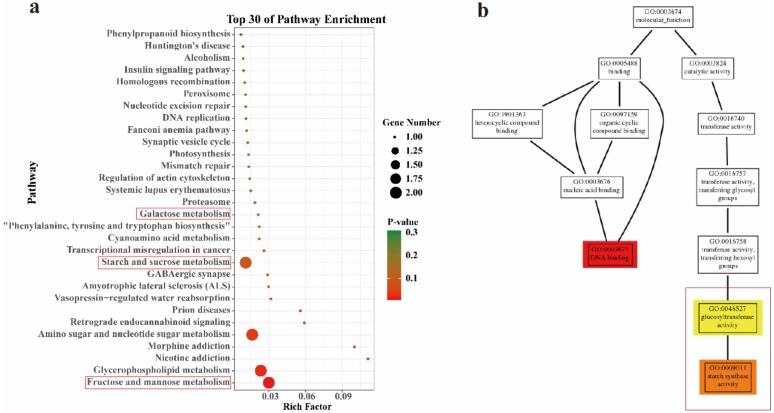
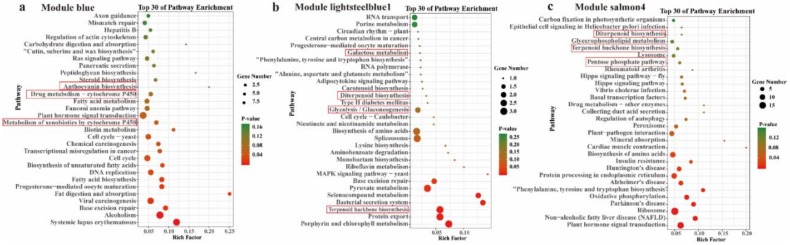
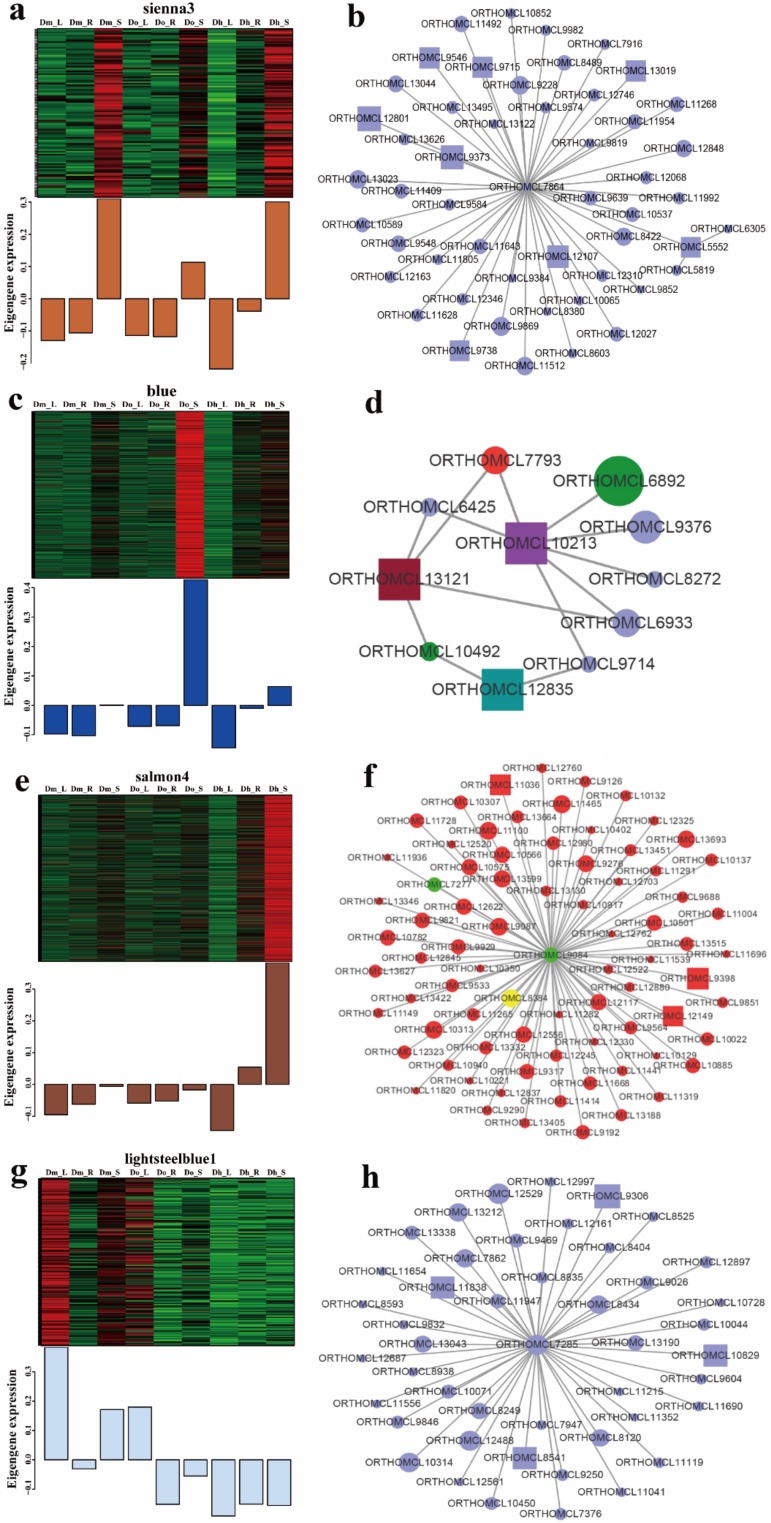
Dendrobium is widely used in traditional Chinese medicine, which contains many kinds of active ingredients. In recent years, many Dendrobium transcriptomes have been sequenced. Hence, weighted gene co-expression network analysis (WGCNA) was used with the gene expression profiles of active ingredients to identify the modules and genes that may associate with particular species and tissues. Three kinds of Dendrobium species and three tissues were sampled for RNA-seq to generate a high-quality, full-length transcriptome database. Based on significant changes in gene expression, we constructed co-expression networks and revealed 19 gene modules. Among them, four modules with properties correlating to active ingredients regulation and biosynthesis, and several hub genes were selected for further functional investigation. This is the first time the WGCNA method has been used to analyze Dendrobium transcriptome data. Further excavation of the gene module information will help us to further study the role and significance of key genes, key signaling pathways, and regulatory mechanisms between genes on the occurrence and development of medicinal components of Dendrobium.

Keywords: Dendrobium; active ingredients; comparative transcriptome; different tissues.


Conflict of interest statement

The authors declare no conflict of interest.

Figures

Figure 1
Figure 1
Polysaccharide and total alkaloid contents variation in different tissues of different species. (a) Polysaccharide content. (b) Total alkaloid content. There are three replicates of each sample. 2-Dh: two-year-old Dendrobium huoshanese, 2-Do: two-year-old Dendrobium officinale, 2-Dm: two-year-old Dendrobium moniliforme.
Figure 2
Figure 2
Venn diagram of differentially expressed genes (DEGs) in different comparisons. All DEGs are grouped into three comparison groups represented by three circles. The overlapping portions of the different circles represent the number of DEGs common to these comparison groups. (a) Venn diagram of three kinds of Dendrobium leaves. (b) Venn diagram of three kinds of Dendrobium roots. (c) Venn diagram of three kinds of Dendrobium stems.
Figure 3
Figure 3
Volcano plots of the DEGs in different comparisons. Red dots indicate significant up-regulation of genes, and blue dots indicate significant down-regulation of genes. Black dots represent non-DEGs. (a) Dm_L vs. Dh_L volcano; (b) Dm_L vs. Do_L volcano; (c) Do_L vs. Dh_L volcano; (d) Dm_R vs. Dh_R volcano; (e) Dm_R vs. Do_R volcano; (f) Do_R vs. Dh_R volcano; (g) Dm_S vs. Dh_S volcano; (h) Dm_S vs. Do_S volcano; (i) Do_S vs. Dh_S volcano.
Figure 4
Figure 4
Expression profiles of all DEGs. (a) The heatmap of DEGs and the FPKM distribution of all unigenes obtained by hierarchical cluster analysis. Each column in the figure represents a sample, and each row represents a gene. The colors in the graph indicate the magnitude of gene expression (log10 (FPKM + 1)) in the sample. Red indicates that the gene is highly expressed in the sample, and the blue indicates that the gene expression is low. (b) K-means clustering analysis of gene expression profiles. The blue line represents the expression model. The gray lines are the expression profiles of each DEGs. The x-axis represents different tissues of different Dendrobium plants. The y-axis represents log2 (ratio).
Figure 5
Figure 5
Gene Ontology (GO) annotations of up and down regulated DEGs. The bottom x-axis indicates the number of DEGs annotated to a GO term, the upper x-axis indicates the proportion of DEGs annotated to a GO terms to the total number of all GO annotated DEGs; and the y-axis represents each detailed classification of GO. (a) Dm_S vs Dh_S GO annotation; (b) Dm_S vs. Do_S GO annotation; (c) Do_S vs. Dh_S GO annotation.
Figure 6
Figure 6
Kyoto Encyclopedia of Genes and Genomes (KEGG) pathway enrichment of DEGs. The x-axis represents the pathway name, and the y-axis represents the enrichment ratio (sample number/background number). (a) Dm_S vs. Dh_S; (b) Dm_S vs. Do_S; (c) Do_S vs. Dh_S. All pathways in the figure with asterisks indicate significant KEGG enrichment, with three asterisks indicating p-value < 0.001, two asterisks indicating p-value < 0.01, one asterisks indicating p-value < 0.05.
Figure 7
Figure 7
Clustering dendrogram. (a) Clustering dendrogram of 27 samples and heatmaps of species and tissues traits. The expression is from low to high, and the color transitions from white to red. (b) Clustering dendrogram of DEGs, with dissimilarity based on the topological overlap, together with assigned module colors. The clustered branches represent different modules, and each line represents one gene.
Figure 8
Figure 8
Co-expression network analysis across different tissues and different species. (a) Visualizing the gene network using a heatmap plot. The heatmap depicts the topological overlap matrix (TOM) among all genes in the analysis. (b) Module-trait associations. Each row corresponds to a module characteristic gene (eigengene), and each column corresponds to a trait. Each cell contains a corresponding correlation and p-value. According to the color legend, the table is color-coded by correlation.
Figure 9
Figure 9
Analysis of connectivity of eigengenes in different module. (a) Cluster analysis of eigengenes. (b) The heatmap of connectivity of eigengenes.
Figure 10
Figure 10
GO and Kyoto Encyclopedia of Genes and Genomes (KEGG) pathway enrichment of module sienna3. (a) Top 30 of KEGG pathway enrichment. (b) Thumbnails view of directed acyclic graph (DAG) on molecular function of module sienna3.
Figure 11
Figure 11
Kyoto Encyclopedia of Genes and Genomes (KEGG) pathway enrichment of interested module. (a) Module blue; (b) module lightsteelblue1; (c) module salmon4.
Figure 12
Figure 12
Expression profile and transcriptional regulatory network associated with the tissue-specific modules. (a), (c), (e), and (g) heatmaps showing genes in module that were significantly over-represented in Dm_L, Dm_R, Dm_S, Do_L, Do_R, Do_S, Dh_L, Dh_R, Dh_S and predicted transcriptional regulatory network associated with the gene sets showing expression patterns at Dm_L, Dm_R, Dm_S, Do_L, Do_R, Do_S, Dh_L, Dh_R, and Dh_S. Heatmaps show the expression profile of all the co-expressed genes (number given on the top) in the modules (labelled on top). Candidate hub genes are shown in rectangular shapes. Purple in figure (b, d and h) represents genes related to polysaccharides. Red in figure (d and f) represents genes related to secondary metabolites. The shapes, from big to small, indicate the weights from big to small. Green in figure d represents bHLH transcription factors. Green in figure (f) represents bZIP transcription factors and yellow represents MYB transcription factors.

References

    1. Wood H.P. The Dendrobiums. ARG Gantner Verlag Timber Press; Portland, OR, USA: 2006.
    1. Zotz G. The systematic distribution of vascular epiphytes—A critical update. Bot. J. Linn. Soc. 2013;171:453–481. doi: 10.1111/boj.12010. - DOI
    1. Lian W., Xu J. The chromosome number in Dendrobium I. Ten species. J. Wuhan Bot. Res. 1989;7:112–114.
    1. Zhitao N., Shuying Z., Jiajia P., Ludan L., Jing S., Xiaoyu D. Comparative analysis of Dendrobium plastomes and utility of plastomic mutational hotspots. Sci. Rep. 2017;7:2073. doi: 10.1038/s41598-017-02252-8. - DOI - PMC - PubMed
    1. Tang H., Zhao T., Sheng Y., Zheng T., Fu L., Zhang Y. Dendrobium officinale kimura et migo: A review on its ethnopharmacology, phytochemistry, pharmacology, and industrialization. Evid. Based Complement. Altern. Med. 2017;2017:19. doi: 10.1155/2017/7436259. - DOI - PMC - PubMed

LinkOut - more resources