. 2020 Jan 29;21(3):875.
doi: 10.3390/ijms21030875.

Poly(ADP-Ribose) Polymerase-3 Regulates Regeneration in Planarians

Affiliations

Poly(ADP-Ribose) Polymerase-3 Regulates Regeneration in Planarians

Paul G Barghouth et al. Int J Mol Sci. .

Abstract

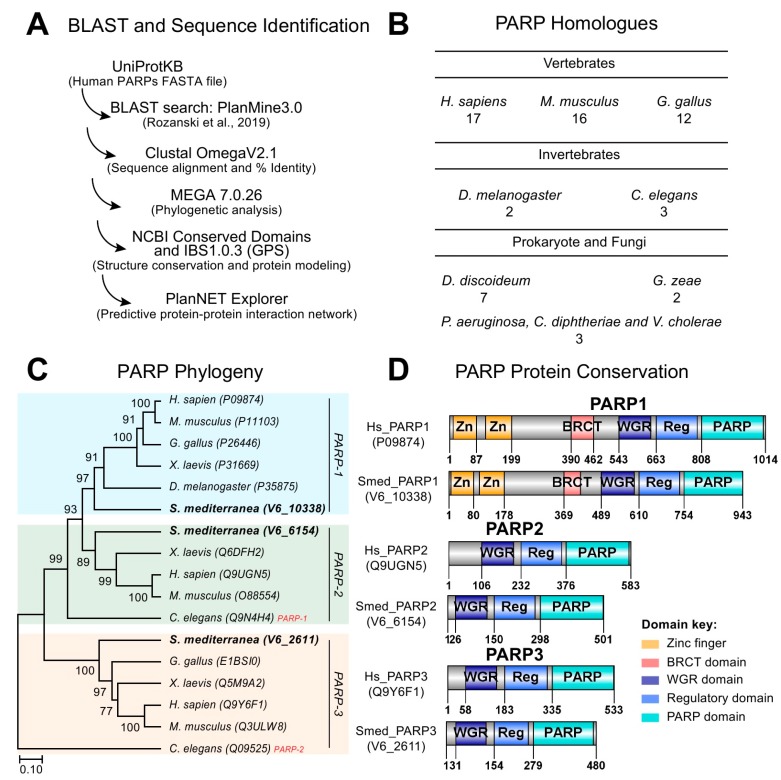
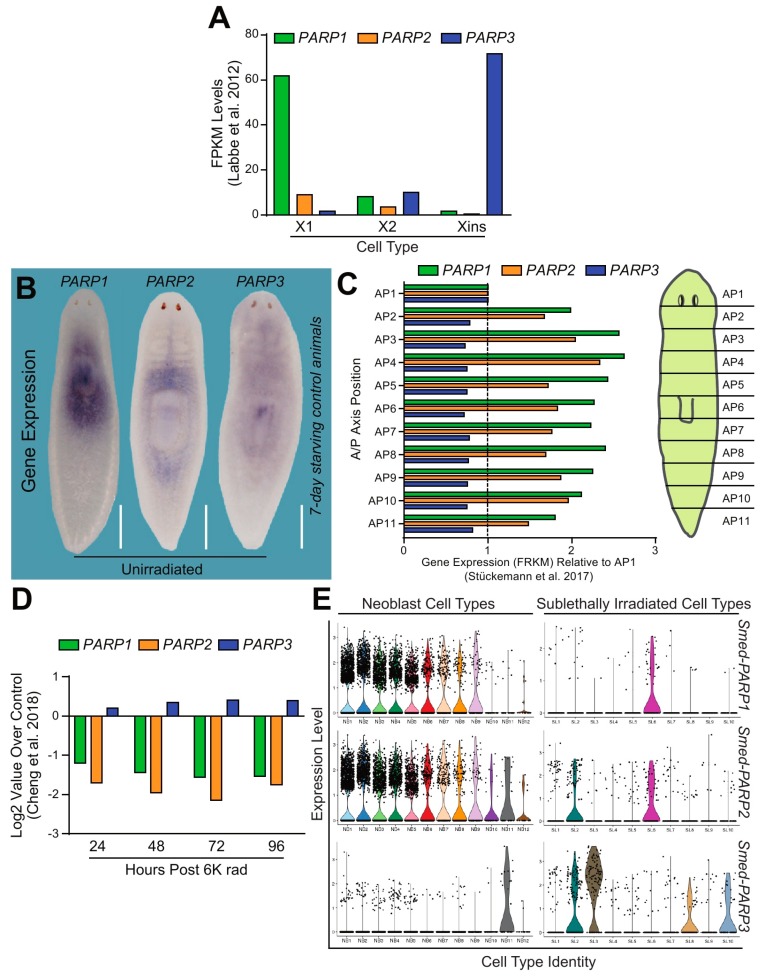
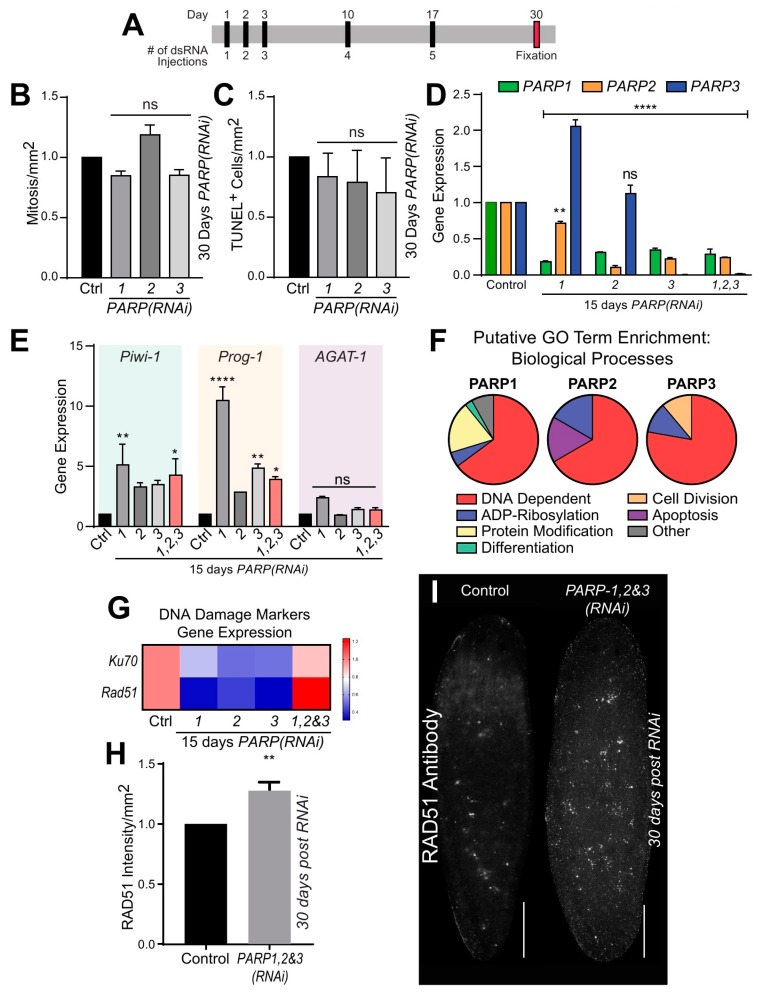
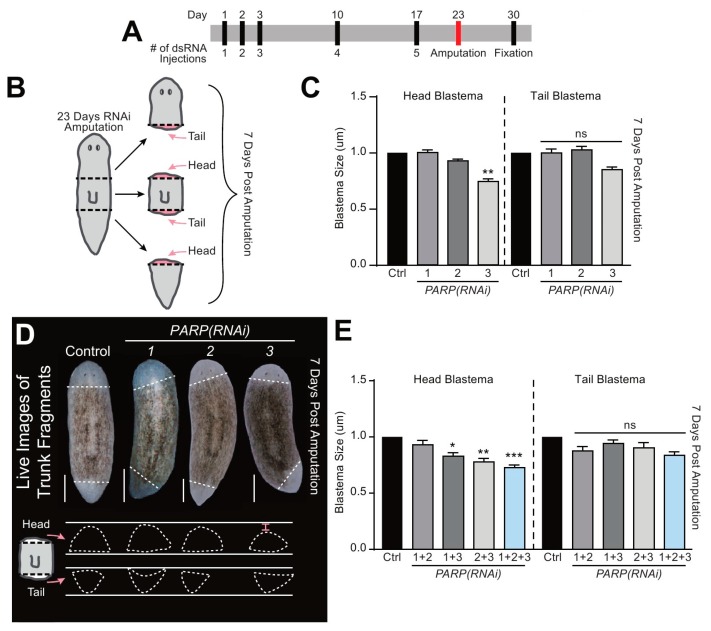
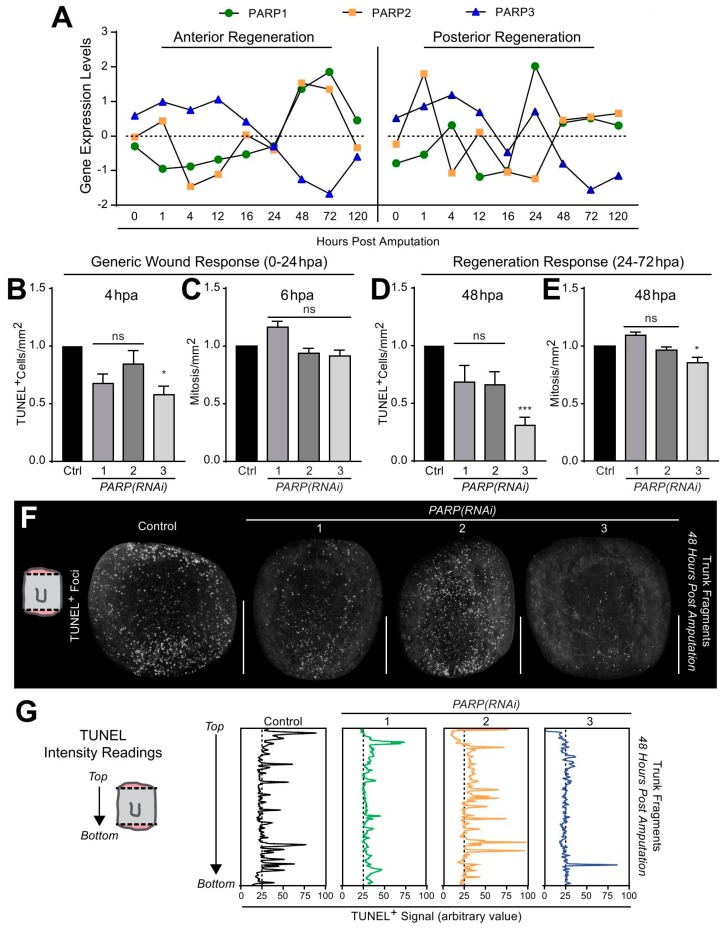
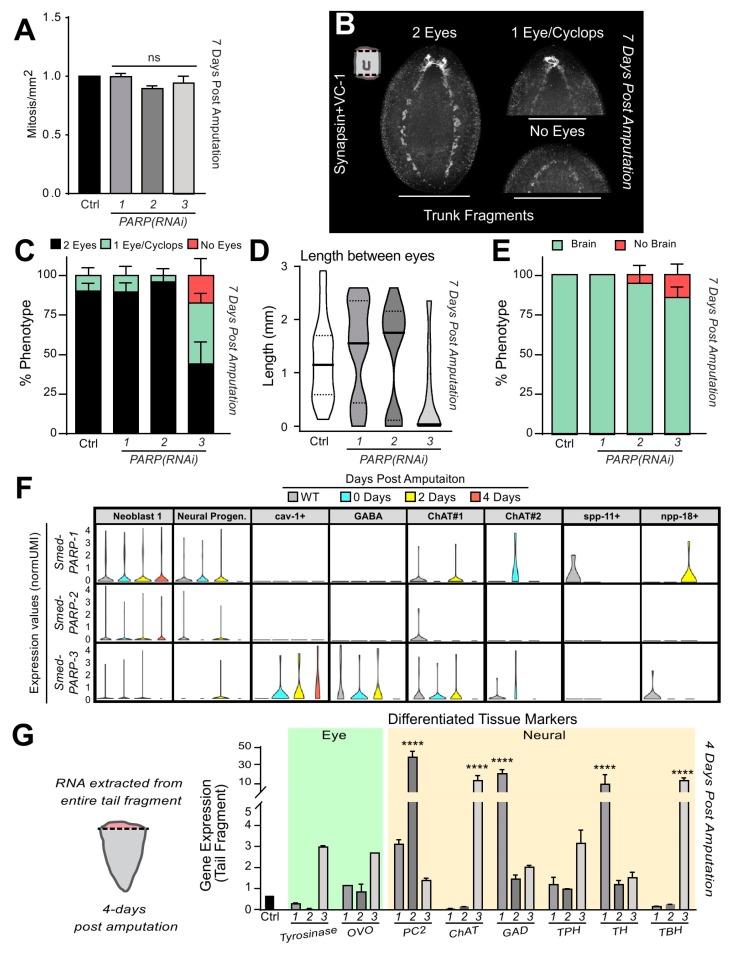
Protein ADP-ribosylation is a reversible post-translational modification (PTM) process that plays fundamental roles in cell signaling. The covalent attachment of ADP ribose polymers is executed by PAR polymerases (PARP) and it is essential for chromatin organization, DNA repair, cell cycle, transcription, and replication, among other critical cellular events. The process of PARylation or polyADP-ribosylation is dynamic and takes place across many tissues undergoing renewal and repair, but the molecular mechanisms regulating this PTM remain mostly unknown. Here, we introduce the use of the planarian Schmidtea mediterranea as a tractable model to study PARylation in the complexity of the adult body that is under constant renewal and is capable of regenerating damaged tissues. We identified the evolutionary conservation of PARP signaling that is expressed in planarian stem cells and differentiated tissues. We also demonstrate that Smed-PARP-3 homolog is required for proper regeneration of tissues in the anterior region of the animal. Furthermore, our results demonstrate, Smed-PARP-3(RNAi) disrupts the timely location of injury-induced cell death near the anterior facing wounds and also affects the regeneration of the central nervous system. Our work reveals novel roles for PARylation in large-scale regeneration and provides a simplified platform to investigate PARP signaling in the complexity of the adult body.

Keywords: PARP; apoptosis; neoblasts; planarians; regeneration; stem cells.


Conflict of interest statement

The authors declare no conflict of interest.

Figures

Figure 1
Figure 1
Conservation of DNA dependent PARylation signaling in planarian. (A) PARylation gene identification schematic and design. Human Query IDs were BLASTed into PlanMine 3.0 [24], resulting in a broad range of Smed ID hits outputs. (B) Number of PARP homologs across different species ranging from vertebrates and invertebrates to prokaryotes and fungi. (C) Phylogenetic bootstrap consensus tree of PARP-1, -2, and -3 (gene groupings are color coded, respectively) across an array of species using MEGA7 software. Analysis shows that planarian PARP homologues are clustered properly per PARP number unlike its close relative C. elegans. (D) Protein conservation modeling of Smed-PARP-1, -2, and -3 relative to the human counterpart. Signature domains of PARPs -1, -2, and -3 are the PARP domain, PARP regulatory domain (i.e., Reg.), and the tryptophan-glycine-arginine-rich (WGR) interacting domain. Key signatures of PARP-1 were found to be conserved in the planarian with BCRT and zinc finger (Zn) domains.
Figure 2
Figure 2
DNA dependent PARPs are highly expressed throughout the planarian. (A) Fragments per kilobase of exon model per million reads mapped (FPKM) levels depict gene expression of Smed-PARP-1, -2, and -3 (i.e., green, orange, and blue, respectively). Data is derived from FACS-isolated single-cell RNA sequencing [27]. It is evident that Smed-PARP-1 and -2 are expressed in the neoblast and early progenitor populations (e.g., X1 and X2, reactively) while Smed-PARP-3 is expressed within the differentiated (e.g., Xins) compartment. (B) Whole mount in situ hybridization probing for Smed-PARP-1, -2, and -3 within 7-day starving control animals. Scale bar 200 µm. (C) Expression levels for Smed-PARP-1, -2, and -3 across the 11 planarian anteroposterior axis quadrants derived from Stuckemann et al. [29]. Data represents the fold change in FPKM relative to the AP1 quadrant. (D) Expression levels during a 96-h time course post lethal (6000 rad) irradiation dose for Smed-PARP-1, -2, and -3. Data derived from Cheng et al. 2018 [31]. (E) Expression levels for Smed-PARP-1, -2, and -3 determined from the Planosphere fate mapping atlas [35]. Smed-PARP-1 and -2 expression is widely distributed among the neoblast cell clusters and Smed-PARP-3 within the neural neoblast cluster and the sub-lethally irradiated cell clusters of the nervous and pharyngeal tissues.
Figure 3
Figure 3
Smed-PARPs have a conserved role in the preservation of genomic stability during planarian cellular turnover. (A) Injection time course regimen consisting of five dsRNA microinjections throughout 30-days. (B,C) Quantification of mitotic events and cell death 30 dpfi, result in no significant alterations in events relative to the injected control. These results are derived from two independent experiments consisting of a total of 16 animals per RNAi group. (D) Gene expression levels 15 dpfi to determine RNAi efficiency for single and triple RNAi of Smed-PARP genes. Interestingly, RNAi of Smed-PARP-1 and -2, resulted in an increase in Smed-PARP-3 gene expression. (E) Graph depicts gene expression of markers specific to neoblasts and their post-mitotic progeny (i.e., Smed-Piwi-1, Smed-Prog-1, and Smed-AGAT-1 genes are represented via color coding, respectively) for animals 15-days into the phenotype. (D,E) All gene expression values are relative to the internal control clone H.55.12e. RNA extractions consisted of greater than 10 animals per group. (F) Putative GO term enrichment derived from PlanNET predicts the Smed protein function based off of the human protein interactome [36]. It is predicted that Smed-PARP-1, -2, and -3 have a conserved function in regulating DNA dependent, ADP-Ribosylation, and protein modification biological processes. (G) Heatmap representing DNA damage marker gene expression levels for Smed-Ku70 and Smed-Rad51 15 dpfi. Expression levels are as follows: low (blue), high (red) and relative to control (pink). (H,I) Quantification and visual representation of increased DNA damage levels determined by RAD51 protein levels 30-days post triple RNAi of Smed-PARP-1, -2, and -3. Increase in RAD51 expression was determined by the intensity of the signal relative to the animal surface area, using ImageJ software. All graphs represent mean ± SEM Statistics were obtained by two-way ANOVA; ns: no significance, * < 0.05, **  < 0.001, ***  < 0.0005, and ****  < 0.0001. Scale bar is 200 µm.
Figure 4
Figure 4
Smed-PARP-3 is required for anterior-specific blastema formation. (A) Regeneration time course injection and amputation scheduled. (B) Graphic depicting sites of amputation. Animals were severed 23 dpfi, both above and below the pharynx resulting in the head, trunk, and regenerative tail fragments. (C) Measurements of the regenerative blastema area 7 dpa relative to the whole fragment area. (D) Representative live images of 7 dpa regenerative trunk fragments for the control and RNAi group. Below, are tracings of both anterior and posterior blastemas. Results show a significant decrease in anterior facing blastema areas of Smed-PARP-3(RNAi) animals (red bracket). (E) Blastema area for double and triple RNAi showing that Smed-PARP-3(RNAi) involvement stunts anterior blastema growth. (CE) Data represents the pooling of fragments capable of regenerating head blastemas (i.e., anterior facing trunk fragment and tail fragment) and tail blastema are a pooling both the tail formation of the trunks and head fragments (reference Figure 4B). Single RNAi experiments were conducted in four independent biological replicates containing a total of 32 animals per RNAi group. As for the double and triple RNAi experiments, data represent two biological replicates resulting in a total of 16 individual amputations per condition. Graphs represent mean ± SEM of all the pooled head, trunk and tail fragments unless otherwise specified. Statistics were obtained by two-way ANOVA; ns: no significance, * < 0.05, **  < 0.001, and ***  < 0.0005. Scale bar is 200 µm.
Figure 5
Figure 5
Smed-PARP-3(RNAi) alters cell death patterns during planarian regeneration. (A) Gene expression levels of Smed-PARP-1, -2, and -3 (i.e., green, orange, and blue, respectively). Data is derived from RNA sequencing conducted during anterior or posterior regeneration time course [47]. Notice that Smed-PARP-3 expression is elevated during the first 24 hpa known as the generic wound response. (B) TUNEL positive foci quantified 4 hpa, where a localized cell death response is established at the wound site. (C) Quantification of the system-wide mitotic burst 6 hpa showing no significant change in events. (D) The graph represents cell death within the regenerative response 48 hpa, reveling a significant decline in the system-wide death response in Smed-PARP-3(RNAi) animals. (E) Results of mitotic events during the localized wave of proliferation seen at 48 hpa. (F) Representative images of cell death within regenerating trunk fragments 48 hpa. TUNEL positive cells found system-wide in the regenerating trunk fragment of the control group; however, Smed-PARP-3(RNAi) animals seem to have a posterior-specific accumulation of cell death. (G) Intensity readings of TUNEL positive foci in regenerating trunks 48 hpa depicting the biased cell death response found in Smed-PARP-3(RNAi) animals. RNAi experiments were conducted in three independent biological replicates containing a total of 24 animals per RNAi group. Graphs represent mean ± SEM of all the pooled head, trunk and tail fragments unless otherwise specified. Statistics were obtained by two-way ANOVA; ns: no significance, * < 0.05, ** < 0.001, *** < 0.0005, and **** < 0.0001. Scale bar 200 µm.
Figure 6
Figure 6
Smed-PARP-3 expression is required for neural differentiation during regeneration. (A) Quantification of mitotic events seven-days post amputation show no significant alterations for regenerating Smed-PARPs relative to the control. (B) Seven-day regenerating trunk fragments stained with antibodies specific for planarian brain/ventral nerve cords and eye cup pigmentation (i.e., SYNORF1 and VC-1, respectively). Images are representative of the three categories used to quantify PARylation effect on differentiation during regeneration (e.g., two eyes, one eye or Cyclops, and no eyes). (C) Quantification of the percent of animals exhibiting a specific eye phenotype. (D) Violin plots depicting the distributing of the length between the two eye pigments 7 dpa. The average lengths: 1.25 ± 0.75 mm, 1.44 ± 0.87 mm, and 1.34 ± 0.95 mm with Smed-PARP-3(RNAi) animals were containing the smallest mean distance of 0.56 ± 0.79 mm. (E) Percent of the animals containing brain deformities 7 dpa. (F) Expression values (normUM) of Smed-PARP-1, -2, and -3 during a regeneration time course for the neural lineage tree derived from the single-cell transcriptome planarian atlas [49]. Notice that expression levels for Smed-PARP-3 are elevated in the neural lineages specific to Cav-1+, GABA, and ChAT#1, required for proper central nervous system development. (G) qPCR analysis of gene expression from four-day regenerating tail fragments (e.g., anterior regeneration). Expression levels for differentiated tissues targeting eye tissues (i.e., Smed-OVO and Smed-Tyrosinase) and central nervous system/neural peptides (i.e., Smed-PC2, -ChAT(cholinergic), -GAD(GABAergic), -TPH(Dopaminergic), -TH(Serotonergic), and -TBH(Octopaminergic)) were assessed for Smed-PARP-1, -2, and -3(RNAi) regenerating tail fragments. Gene expression values are relative to the internal control clone H.55.12e. RNA extractions consisted of greater than 10 animals per group. (BD) Neural phenotype experiments are an average of three biologically independent experiments resulting in a pool of 24 amputated animals per group. Graphs represent mean ± SEM of the pooled trunk and tail fragments unless otherwise specified. Scale bar is 200 µm.

Similar articles

Cited by

References

    1. Gupte R., Liu Z., Kraus W.L. PARPs and ADP-ribosylation: Recent advances linking molecular functions to biological outcomes. Genes Dev. 2017;31:101–126. doi: 10.1101/gad.291518.116. - DOI - PMC - PubMed
    1. Juarez-Salinas H., Levi V., Jacobson E.L., Jacobson M.K. Poly(ADP-ribose) has a branched structure in vivo. J. Biol. Chem. 1982;257:607–609. - PubMed
    1. Tanuma S., Kanai Y. Poly(ADP-ribosyl)ation of chromosomal proteins in the HeLa S3 cell cycle. J. Biol. Chem. 1982;257:6565–6570. - PubMed
    1. Wang Y., Kim N.S., Haince J.F., Kang H.C., David K.K., Andrabi S.A., Poirier G.G., Dawson V.L., Dawson T.M. Poly(ADP-ribose) (PAR) binding to apoptosis-inducing factor is critical for PAR polymerase-1-dependent cell death (parthanatos) Sci. Signal. 2011;4:ra20. doi: 10.1126/scisignal.2000902. - DOI - PMC - PubMed
    1. Wei H., Yu X. Functions of PARylation in DNA Damage Repair Pathways. Genomics Proteomics Bioinformatics. 2016;14:131–139. doi: 10.1016/j.gpb.2016.05.001. - DOI - PMC - PubMed

MeSH terms