. 2020 Feb 19;11(4):508-514.
doi: 10.1021/acschemneuro.0c00006. Epub 2020 Feb 6.

Dissociated Hippocampal Neurons Exhibit Distinct Zn2+ Dynamics in a Stimulation-Method-Dependent Manner

Affiliations

Dissociated Hippocampal Neurons Exhibit Distinct Zn2+ Dynamics in a Stimulation-Method-Dependent Manner

Lynn Sanford et al. ACS Chem Neurosci. .

Abstract

Ionic Zn2+ has increasingly been recognized as an important neurotransmitter and signaling ion in glutamatergic neuron pathways. Intracellular Zn2+ transiently increases as a result of neuronal excitation, and this Zn2+ signal is essential for neuron plasticity, but the source and regulation of the signal is still unclear. In this study, we rigorously quantified Zn2+, Ca2+, and pH dynamics in dissociated mouse hippocampal neurons stimulated with bath application of high KCl or glutamate. While both stimulation methods yielded Zn2+ signals, Ca2+ influx, and acidification, glutamate stimulation induced more sustained high intracellular Ca2+ and a larger increase in intracellular Zn2+. However, the stimulation-induced pH change was similar between conditions, indicating that a different cellular change is responsible for the stimulation-dependent difference in Zn2+ signal. This work provides the first robust quantification of Zn2+ dynamics in neurons using different methods of stimulation.

Keywords: Zinc imaging; calcium imaging; hippocampal culture; neurotransmitters; pH imaging; signaling.


Conflict of interest statement

The authors declare no competing financial interest.

Figures

Figure 1.
Figure 1.
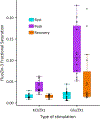
Measurement of stimulation-dependent intracellular Zn2+ responses with FluoZin-3 AM. (A) Representative FluoZin-3 intensities upon different stimulations. Each graph shows a single experiment using a different stimulation. Each trace represents the average intensity within a different cell. Experiments consisted of stimulation (blue box), followed by a period of recovery before addition of 10 μM TPA (red box) and 10 μM ZnCl2/0.5 μM pyrithione (yellow box) for sensor calibration (see Methods). (B) Box/dotplot of measured FluoZin-3 fractional saturation (FS) in different stimulation conditions. Each dot represents values obtained from an ROI in a single cell. KCl/Zn2+, Glu/Zn2+, and Glu/TPA cells were stimulated in the presence of 10 μM ZnCl2 or 10 μM TPA. Rest values represent FS before stimulation, peak values represent the maximal FS obtained during or directly after stimulation, and recovery values represent FS before addition of TPA for calibration. Sample sizes: KCl = 31 cells from 7 separate experiments; KCl/Zn2+ = 31 cells from 9 separate experiments; Glu = 46 cells from 10 separate experiments; Glu/Zn2+ = 39 cells from 8 separate experiments; Glu/TPA = 40 cells from 8 separate experiments.
Figure 2.
Figure 2.
Measurement of stimulation-dependent intracellular Zn2+ responses in the presence of 20 μM Zn2+ chelator ZX1. Data are shown in a box/dot plot with each dot representing a value obtained from an ROI in a single cell. Rest values represent fractional saturation (FS) before ZX1 addition, peak values represent maximal FS obtained during or directly after stimulation, and recovery values represent FS before addition of TPA for calibration. Sample sizes: KCl/ZX1 = 15 cells from 2 separate experiments; Glu/ZX1 = 15 cells from 2 separate experiments.
Figure 3.
Figure 3.
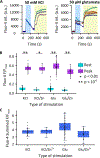
Measurement of stimulation-dependent intracellular Ca2+ responses with Fluo-4 AM. (A) Representative Fluo-4 intensities upon stimulation with 50 mM KCl (left) or 50 μM glutamate (right). Each trace represents the average intensity within a different cell. Experiments consisted of stimulation (blue box), followed by washout and addition of 5 mM CaCl2/5 μM ionomycin (yellow box) to achieve maximum Fluo-4 signal. (B) Box/dotplot of normalized Fluo-4 fluorescence in different stimulation conditions. Each dot represents values obtained from an ROI in a single cell. KCl/Zn2+ and Glu/Zn2+ cells were stimulated in the presence of 10 μM ZnCl2. Rest values represent F/Fmax before stimulation, and peak values represent the maximal F/Fmax obtained during stimulation. Sample sizes: KCl = 28 cells from 8 separate experiments; KCl/Zn2+ = 10 cells from 2 separate experiments; Glu = 57 cells from 8 separate experiments; Glu/Zn2+ = 24 cells from 3 separate experiments. Significance between resting and peak values was assessed with a two-sided Wilcox Signed Rank test for paired data using all data points in each condition (KCl: p=7.5e-9, KCl/Zn2+: p=0.002, Glu: p=5.3e-11, Glu/Zn2+: p=1.2e-7). (C) Box/dotplot of summed Fluo-4 fluorescence in different stimulation conditions, as determined by summing all F/Fmax values for the 2 minute stimulation period. Cell ROIs and F/Fmax values are from the same cells as used in part B.
Figure 4.
Figure 4.
Measurement of stimulation-dependent intracellular pH responses with BCECF AM. (A) Example traces of fluorescence detected upon excitation with a 445 nm (left) or 488 nm (right) laser. Each trace represents the average intensity within a different cell. Experiments consisted of stimulation (blue box), followed by a period of recovery before addition of buffered pH media/10 μM nigericin (orange box) for calibration. Calibration pH media of the example is at pH 6.4. (B) Ratio of signals (488/445) from the same cells as in part A. Note the ratios converge upon pH 6.4/nigericin treatment. (C) Calibration curve relating BCECF ratio to equilibrated pH, obtained on a single day of experiments. Each dot represents one cell, and 1–2 experiments comprise each pH point. (D) Box/dotplot of pH across stimulation conditions, as calculated from each individual cell BCECF ratio via the same-day pH calibration curve. Each dot represents values obtained from an ROI in a single cell. Rest values represent pH before stimulation, stimulation minimum values represent the minimal pH obtained during or directly after stimulation, and recovery values represent the pH before addition of pH buffer/nigericin for calibration. Sample sizes: KCl = 71 cells from 7 separate experiments; KCl/Zn2+ = 63 cells from 7 separate experiments; Glu = 68 cells from 8 separate experiments; Glu/Zn2+ = 58 cells from 6 separate experiments; Glu/TPA = 58 cells from 7 separate experiments. Significance between resting and stimulation minimum values was assessed with a two-sided Wilcox Signed Rank test for paired data with all data points in each condition, ***p < 10−10 (KCl: p=3.3e-13, KCl/Zn2+: p=1.4e-11, Glu: p=7.8e-13, Glu/Zn2+: p=3.8e-11, Glu/TPA: p=3.6e-11).

Similar articles

Cited by

References

    1. Andreini C; Banci L; Bertini I; Rosato A Counting the Zinc-Proteins Encoded in the Human Genome. J. Proteome Res 2006, 5 (1), 196–201. - PubMed
    1. Yao S; Flight RM; Rouchka EC; Moseley HNB A Less Biased Analysis of Metalloproteins Reveals Novel Zinc Coordination Geometries. Proteins 2015, 83 (8), 1470–87. - PMC - PubMed
    1. Levaot N; Hershfinkel M How Cellular Zn2+ Signaling Drives Physiological Functions. Cell Calcium 2018, 75, 53–63. - PubMed
    1. Claiborne BJ; Rea MA; Terrian DM Detection of Zinc in Isolated Nerve Terminals Using a Modified Timm’s Sulfide-Silver Method. J. Neurosci. Methods 1989, 30 (1), 17–22. - PubMed
    1. Frederickson CJ; Danscher G Zinc-Containing Neurons in Hippocampus and Related CNS Structures. Prog. Brain Res 1990, 83, 71–84. - PubMed

Publication types