Observational Study
. 2020 Apr;295(1):218-226.
doi: 10.1148/radiol.2020191429. Epub 2020 Feb 4.

Five-year Progression of Emphysema and Air Trapping at CT in Smokers with and Those without Chronic Obstructive Pulmonary Disease: Results from the COPDGene Study

Affiliations
Observational Study

Five-year Progression of Emphysema and Air Trapping at CT in Smokers with and Those without Chronic Obstructive Pulmonary Disease: Results from the COPDGene Study

Esther Pompe et al. Radiology. 2020 Apr.

Abstract

Background CT is used to quantify abnormal changes in the lung parenchyma of smokers that might overlap chronic obstructive pulmonary disease (COPD), but studies on the progression of expiratory air trapping in smokers are scarce. Purpose To evaluate the relationship between longitudinal changes in forced expiratory volume in 1 second (FEV1) and CT-quantified emphysema and air trapping in smokers. Materials and Methods Cigarette smokers with and those without COPD participating in the multicenter observational COPDGene study were evaluated. Subjects underwent inspiratory and expiratory chest CT and spirometry at baseline and 5-year follow-up. Emphysema was quantified by using adjusted lung density (ALD). Air trapping was quantified by using mean lung density at expiratory CT and CT-measured functional residual capacity-to-total lung volume ratio. Linear models were used to regress quantitative CT measurements taken 5 years apart, and models were fit with and without adding FEV1 as a predictor. Analyses were stratified by Global Initiative for Chronic Obstructive Lung Disease (GOLD) stage (GOLD 0, no COPD; GOLD 1, mild COPD; GOLD 2, moderate COPD; GOLD 3, severe COPD; GOLD 4, very severe COPD). Subjects with preserved FEV1-to-forced vital capacity ratio and reduced FEV1 percentage predicted were categorized as having preserved ratio impaired spirometry (PRISm). Results A total of 4211 subjects (503 with PRISm; 2034 with GOLD 0, 388 with GOLD 1, 816 with GOLD 2, 381 with GOLD 3, 89 with GOLD 4) were evaluated. ALD decreased by 1.7 g/L (95% confidence interval [CI]: -2.5, -0.9) in subjects with GOLD 0 at baseline and by 5.3 g/L (95% CI: -6.2, -4.4) in those with GOLD 1-4 (P < .001 for both). When adjusted for changes in FEV1, corresponding numbers were -2.2 (95% CI: -3.0, -1.3) and -4.6 g/L (95% CI: -5.6, -3.4) (P < .001 for both). Progression in air trapping was identified only in GOLD stage 2-4. Approximately 33%-50% of changes in air trapping in GOLD stages 2-4 were accounted for by changes in FEV1. Conclusion CT measures of emphysema and air trapping increased over 5 years in smokers. Forced expiratory volume in one second accounted for less than 10% of emphysema progression and less than 50% of air trapping progression detected at CT. © RSNA, 2020 Online supplemental material is available for this article.


Figures

None
Graphical abstract
Figure 1:
Figure 1:
Left, Graph shows histograms for inspiratory and expiratory CT based on which emphysema and air trapping measurements are calculated. Emphysema is calculated by using the 15th percentile of the attenuation histogram, which represents the Hounsfield unit value below which 15% of the lowest voxels are distributed. This is converted to adjusted lung density by adding 1000 HU and adjusting for the difference in lung volume between visits 1 and 2. Air trapping was defined by using mean lung density (MLD) at expiratory CT (dotted line), as well as the ratio of CT-derived functional residual reserve to total lung volume. Total lung capacity (TLC) can be calculated by using the area under the inspiratory CT curve. Functional residual capacity (FRC) can be calculated by using the area under the expiratory CT curve. Middle and right, Images show three-dimensional lung volumes of inspiratory and expiratory CT scans, respectively, representing TLC and FRC.
Figure 2:
Figure 2:
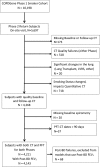
Flowchart shows 4143 subjects were eligible for analyses, including measurement of forced expiratory volume in one second (FEV1). There were 4211 subjects in whom FEV1 was missing who were eligible for analyses including other clinical variables (ie, 6-minute walking distance). BD = bronchodilation, COPD = chronic obstructive pulmonary disease, LVRS = lung volume reduction surgery, PFT = pulmonary function test.
Figure 3:
Figure 3:
Bar graphs show estimated 5-year mean change (visit 2 − visit 1) in, A, adjusted lung density and, B, 15th percentile of the attenuation histogram from the linear mixed models for smokers by Global Initiative for Chronic Obstructive Lung Disease (GOLD) group. Dark gray bars show results without forced expiratory volume in 1 second (FEV1) included in the model; light gray bars, results with FEV1 included in the model; error bars are black. GOLD 0 = no chronic obstructive pulmonary disease (COPD), GOLD 1 = mild COPD, GOLD 2 = moderate COPD, GOLD 3 = severe COPD, GOLD 4 = very severe COPD, PRISm = preserved ratio impaired spirometry.
Figure 4:
Figure 4:
Baseline and follow-up inspiratory CT scans in two smokers show an increase in emphysema (blue areas). A threshold of −950 HU was used to define emphysema. A, Baseline and, B, 5-year follow-up scans in a smoker with Global Initiative for Chronic Obstructive Lung Disease (GOLD) stage 1 disease. Adjusted lung density (ALD) decreased from 66.5 g/L to 49.2 g/L. Forced expiratory volume in 1 second (FEV1) was 3.2 L, and ratio of FEV1 to forced vital capacity (FVC) was 74% at both visits. C, Baseline and, D, 5-year follow-up scans in a smoker with GOLD stage 4 disease. ALD decreased from 74.5 g/L to 59.0 g/L. FEV1 increased from 0.5 L to 0.6 L, but FEV1-to-FVC ratio decreased from 40.3% to 25.7%.
Figure 5:
Figure 5:
Bar graphs show estimated 5-year mean change (visit 2 − visit 1) in, A, ratio of forced residual capacity to total lung volume measured with CT, and, B, mean lung density at expiratory CT from the linear mixed models for smokers by Global Initiative for Chronic Obstructive Lung Disease (GOLD) group. Dark gray bars show results without forced expiratory volume in 1 second (FEV1) included in the model; light gray bars, results with FEV1 included in the model; error bars are black. GOLD 0 = no chronic obstructive pulmonary disease (COPD), GOLD 1 = mild COPD, GOLD 2 = moderate COPD, GOLD 3 = severe COPD, GOLD 4 = very severe COPD, PRISm = preserved ratio impaired spirometry.
Figure 6:
Figure 6:
Baseline and follow-up expiratory CT scans in two smokers show an increase in the amount of air trapping (yellow areas). A threshold of −856 HU was used to define air trapping. A, Baseline and, B, 5-year follow-up scans in a smoker with Global Initiative for Chronic Obstructive Lung Disease (GOLD) 1 disease. Mean lung density at expiratory CT (MLDexp) decreased from −686 HU to −762 HU. Forced expiratory volume in 1 second (FEV1) was 2.4 L and did not change over time. Ratio of FEV1 to forced vital capacity (FVC) changed from 79.2% to 79.3%. C, Baseline and, D, 5-year follow-up CT scans in a smoker with GOLD 4 disease. MLDexp decreased from −769 HU to −816 HU. FEV1 changed from 0.7 L to 0.6 L, and FEV1-to-FVC ratio changed from 27.3% to 30.3%.

References

    1. Singh D, Agusti A, Anzueto A, et al. . Global Strategy for the Diagnosis, Management, and Prevention of Chronic Obstructive Lung Disease: the GOLD science committee report 2019. Eur Respir J 2019;53(5):1900164. - PubMed
    1. Hogg JC. Pathophysiology of airflow limitation in chronic obstructive pulmonary disease. Lancet 2004;364(9435):709–721. - PubMed
    1. Bankier AA, De Maertelaer V, Keyzer C, Gevenois PA. Pulmonary emphysema: subjective visual grading versus objective quantification with macroscopic morphometry and thin-section CT densitometry. Radiology 1999;211(3):851–858. - PubMed
    1. Müller NL, Staples CA, Miller RR, Abboud RT. “Density mask”. An objective method to quantitate emphysema using computed tomography. Chest 1988;94(4):782–787. - PubMed
    1. Madani A, Van Muylem A, de Maertelaer V, Zanen J, Gevenois PA. Pulmonary emphysema: size distribution of emphysematous spaces on multidetector CT images--comparison with macroscopic and microscopic morphometry. Radiology 2008;248(3):1036–1041. - PubMed

Publication types