. 2020 Feb 3;21(1):23.
doi: 10.1186/s13059-019-1908-8.

Host-associated microbiomes are predicted by immune system complexity and climate

Affiliations

Host-associated microbiomes are predicted by immune system complexity and climate

Douglas C Woodhams et al. Genome Biol. .

Erratum in

Abstract

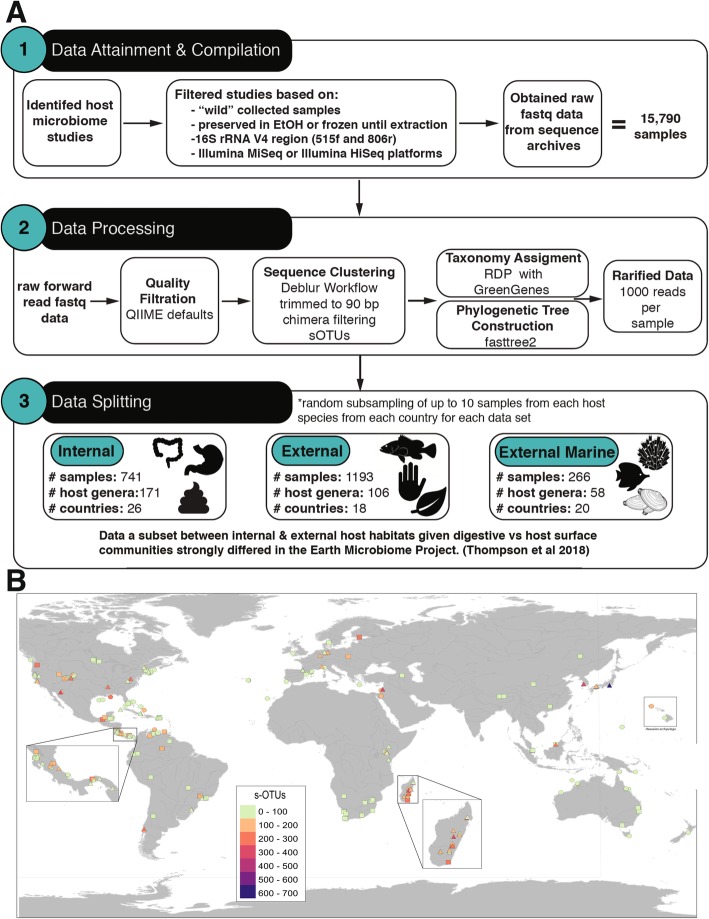
Background: Host-associated microbiomes, the microorganisms occurring inside and on host surfaces, influence evolutionary, immunological, and ecological processes. Interactions between host and microbiome affect metabolism and contribute to host adaptation to changing environments. Meta-analyses of host-associated bacterial communities have the potential to elucidate global-scale patterns of microbial community structure and function. It is possible that host surface-associated (external) microbiomes respond more strongly to variations in environmental factors, whereas internal microbiomes are more tightly linked to host factors.

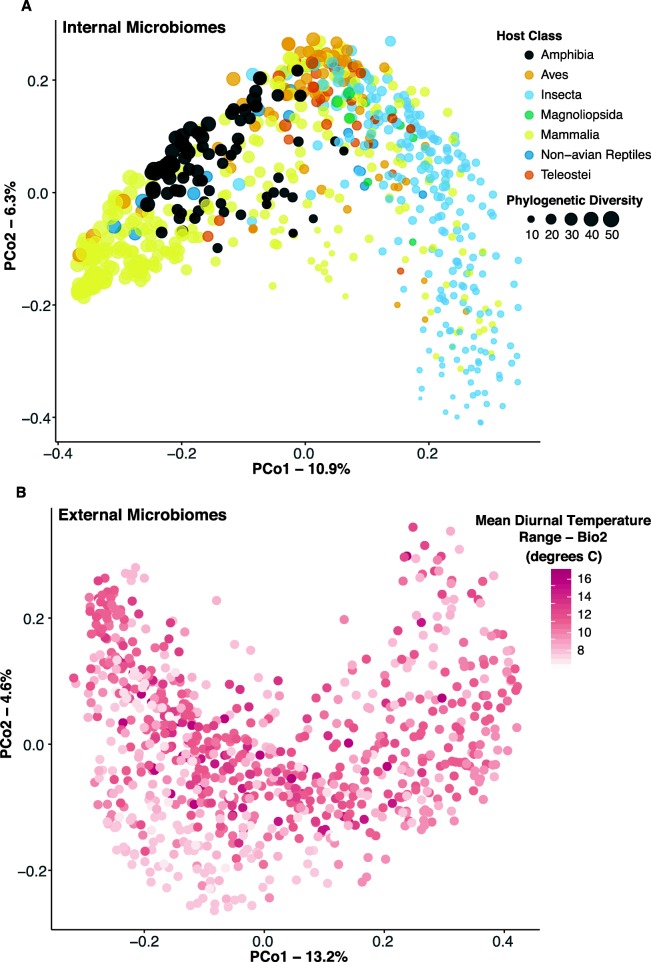
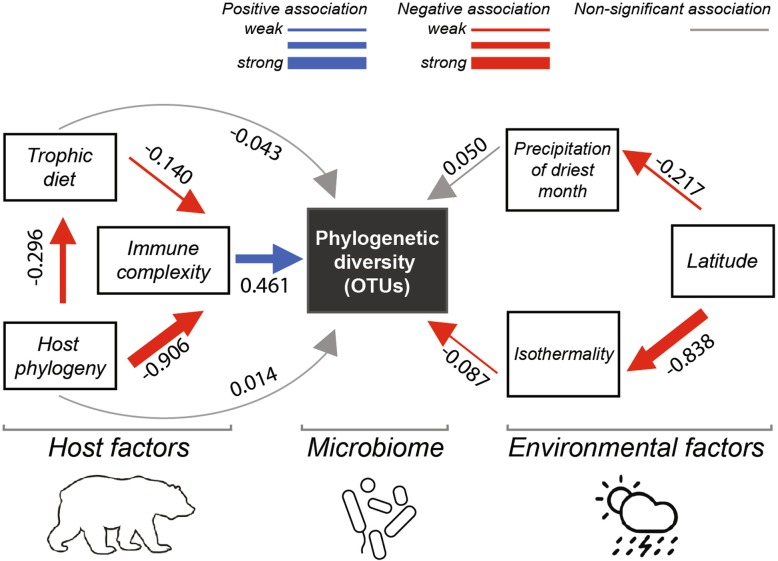
Results: Here, we use the dataset from the Earth Microbiome Project and accumulate data from 50 additional studies totaling 654 host species and over 15,000 samples to examine global-scale patterns of bacterial diversity and function. We analyze microbiomes from non-captive hosts sampled from natural habitats and find patterns with bioclimate and geophysical factors, as well as land use, host phylogeny, and trophic level/diet. Specifically, external microbiomes are best explained by variations in mean daily temperature range and precipitation seasonality. In contrast, internal microbiomes are best explained by host factors such as phylogeny/immune complexity and trophic level/diet, plus climate.

Conclusions: Internal microbiomes are predominantly associated with top-down effects, while climatic factors are stronger determinants of microbiomes on host external surfaces. Host immunity may act on microbiome diversity through top-down regulation analogous to predators in non-microbial ecosystems. Noting gaps in geographic and host sampling, this combined dataset represents a global baseline available for interrogation by future microbial ecology studies.

Keywords: Biodiversity; Gut microbiome; Microbial ecology; Skin microbiome; Symbiosis; Wolbachia.


Conflict of interest statement

The authors declare that they have no competing interests.

Figures

Fig. 1
Fig. 1
Method schematic and geographic distribution of samples analyzed. a Method schematic for data attainment and compilation, data processing, and data splitting into three distinct subsets for subsequent analyses. b Map of the coverage of samples included in this study. Three types of host microbiome samples are represented: internal (squares), external (triangles), and marine external (circles). Sampling points are color-scaled by sub-Operational Taxonomic Unit (sOTU) richness. Areas with small territory size (such as Central America and Hawaiian Archipelago) and many sampling points with different types of samples (Madagascar) are shown zoomed-in in separate boxes. Map created with QGIS (Quantum GIS Development Team 2013) using a base global map from Natural Earth (naturalearthdata.com) with all geographic coordinates standardized to decimal degrees
Fig. 2
Fig. 2
Trends in published host-microbiome studies through time. Data based on a custom keyword statements within NCBI PubMed
Fig. 3
Fig. 3
Phylogenetic tree of selected eukaryotic hosts at the class level. Numbers adjacent to black circles indicate the number of species included in our dataset from that class. Groups’ missing microbiome data are evident; however, only studies focusing on the V4 region of the rRNA gene were included. Tree was retrieved from TimeTree (http://www.timetree.org), which aggregates taxonomic and phylogenetic information from published literature. Interact with this tree at IToL: https://itol.embl.de/tree/1306494203341921544122745
Fig. 4
Fig. 4
Taxonomic and function composition of host microbial communities across host classes and microbial habitats. a Internal microbiomes of terrestrial and freshwater organisms, b external microbiomes of terrestrial and freshwater organisms, and c external microbiomes of marine organisms. Each color represents a unique bacterial phylum. A legend for microbial taxa including bacterial phyla and Archaea is provided
Fig. 5
Fig. 5
Path analyses showing direct and indirect effects of the best abiotic and biotic predictors of number of sOTUs (left) and phylogenetic diversity (right). Models explaining internal (a), and external microbiome diversity (b) are shown. Numbers are standardized path coefficients (*P < 0.05). Blue arrows depict positive associations whereas red arrows depict negative effects. Gray arrows depict non-significant paths. The thickness of the arrows represents the relative strength of each relationship. Bioclimatic variables include the following: Isothermality (Bio3), Mean Temperature of Driest Quarter (Bio9), Precipitation of Driest Month (Bio14), and Precipitation of Warmest Quarter (Bio18)
Fig. 6
Fig. 6
Principal coordinates analysis of Unifrac distances. a Internal microbiomes, colored by host class, and size-scaled by microbial phylogenetic diversity. Host class explained 13.9% of the variation in community structure (Additional file 1: Table S2). b External microbiomes, color scale white-red corresponding to low-high Mean Diurnal Temperature Range (Bio2; Mean of monthly (max temp–min temp)). Bio2 explained 59.6% of the variation in external microbiome community structure (Additional file 1: Table S2)
Fig. 7
Fig. 7
Bacterial abundance across trophic diets. a Phylogenetic tree of major bacterial phyla and their abundance by trophic diet for internal microbiota. The size of the circle depicts the proportion of a given bacterial group within the community by the trophic diet. b Abundance of major bacterial classes of selected bacterial phyla across trophic diet for internal microbiota
Fig. 8
Fig. 8
Immune system complexity associations with diversity of host microbiomes. a Mean richness and phylogenetic diversity (external and internal microbiomes) for host genera with adaptive immune systems is significantly greater than host genera with only innate immunity. *P < 0.001, Wilcoxon tests. b Mean internal sOTU richness correlates with adaptive immune system complexity based on the Flajnik [68] comparative immunology scale (see Additional file 1: Table S3)
Fig. 9
Fig. 9
Path model of internal microbiomes depicting direct and indirect effects of immune complexity in the context of the best biotic and abiotic predictors of microbial phylogenetic diversity. Numbers are standardized path coefficients. Blue arrows depict positive associations whereas red arrows depict negative effects at P < 0.05. Gray arrows depict non-significant paths. The thickness of the arrows represents the relative strength of each relationship
Fig. 10
Fig. 10
Wolbachia in insects are globally diverse and decrease in abundance with temperature range. Maximum temperature of the warmest month (Bioclim5) and mean diurnal temperature range (Bioclim2) negatively predict relative Wolbachia abundance in samples derived from insects. Blue lines indicate 95% confidence limits. Details can be found in Additional file 1: Figure S8. This is one example of how this global microbiome dataset can be used to better understand and analyze host-microbe interactions

References

    1. McFall-Ngai M. Care for the community. Nature. 2007;445:153. doi: 10.1038/445153a. - DOI - PubMed
    1. Fierer N, Jackson RB. The diversity and biogeography of soil bacterial communities. Proc Natl Acad Sci U S A. 2006;103:626–631. doi: 10.1073/pnas.0507535103. - DOI - PMC - PubMed
    1. Lozupone CA, Knight R. Global patterns in bacterial diversity. Proc Natl Acad Sci U S A. 2007;104:11436–11440. doi: 10.1073/pnas.0611525104. - DOI - PMC - PubMed
    1. Thompson L, Sanders J, McDonald D, Amir A, Ladau J, Locey K, et al. A communal catalogue reveals Earth’s multiscale microbial diversity. Nature. 2017;551:457. doi: 10.1038/nature24621. - DOI - PMC - PubMed
    1. Kueneman JG, Bletz MC, Mckenzie VJ, Becker CG, Joseph MB, Abarca JG, et al. Community richness of amphibian skin bacteria correlates with bioclimate at the global scale. Nat Ecol Evol. 2019;3:381–389. doi: 10.1038/s41559-019-0798-1. - DOI - PubMed

Publication types

LinkOut - more resources