. 2020 Feb:52:102645.
doi: 10.1016/j.ebiom.2020.102645. Epub 2020 Feb 1.

A peptide derived from the core β-sheet region of TIRAP decoys TLR4 and reduces inflammatory and autoimmune symptoms in murine models

Affiliations

A peptide derived from the core β-sheet region of TIRAP decoys TLR4 and reduces inflammatory and autoimmune symptoms in murine models

Asma Achek et al. EBioMedicine. 2020 Feb.

Erratum in

Abstract

Background: TLRs are some of the actively pursued drug-targets in immune disorders. Owing to a recent surge in the cognizance of TLR structural biology and signalling pathways, numerous therapeutic modulators, ranging from low-molecular-weight organic compounds to polypeptides and nucleic acid agents have been developed.

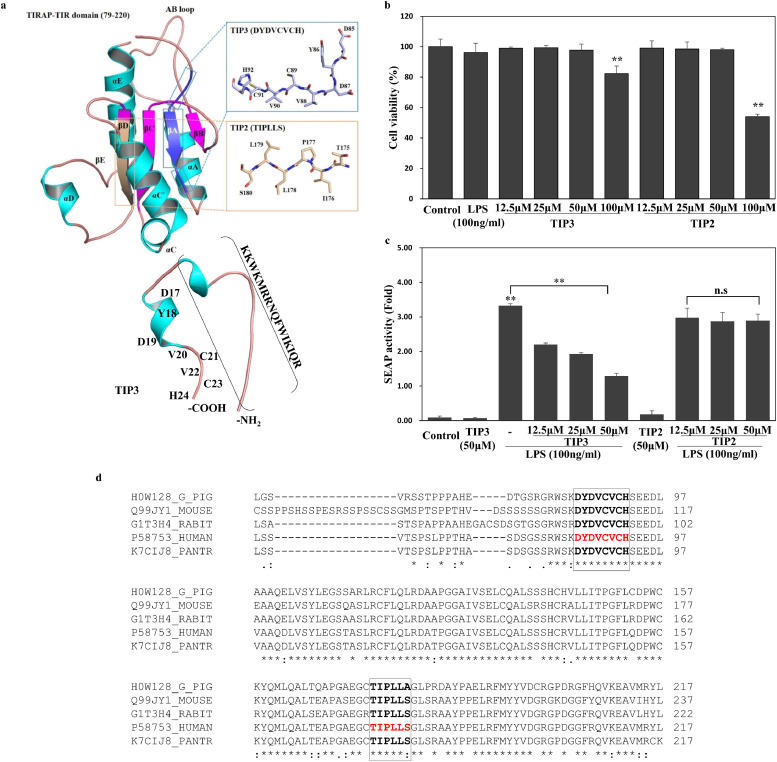
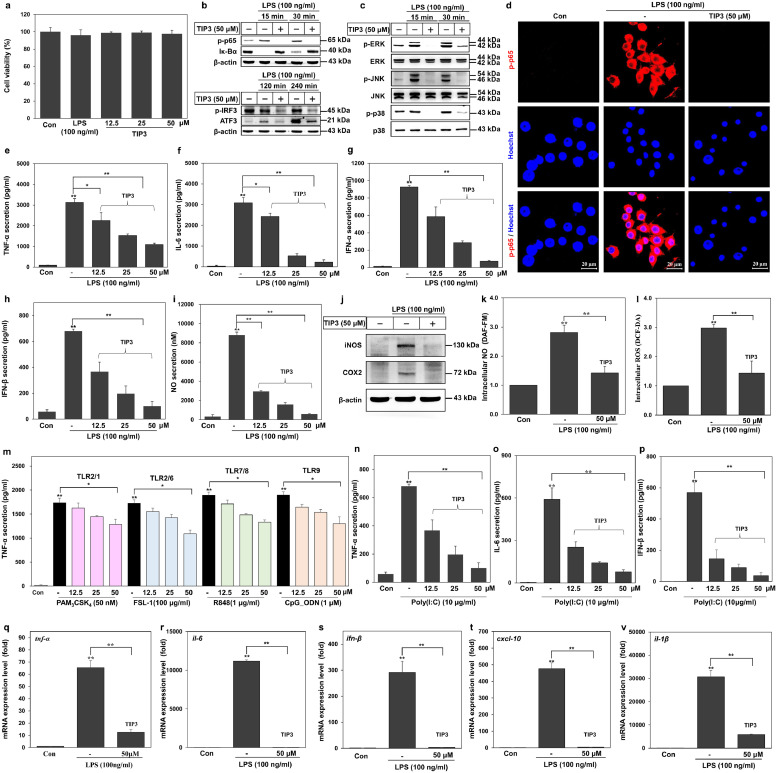
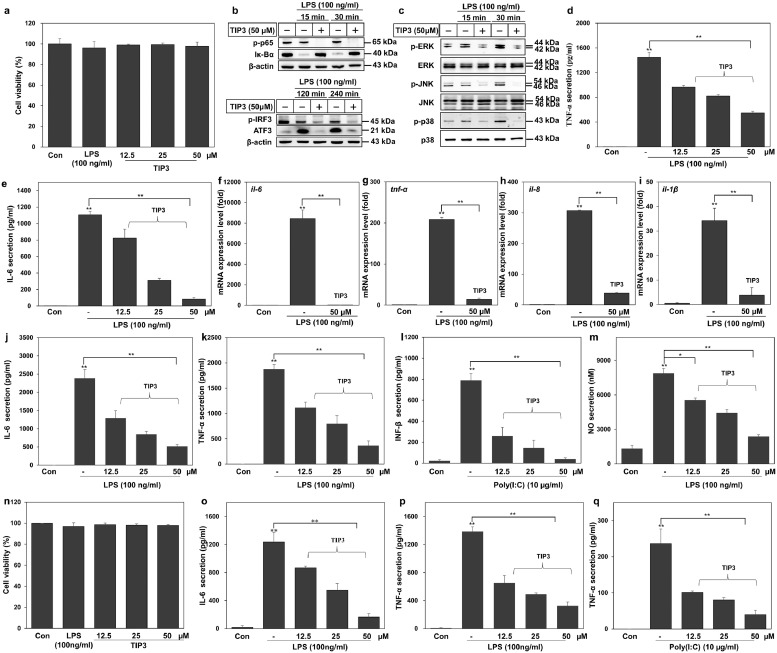
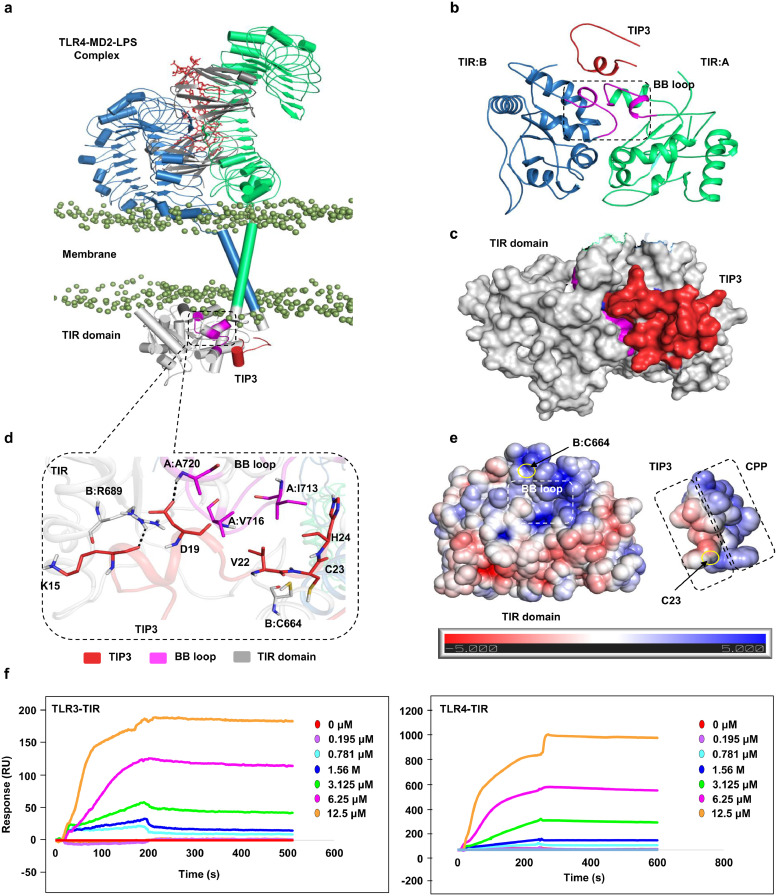
Methods: A penetratin-conjugated small peptide (TIP3), derived from the core β-sheet of TIRAP, was evaluated in vitro by monitoring the TLR-mediated cytokine induction and quantifying the protein expression using western blot. The therapeutic potential of TIP3 was further evaluated in TLR-dependent in vivo disease models.

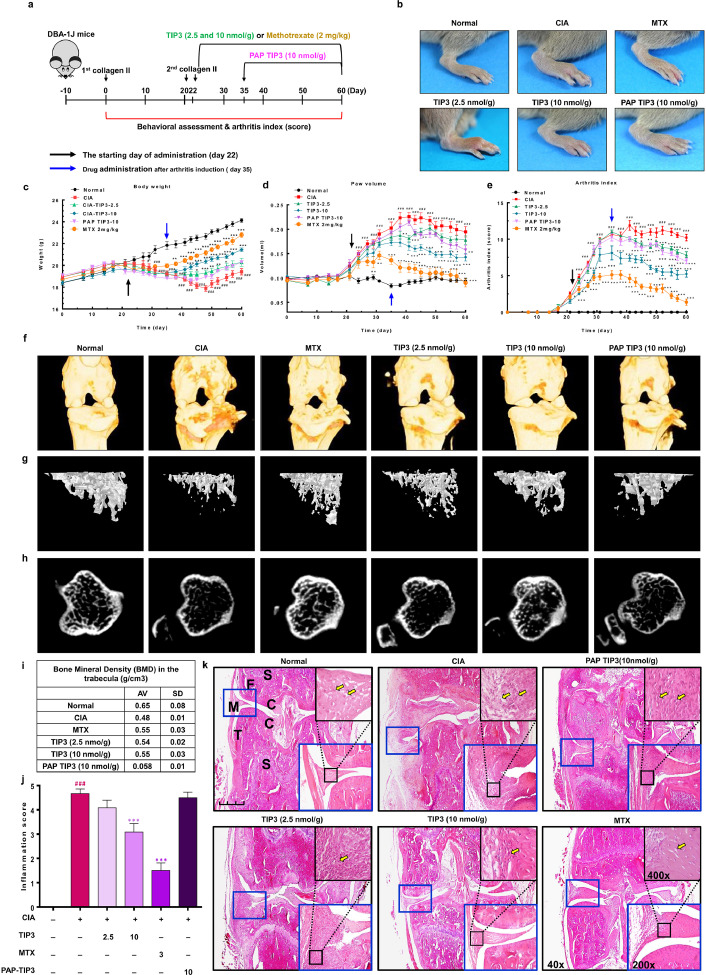
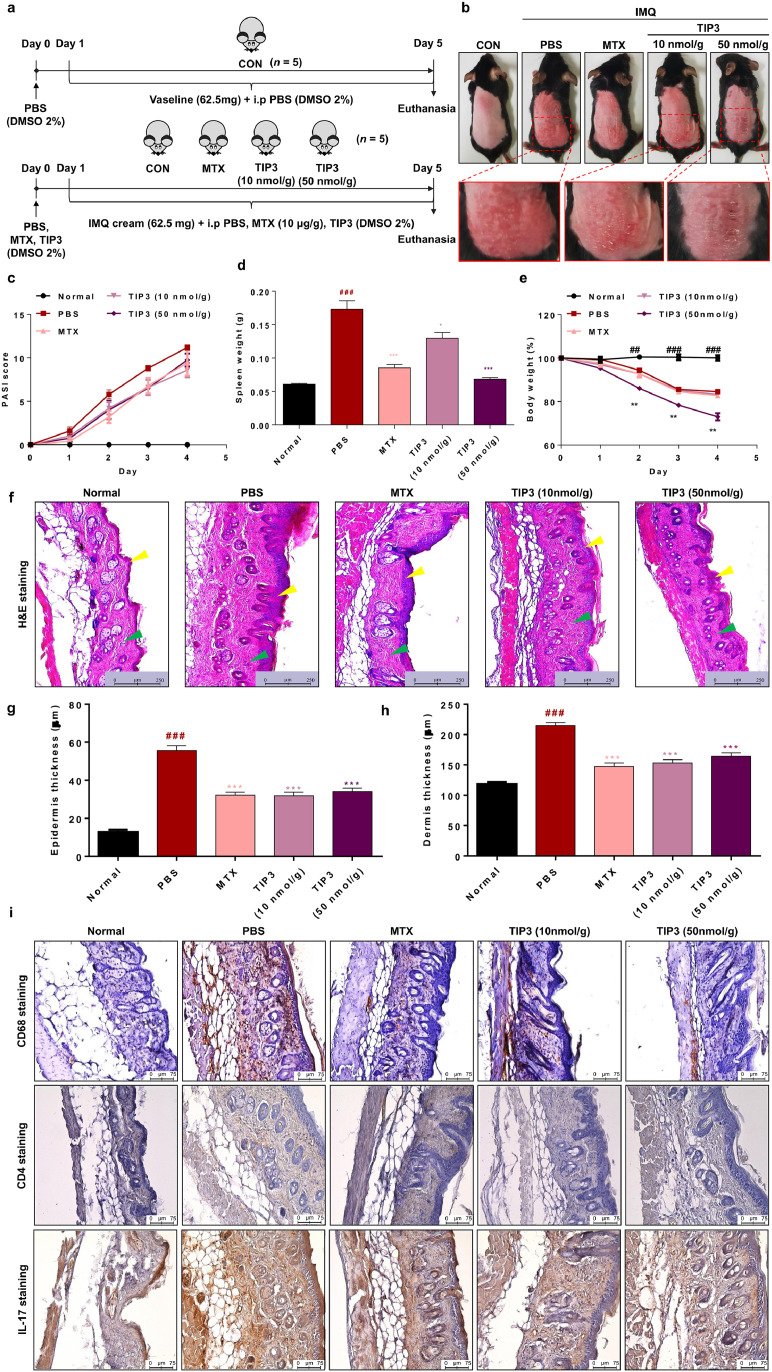
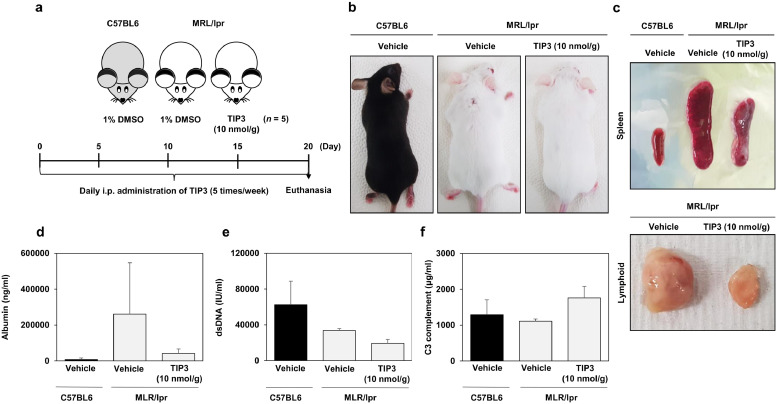
Findings: TIP3 blocks the TLR4-mediated cytokine production through both the MyD88- and TRIF-dependent pathways. A similar inhibitory-effect was exhibited for TLR3 but not on other TLRs. A profound therapeutic effect was observed in vivo, where TIP3 successfully alleviated the inflammatory response in mice model of collagen-induced arthritis and ameliorated the disease symptoms in psoriasis and SLE models.

Interpretation: Our data suggest that TIP3 may be a potential lead candidate for the development of effective therapeutics against TLR-mediated autoimmune disorders.

Funding: This work was supported by the National Research Foundation of Korea (NRF-2019M3A9A8065098, 2019M3D1A1078940 and 2019R1A6A1A11051471). The funders did not have any role in the design of the present study, data collection, data analysis, interpretation, or the writing of the manuscript.

Keywords: Antagonist; Collagen-induced arthritis; Decoy peptide; Psoriasis; Systemic lupus erythematosus; TLR4.


Conflict of interest statement

Declaration of competing interest The authors declare that there are no conflicts of interest.

Figures

Fig 1
Fig. 1
Selection and initial evaluation of the TIRAP-derived TLR-inhibitory peptides. (a) The TLR-inhibitory peptide TIP3 (DYDVCVCH) was selected from the first β-strand βA (blue box). The peptide, TIP2 (TIPLLS), was taken from the βD and served as a negative control. Both peptides were N-terminally fused with a cell-penetrating peptide (CPP) derived from the Drosophila antennapedia homeodomain (KKWKMRRNQFWIKIQR) to facilitate their intracellular delivery. (b) The cell viability assay suggests that TIP3 and TIP2 do not affect the cell viability at ≤ 50 μM. (c) The substantial inhibition of NF-κB activation (measured by the SEAP assay) by TIP3 but not TIP2, was assumed to be the initial hallmark of the TLR-inhibitory capacity of TIP3. (d) Sequence alignment between TIRAP TIR domains from selected species. Only the portion of the alignment that covers TIP2 and TIP3 peptides is shown. The identical residues are indicated by ‘*’, conservative substitutions and semiconservative substitutions are marked with ‘:’ and ‘.’, respectively. The data shown represent at least three independent experiments (n ≥ 3), and bars indicate means ± SEM (*P < 0·05, **P < 0·01) according to two-tailed Student's t-test.
Fig 2
Fig. 2
TIP3 inhibits the signalling pathways of TLRs by downregulating the transcription factors and proinflammatory cytokines. (a) TIP3 was found to be safe at 50 μM for RAW264.7 cells and other cell lines in the subsequent experiments. (b, c) The protein expression levels of p-p65, Iκ-Bα, p-IRF3, ATF3, p-ERK, ERK, p-JNK, JNK, p-p38 and p38 were measured by western blotting of the total-protein extract, where β-actin served as a loading control. (d) Phosphorylation of NF-κB (p-p65) was evaluated by immunofluorescent staining and confocal microscopy. Hoechst was utilised for nucleus staining (the scale bar represents 20 μm). (e–h) Secretion levels of TNF-α, IL-6, IFN-α, and IFN-β were measured by ELISAs. The release of four cytokines was dose-dependently inhibited by TIP3. (i) The NO secretion level was evaluated using a standard NO secretion kit. (j) The expression levels of iNOS and COX2 were measured by western blotting; β-actin served as a loading control. (k, l) Intracellular NO and ROS were quantified by DAF-FM and DCF-DA staining, respectively, and were found to be substantially downregulated by 50 μM TIP3. (m) Inhibitory effects of TIP3 on multiple TLRs were evaluated by measuring the TNF-α level, when cells were activated with PAM3CSK4 (TLR2/1), FSL-1 (TLR2/6), R848 (TLR7/8), or CpG-ODN (TLR9) at various concentrations. These TLRs were not inhibited by TIP3 as significant as by TLR4. The TLR3-inhibitory effect of TIP3 was investigated through the secretion of (n) TNF-α, (o) IL-6, and (p) IFN-β in RAW264.7 cells after their activation by poly (I:C) (TLR3) for 24 h. (q–v) Effects of TIP3 on the LPS-induced mRNA expression levels of Tnf-α, Il-6, Ifn-β, Cxcl-10, and Il-1β after 3 h of treatment. Values are indicated as fold changes (relative quantification; RQ) in mRNA levels, normalized to β-actin. The data shown represent at least three independent experiments (n ≥ 3), and bars denote mean ± SEM (*P < 0·05, **P < 0·01) according to two-tailed Student's t-test.
Fig 3
Fig. 3
Characterisation of the TLR-antagonistic effects of TIP3 on primary cells. (a) TIP3 was found to be safe for THP-1 cells at multiple concentrations (≤ 50 μM) for 24 h. (b, c) The protein expression was measured by western blot analyses using hPBMCs. The amounts of p-p65, Iκ-Bα, p-IRF3, ATF3, p-ERK, ERK, p-JNK, JNK, p-p38 and p38 were evaluated in the total-protein extract. β-Actin served as a loading control. (d, e) The secretion levels of TNF-α and IL-6 were measured by ELISA after the cells were stimulated with LPS and then treated with TIP3. (f–i) The effects of TIP3 on the LPS-induced mRNA expression levels of IL-6, TNF-α, IL-8, and IL-1β after 4 h. The mRNA levels of these genes were substantially downregulated by TIP3. Values are indicated as fold changes (relative quantification; RQ) in mRNA levels, normalized to GAPDH. (j–m) The LPS-stimulated mBMDMs were treated with TIP3 for 1 h and the secretion levels of (j) IL-6 and (k) TNF-α were measured by an ELISA, and (m) the production of NO was evaluated using NO secretion kit. (l) The, IFN-β level was measured in poly(I:C)-stimulated mBMDMs through ELISA. (n-p) The LPS-stimulated hMNCs were also utilized to evaluate the secretion levels of (o) IL-6 and (p) TNF-α by ELISA. (q) The poly (I:C)-stimulated hMNCs were employed to assess the TLR3-inhibitory effect of TIP3 by measuring the TNF-α secretion by an ELISA. Effects similar to those of in RAW264.7 cells were detected. The data shown represent at least three independent experiments (n ≥ 3), and bars denote mean ± SEM (*P < 0·05, **P < 0·01) according to two-tailed Student's t-test.
Fig 4
Fig. 4
The protective effect of TIP3 as evaluated in the mouse model of CIA by monitoring the anatomical and behavioural parameters. (a) An overview of the experimental protocol. The CIA was induced by subcutaneous injection of type II collagen into the mice. The TIP3 treatment was started either after the second injection of collagen (day 22) daily or after the postarthritis phase (PAP) (day 35) daily. Methotrexate served as a positive control. (b) The representative photographs of the paws were taken on day 45, and then magnified features of right hind paws were evaluated. (c–e) The mice were observed and analysed for their (c) body weight, (d) paw volume, and (e) arthritis index. The black and blue arrows indicate two time points of TIP3 treatment, as mentioned in (a). Numerical data are presented as mean ± SEM: #P < 0·05, ##P < 0·01 and ###P < 0·001 CIA versus Normal; *P < 0·05, **P < 0·01 and ***P < 0·001 TIP3 versus CIA. (f) The 3D images of the knee joints were captured by Micro-CT to estimate the joint corrosion and cartilage loss. (g) Representative 2D images of trabecular bone corresponding to the sagittal section at the top of the tibia and (h) cortical bone corresponding to the horizontal section in the middle of the tibia were captured by means of the micro-CT technology. (i) The bone mineral densities (BMDs) of the right or left knee joints were measured by Micro-CT, suggesting that TIP3 (10 nmol/g), similarly to MTX, restores mineral density. (j) The histogram representing quantification of the synovial hyperplasia score, suggesting that prolonged TIP3 treatment substantially reduces inflammation. (k) The histological evaluation of the CIA synovial tissues and the effect of TIP3 treatment. The images were taken at ×40 magnification, and the scale bar is 200 µm in the normal case. The letters have the following meanings: C, cartilage; F, femur; M, meniscus; S, subchondral bone; T, tibia.
Fig 5
Fig. 5
The therapeutic efficacy of TIP3 in the mouse model of psoriasis. (a) The summarized experimental procedure for the therapeutic evaluation of TIP3 in the murine model of psoriasis. The disease was induced in C57BL/6 male mice by the topical application of imiquimod (IMQ). TIP3 was administered i.p. before the IMQ application. Methotrexate (MTX) served as a positive control for the relative therapeutic evaluation of TIP3. (b) Photographs of back skin on day 4, indicating the therapeutic effect of TIP3 relative to the untreated and MTX treated groups. (c) Scoring of disease severity based on the clinical Psoriasis Area and Severity Index (PASI). Light and dark purple lines indicate the PASI score of mice treated with TIP3 at 10 and 50 nmol/g, respectively. (d) The influence of TIP3 on spleen weight. (e) Body weight dynamics of mice during the treatment regimen. (f) The effect of TIP3 on the thickness of the epidermis (yellow arrowheads) and dermis (green arrowheads). (g, h) The thickness of the skin in each group was measured with the Leica DMi8 fluorescence microscope. (i) Immunohistochemical analysis of the back skin lesions in each group. The scale bar is 75 μm for high-magnification images. Data represent mean ± SEM from five skin tissue samples from each group. ###P < 0·001 between NC and PBS, *P < 0·05, **P < 0·01 between PBS and TIP3 at 10 or 50 nmol or MTX, according to two-tailed Student's t-test.
Fig 6
Fig. 6
The promising inhibitory effect of TIP3 on SLE in a mouse model. (a) A summary of the experimental validation of the inhibitory effect of TIP3 on SLE in the mouse model. (b) C57BL6 male mice and lupus-prone mice are shown in the images. (c) The ameliorative effect of TIP3 on lymphoproliferation according to photographs of the spleen and lymph nodes. (d) Albumin content of urine, (e) concentration of anti-dsDNA antibodies, and (f) of the C3 complement component in serum were determined by ELISA. The exact Wilcoxon Rank Sum test (which is numerically equivalent to the Mann–Whitney U test) was performed to compare the mean values between the two groups. *P < 0·05 and **P < 0·01.
Fig 7
Fig. 7
Detailed intermolecular interaction between TIP3 and the TIR domain of TLR4. (a) The overall docked model of TIP3 (red cartoon) with the full-length TLR4 model. Chains A and B of TLR4 are coloured green and blue, respectively. The TLR4 coreceptor, myeloid differentiation factor-2 (MD2), is coloured grey, and LPS is displayed as a red stick model. Phosphate groups (mauve beads) of the phospholipid bilayer are used to indicate the membrane region. The TIR domains are presented as a grey space-fill model, and the BB loop is magenta. (b) A representative docked pose of TIP3 on the TLR4 TIR domain, extracted from panel (a), showing the binding of the peptide to the BB loop surface of the TIR domain. (c) Surface view of TIP3 (red) bound to the TIR domain (grey) of TLR4. (d) Detailed view of the interaction between TIP3 residues with those of the TLR4 TIR domain. TIP3 residues are red, TIR residues are grey, and BB loop residues are magenta. Residues of the B chain of TLR4 are indicated by “B” followed by the residue number. (e) The electrostatic potential surface of the TLR4 TIR domain and TIP3 peptide. The BB loop region of the TIR domain, the CPP, and the bioactive segment of TIP3 peptide are indicated with dashed boxes. C664 of the TIR domain and C23 of TIP3, which may form an intermolecular disulphide bridge, are marked with a yellow circle. (f) The sensorgram of the potential binding of TIP3 to the TIR domains of TLR3 and TLR4.

References

    1. Kawai T., Akira S. The role of pattern-recognition receptors in innate immunity: update on Toll-like receptors. Nat Immunol. 2010;11(5):373–384. - PubMed
    1. Gay N.J., Gangloff M., Weber A.N. Toll-like receptors as molecular switches. Nat Rev Immunol. 2006;6(9):693–698. - PubMed
    1. O'Neill L.A., Bowie A.G. The family of five: tIR-domain-containing adaptors in Toll-like receptor signalling. Nat Rev Immunol. 2007;7(5):353–364. - PubMed
    1. Gay N.J., Symmons M.F., Gangloff M., Bryant C.E. Assembly and localization of Toll-like receptor signalling complexes. Nat Rev Immunol. 2014;14(8):546–558. - PubMed
    1. Lin S.C., Lo Y.C., Wu H. Helical assembly in the MYD88-IRAK4-IRAK2 complex in TLR/IL-1R signalling. Nature. 2010;465(7300):885–890. - PMC - PubMed

MeSH terms