. 2020:25:102177.
doi: 10.1016/j.nicl.2020.102177. Epub 2020 Jan 12.

Functional and structural connectivity substrates of cognitive performance in relapsing remitting multiple sclerosis with mild disability

Affiliations

Functional and structural connectivity substrates of cognitive performance in relapsing remitting multiple sclerosis with mild disability

Arzu Ceylan Has Silemek et al. Neuroimage Clin. 2020.

Abstract

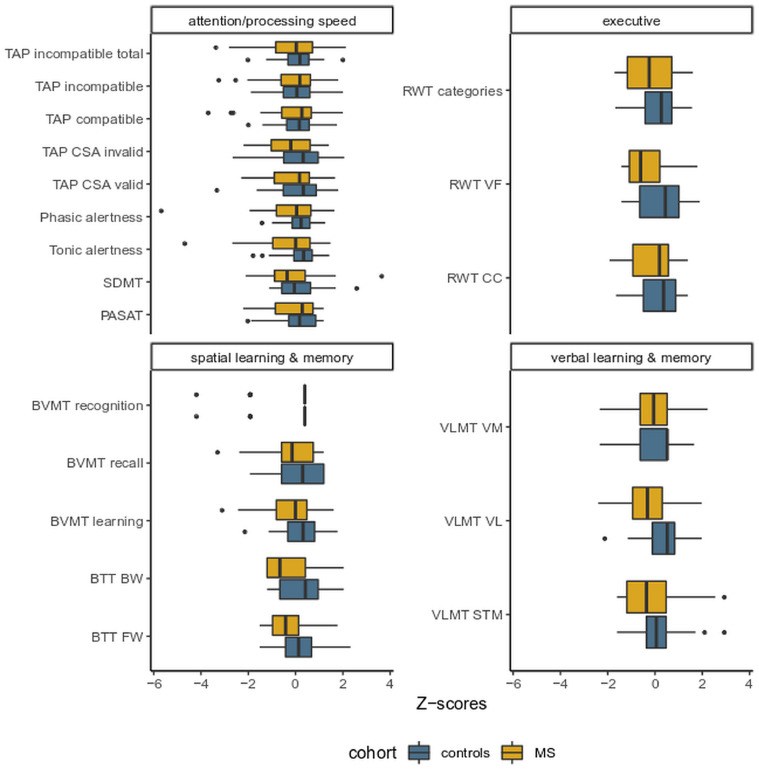
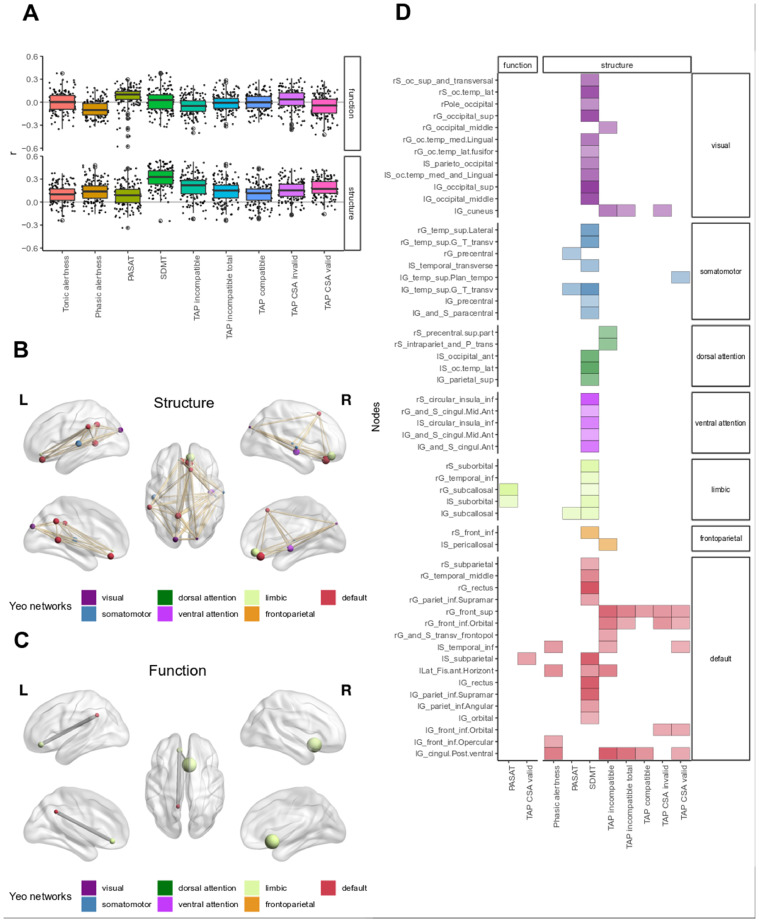
Multiple Sclerosis (MS) is the most common chronic inflammatory and neurodegenerative disease of the central nervous system (CNS), which can lead to severe cognitive impairment over time. Magnetic resonance imaging (MRI) is currently the best available biomarker to track MS pathophysiology in vivo and examine the link to clinical disability. However, conventional MRI metrics have limited sensitivity and specificity to detect direct associations between symptoms and their underlying CNS substrates. In this study, we aimed to investigate structural and resting state functional connectomes and subnetworks associated with neuropsychological (NP) performance using a graph theoretical approach. A comprehensive NP test battery was administered in a sample of patients with relapsing remitting MS (RRMS) and mild disability [n = 33, F/M = 20/13, age = 40.9 ± 9.7, median [Expanded Disability Status Scale] (EDSS) = 2, range =0-4] and compared to healthy controls (HC) [n = 29, F/M = 19/10, age = 41.0 ± 8.5] closely matched for age, sex, and level of education. The NP battery comprised the most relevant domains of cognitive dysfunction in MS including attention, processing speed, verbal and spatial learning and memory, and executive function. While standard MRI metrics showed good correlations with TAP Alertness test, disease duration and neurological exams, structural networks showed closer associations with 9-hole peg test and cognitive performances. Decreased graph strength was associated with two out of the 5 NP tests in the spatial learning and memory domain specified by BVMT [Sum 1-3] and BVMT [Recall], and with also SDMT which is one out of the 9 NP tests in the attention/processing speed domain, while no correlation was found between these scores and functional connectivity. Nodal strength was decreased in all subnetworks based on Yeo atlas in patients compared to HC; however, no difference was observed in nodal level of functional connectivity between the groups. The difference in structural and functional nodal connectivity between the groups was also observed in the relationship between structural and functional connectivity within the groups; the relationship between nodal degree and nodal strength was reversed in patients but positive in controls. On a nodal level, structural and functional networks (mainly the default mode network) were correlated with more than one cognitive domain rather than one specific network for each domain within patients. Interestingly, poorer cognitive performance was mostly correlated with increased functional connectivity but decreased structural connectivity in patients. Increased functional connectivity in the default mode network had both positive as well as negative associations with verbal and spatial learning and memory, possibly indicating adaptive and maladaptive mechanisms. In conclusion, our results suggest that cognitive performance, even in patients with RRMS and very mild disability, may reflect a loss of structural connectivity. In contrast, widespread increases in functional connectivity may be the result of maladaptive processes.

Keywords: Connectivity; Maladaption/adaption, and cognition; Neuropsychology; Relapsing remitting multiple sclerosis.


Figures

Fig. 1
Fig. 1
Figure indicates the effect of the cognitive data presented by Z-scores in Relapsing Remitting Multiple Sclerosis (yellow) and Healthy Controls (blue). Abbreviations: PASAT = Paced Auditory Serial Addition Test; SDMT= Symbol Digit Modalities Test; VLMT = verbal learning memory test; RWT = Regensburger Word Fluency Task; TAP = Test Battery of attentional performance; BVMT= Brief Visuospatial Memory Test. STM = short term memory, VL = verbal learning, VM = verbal memory, FWD = forward, BWD = backward, VF = verbal fluency, CC= category change, CSA = Covert Shift of Attention, incomp total = incompatibility total.(For interpretation of the references to colour in this figure legend, the reader is referred to the web version of this article.)
Fig. 2
Fig. 2
Structural (A) and functional (B) connectivity for each one of seven subnetworks based on the Yeo atlas in patients (yellow) and healthy controls (blue). The correlation of structural (based on the strength) and functional (based on the degree) connectivity for all nodes in each subnetwork (C) in controls (upper side of C) and in patients (lower side of C).(For interpretation of the references to colour in this figure legend, the reader is referred to the web version of this article.)
Fig. 3
Fig. 3
The association of structural / functional networks and attention/processing speed functioning. (A) Boxplot displaying Pearson's correlation coefficients (r) for all nodes and for all tasks in the domain of attention/processing speed. (B + C) BrainViewer plots illustrate the localization of highly correlated (r>=0.4) nodes in the brain. Size represents r, color their location in Yeo networks. (D) Correlogram of highly significant (r>=0.4, p<0.05 after FDR correction) nodes associated with attention/processing speed performances. Nodes are grouped by their location in seven functional networks defined by the Yeo atlas.
Fig. 4
Fig. 4
The association of nodal structural / functional networks and verbal learning and memory functioning. (A) Boxplot displaying Pearson's correlation coefficients (r) for all nodes and for all tasks in the domain of verbal learning and memory. (B + C) BrainViewer plots illustrate the localization of highly correlated (r>=0.4) nodes in the brain. Size represents r, color their location in Yeo networks. (D) Correlogram of highly significant (r>=0.4, p<0.05 after FDR correction) nodes associated with verbal learning and memory performances. Nodes are grouped by their location in seven functional networks defined by the Yeo atlas.
Fig. 5
Fig. 5
The association of structural / functional networks and spatial learning and memory functioning.(A) Boxplot displaying Pearson's correlation coefficients (r) for all nodes and for all tasks in the domain of spatial learning and memory. (B + C) BrainViewer plots illustrate the localization of highly correlated (r>=0.4, p<0.05 after FDR correction) nodes in the brain. Size represents r, color their location in Yeo networks. (D) Correlogram of highly significant (r>=0.4) nodes associated with spatial learning and memory performances. Nodes are grouped by their location in seven functional networks defined by the Yeo atlas.
Fig. 6
Fig. 6
The association of nodal structural / functional networks and executive functioning. (A) Boxplot displaying Pearson's correlation coefficients (r) for all nodes and for all tasks in the domain of executive functioning. (B) Correlogram of highly significant (r>=0.4, p<0.05 after FDR correction) nodes associated with executive functioning performances. Nodes are grouped by their location in five functional networks defined by the Yeo atlas. (C + D) BrainViewer plots illustrate the localization of highly correlated (r>=0.4) nodes in the brain. Size represents r, color their location in Yeo networks.
Fig. 7
Fig. 7
Figure shows the significant correlation coefficients for all nodes, which were related to at least one cognitive test within patients. Direct (r = 0.4) and inverse (r=−0.4) associations of functional (left) and structural (right) connectivity of nodes with overall cognitive performance.

References

    1. Achard S., Delon-Martin C., Vertes P.E., Renard F., Schenck M., Schneider F., Bullmore E.T. Hubs of brain functional networks are radically reorganized in comatose patients. Proc. Natl. Acad. Sci. 2012;109(50):20608–20613. - PMC - PubMed
    1. Achard Sophie, Salvador R., Whitcher B., Suckling J., Bullmore E. Behavioral/Systems/Cognitive a resilient, low-frequency. Small-World Human Brain Functional Network with Highly Connected Association Cortical Hubs. 2006 - PMC - PubMed
    1. Amato M.P., Portaccio E., Goretti B., Zipoli V., Hakiki B., Giannini M., Razzolini L. Cognitive impairment in early stages of multiple sclerosis. Neurol. Sci. 2010;31(SUPPL. 2) - PubMed
    1. Aschenbrenner, S., Tucha, O., & Lange, K.W. (2000). Regensburger Wortflüssigkeits-Test : RWT ; Handanweisung. Göttingen [u.a.]: Hogrefe, Verl. für Psychologie. Retrieved fromhttps://lhhal.gbv.de/DB=1/LNG=EN/CLK?IKT=12&TRM=325733740.
    1. Backman C., Cork S., Gibson D., Parsons J. full-text. Can. J. Occupation. Therapy. 1992;59(4):208–213.

Publication types

MeSH terms