. 2020 Apr 1;80(7):1438-1450.
doi: 10.1158/0008-5472.CAN-19-2994. Epub 2020 Feb 3.

Enhanced Lipid Accumulation and Metabolism Are Required for the Differentiation and Activation of Tumor-Associated Macrophages

Affiliations

Enhanced Lipid Accumulation and Metabolism Are Required for the Differentiation and Activation of Tumor-Associated Macrophages

Pan Su et al. Cancer Res. .

Erratum in

Abstract

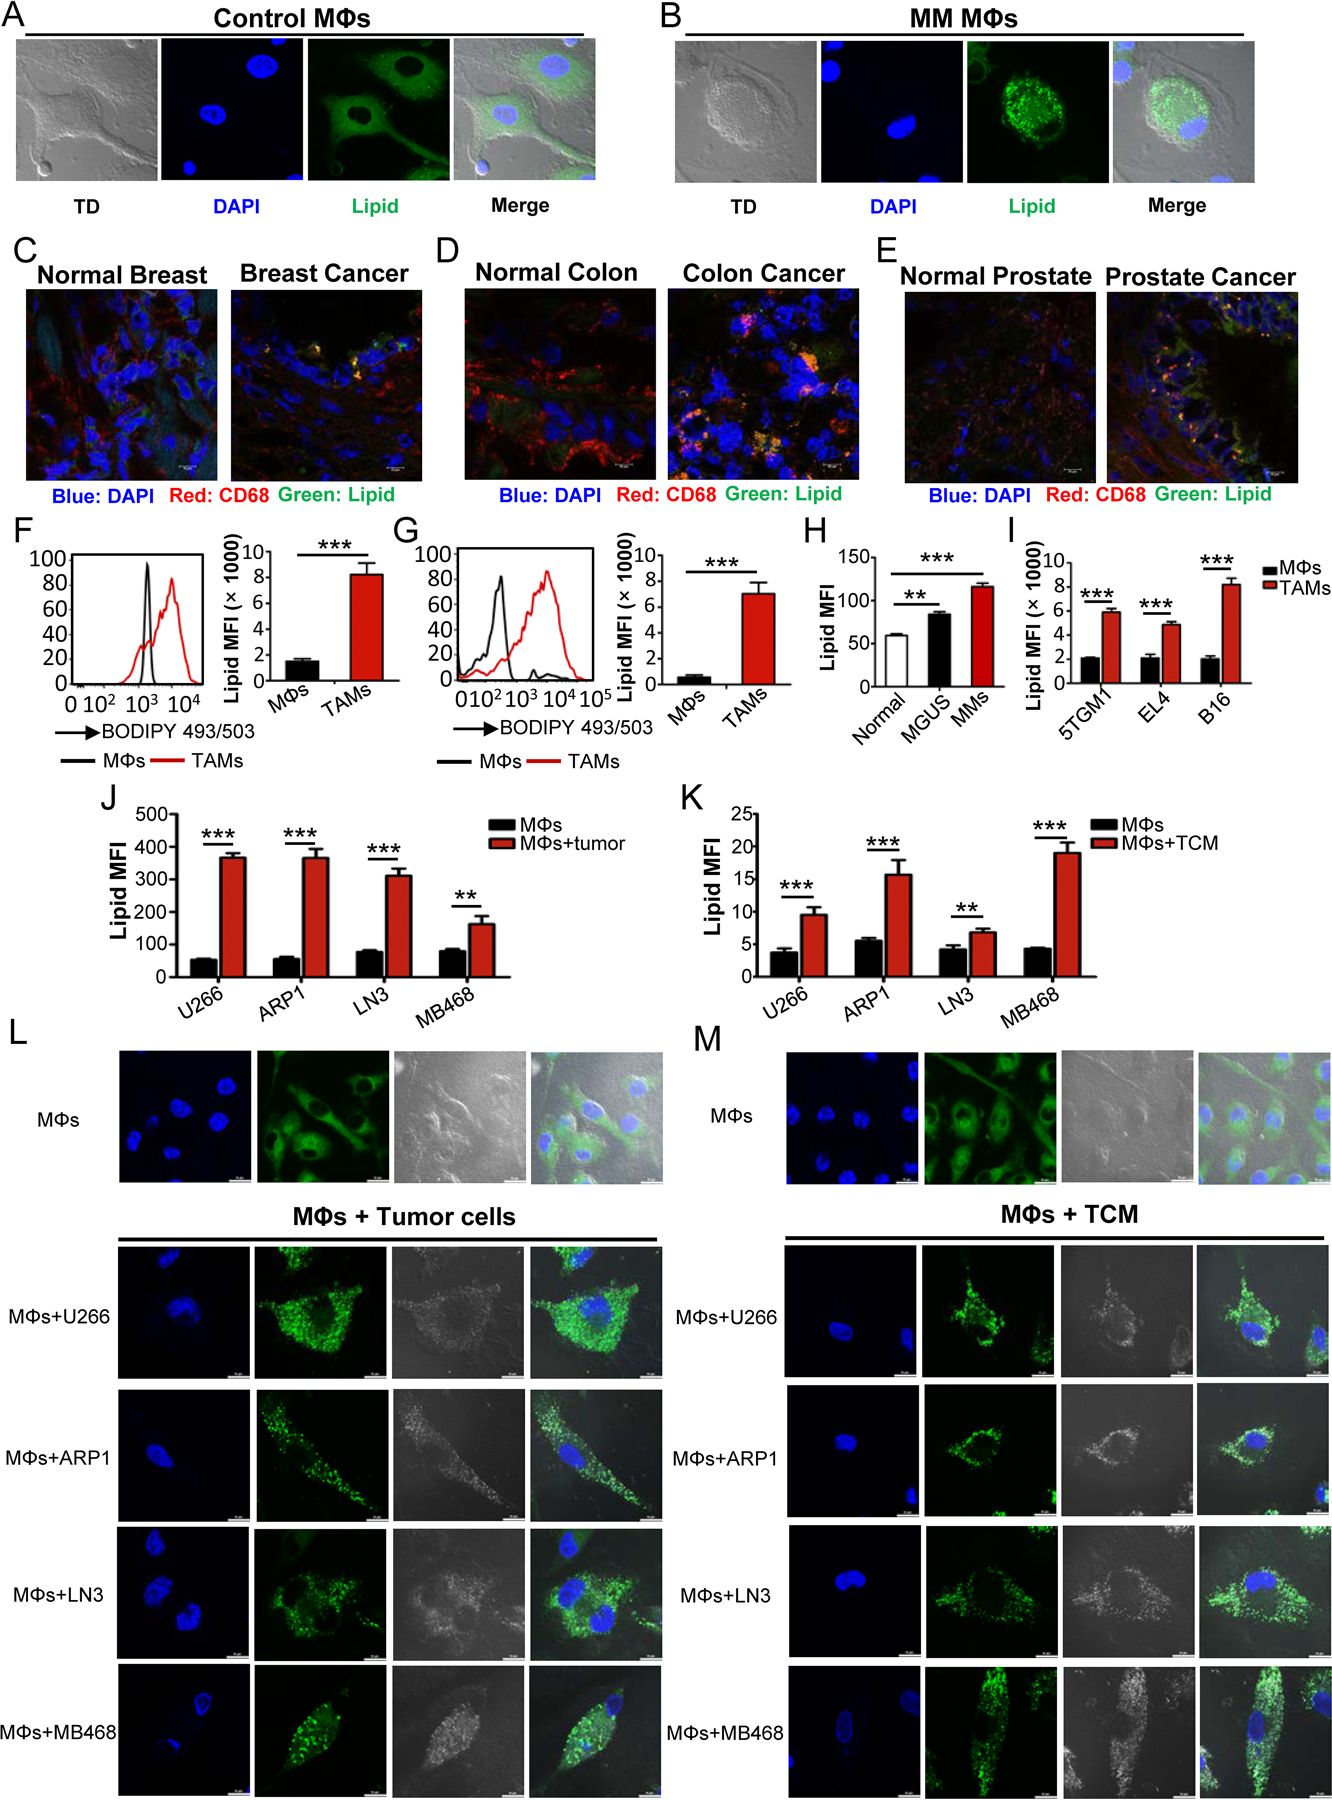
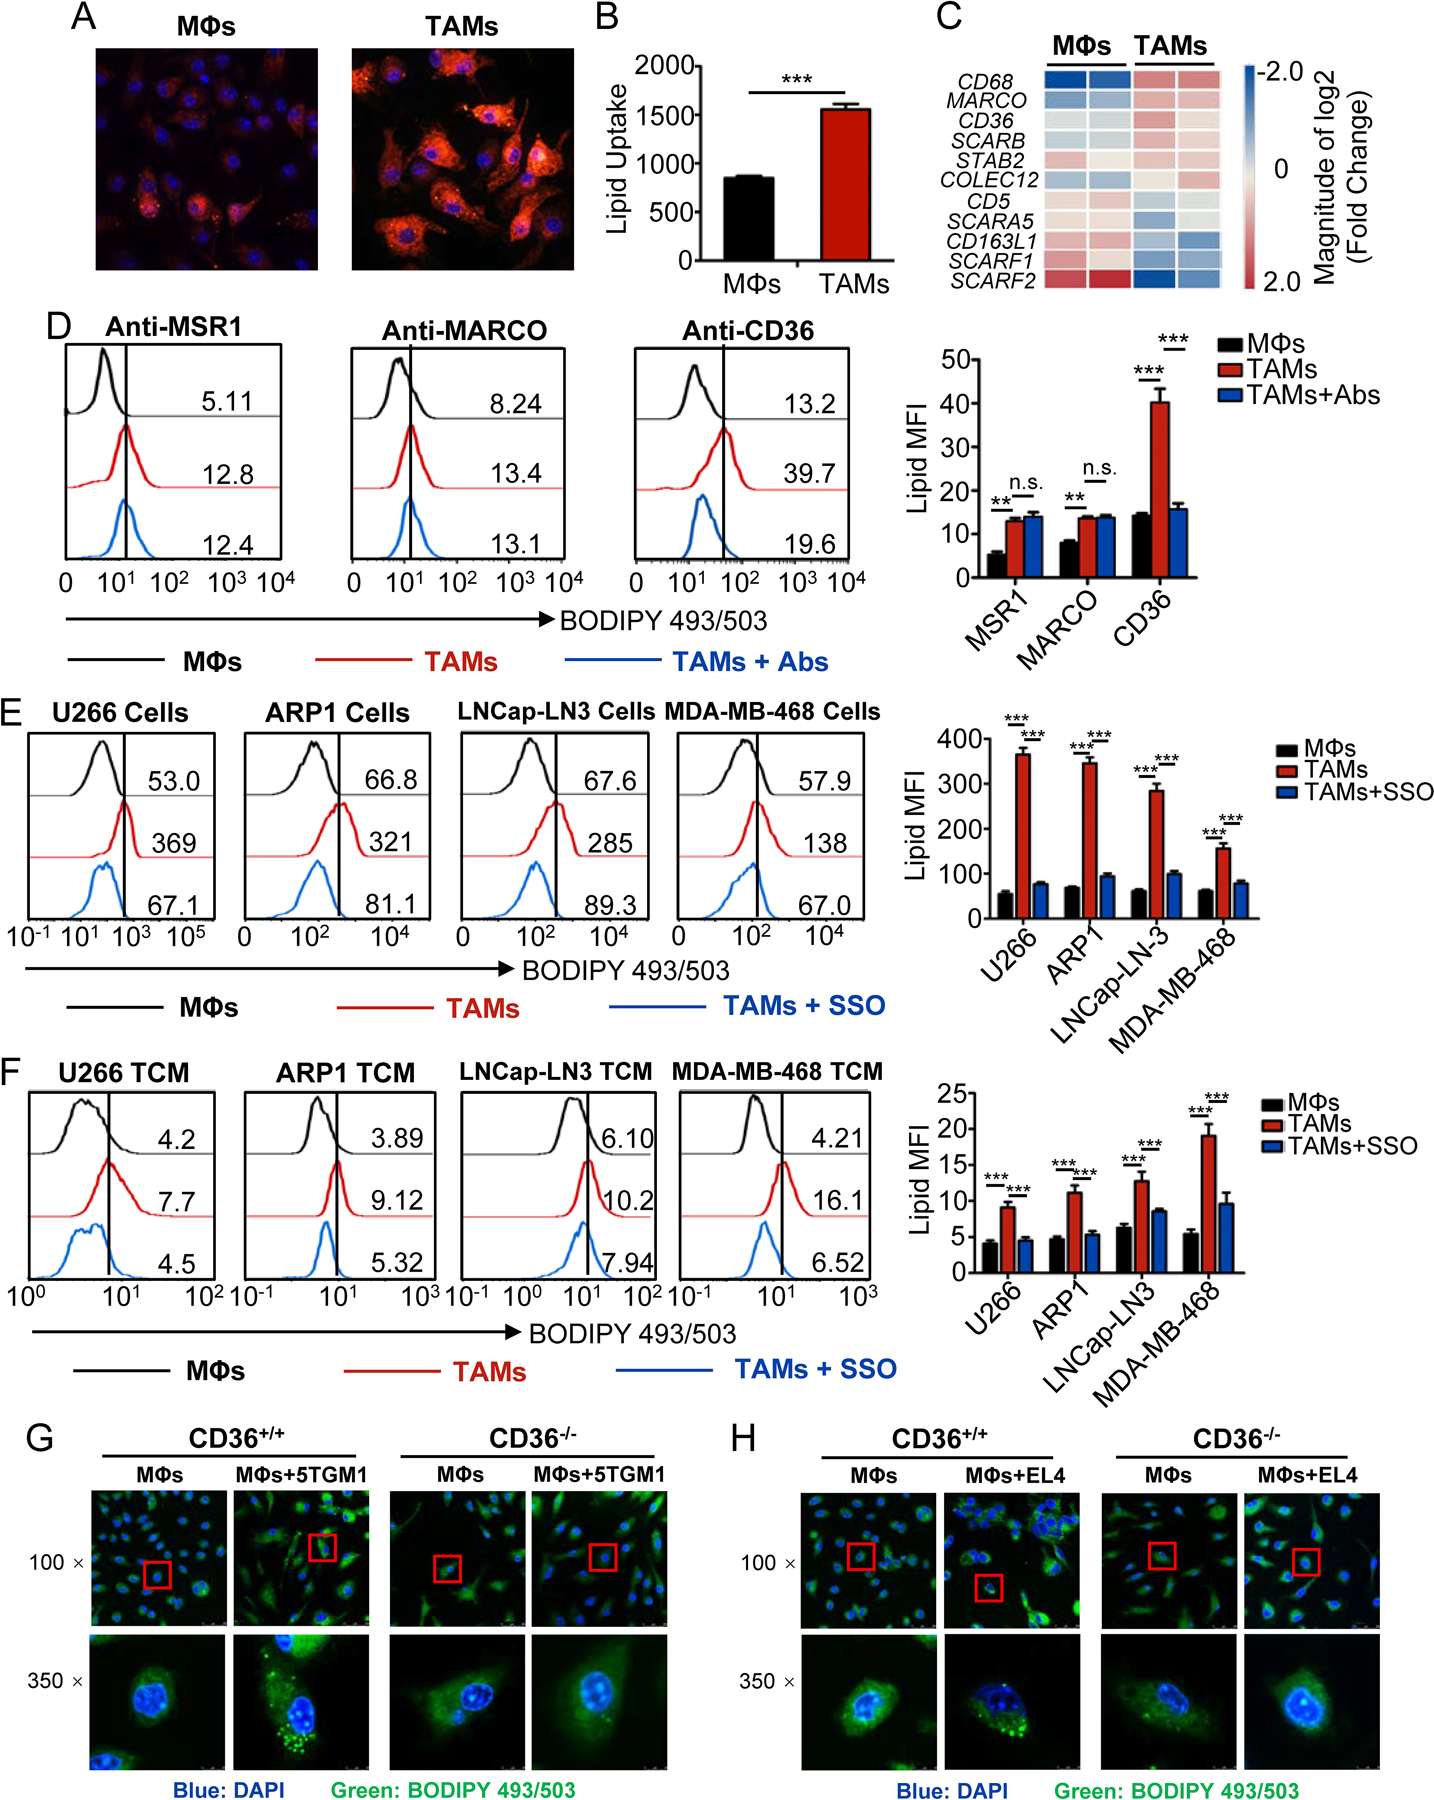
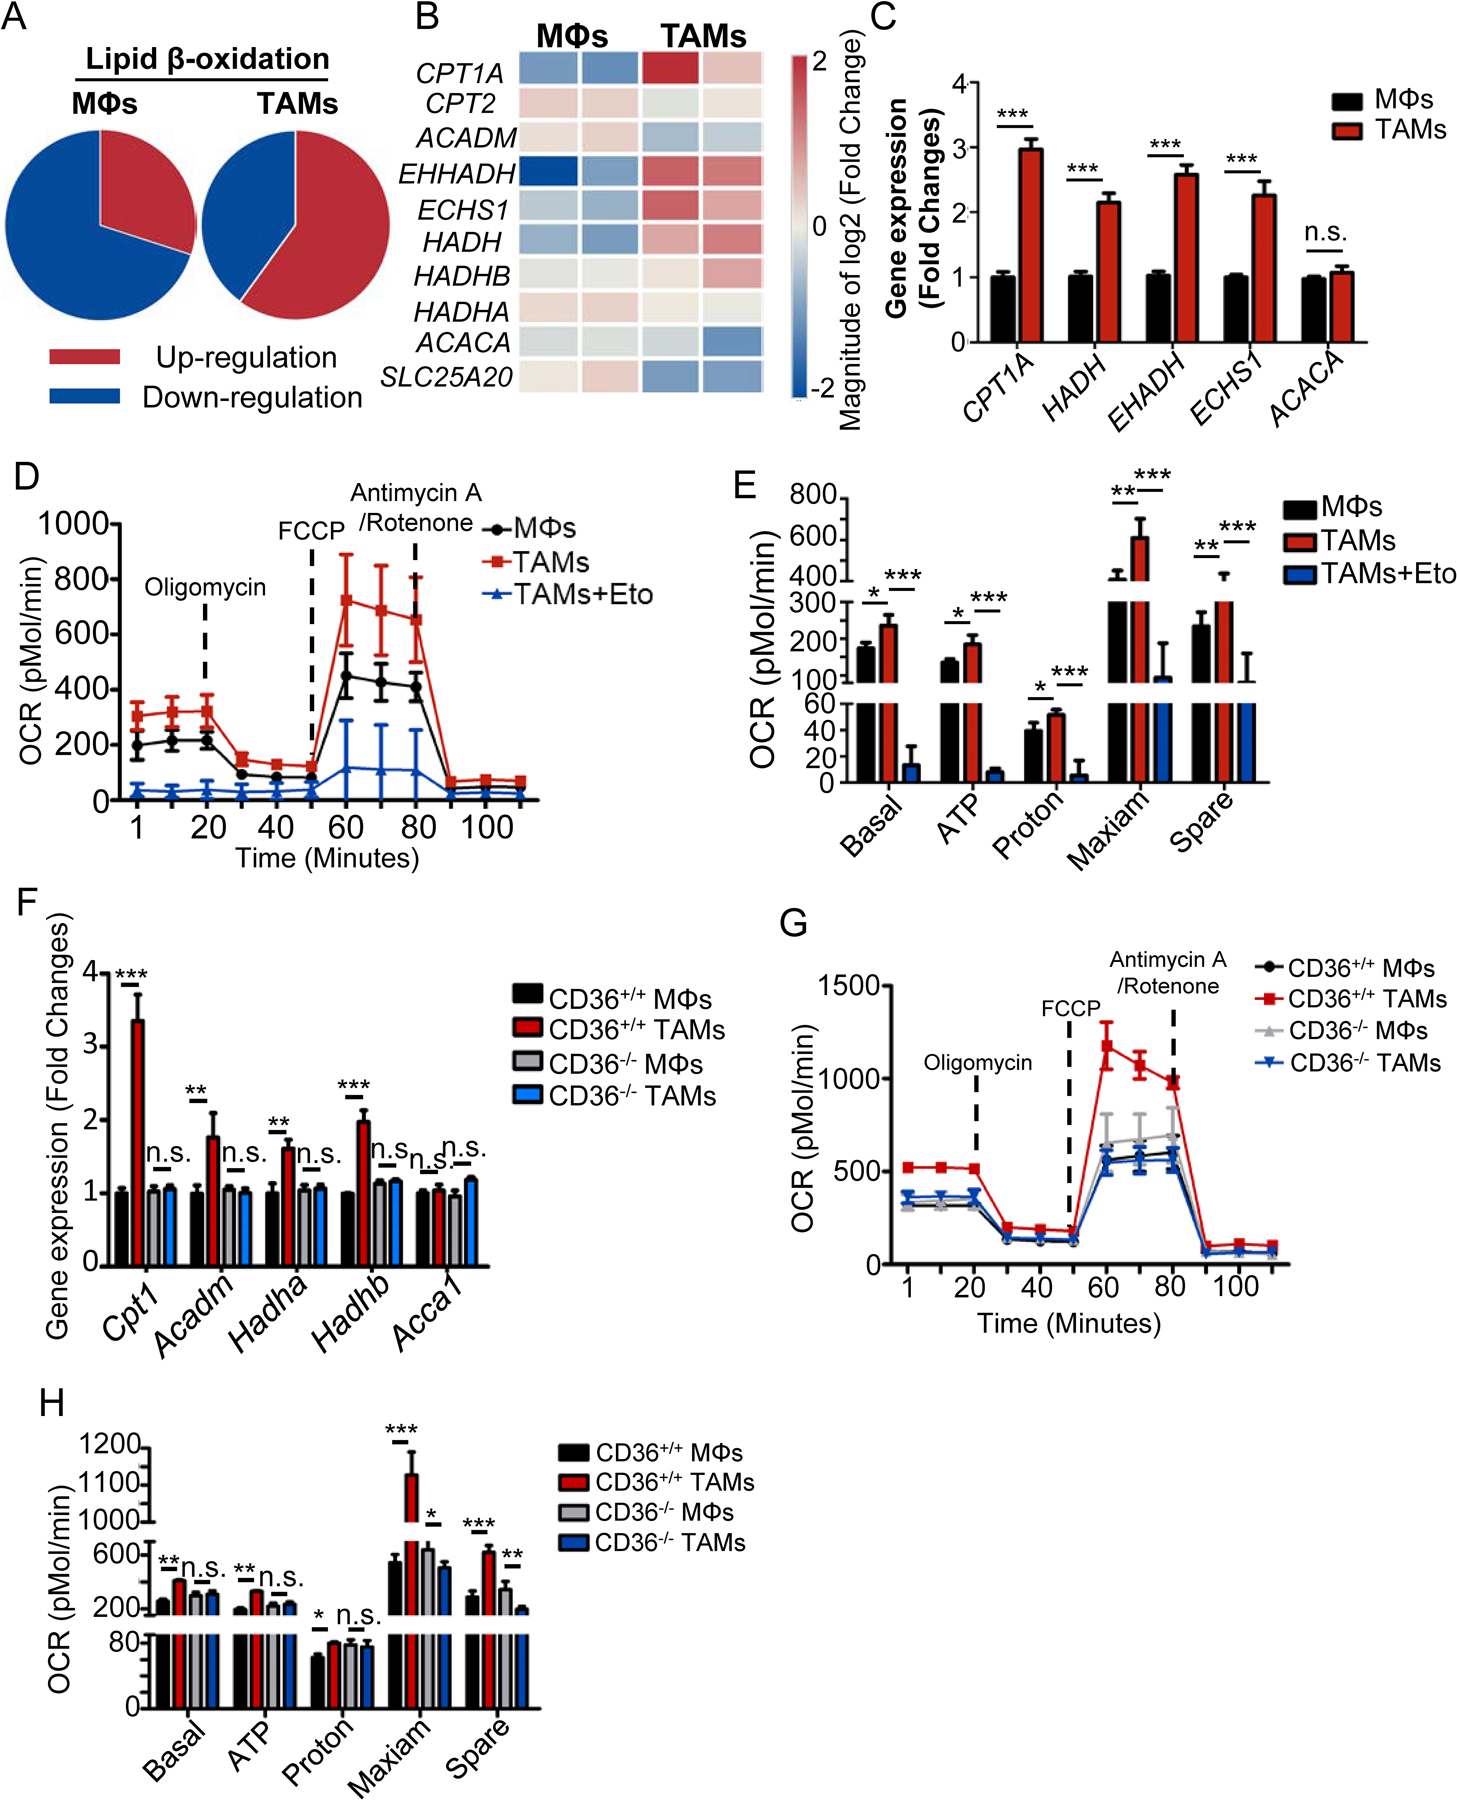
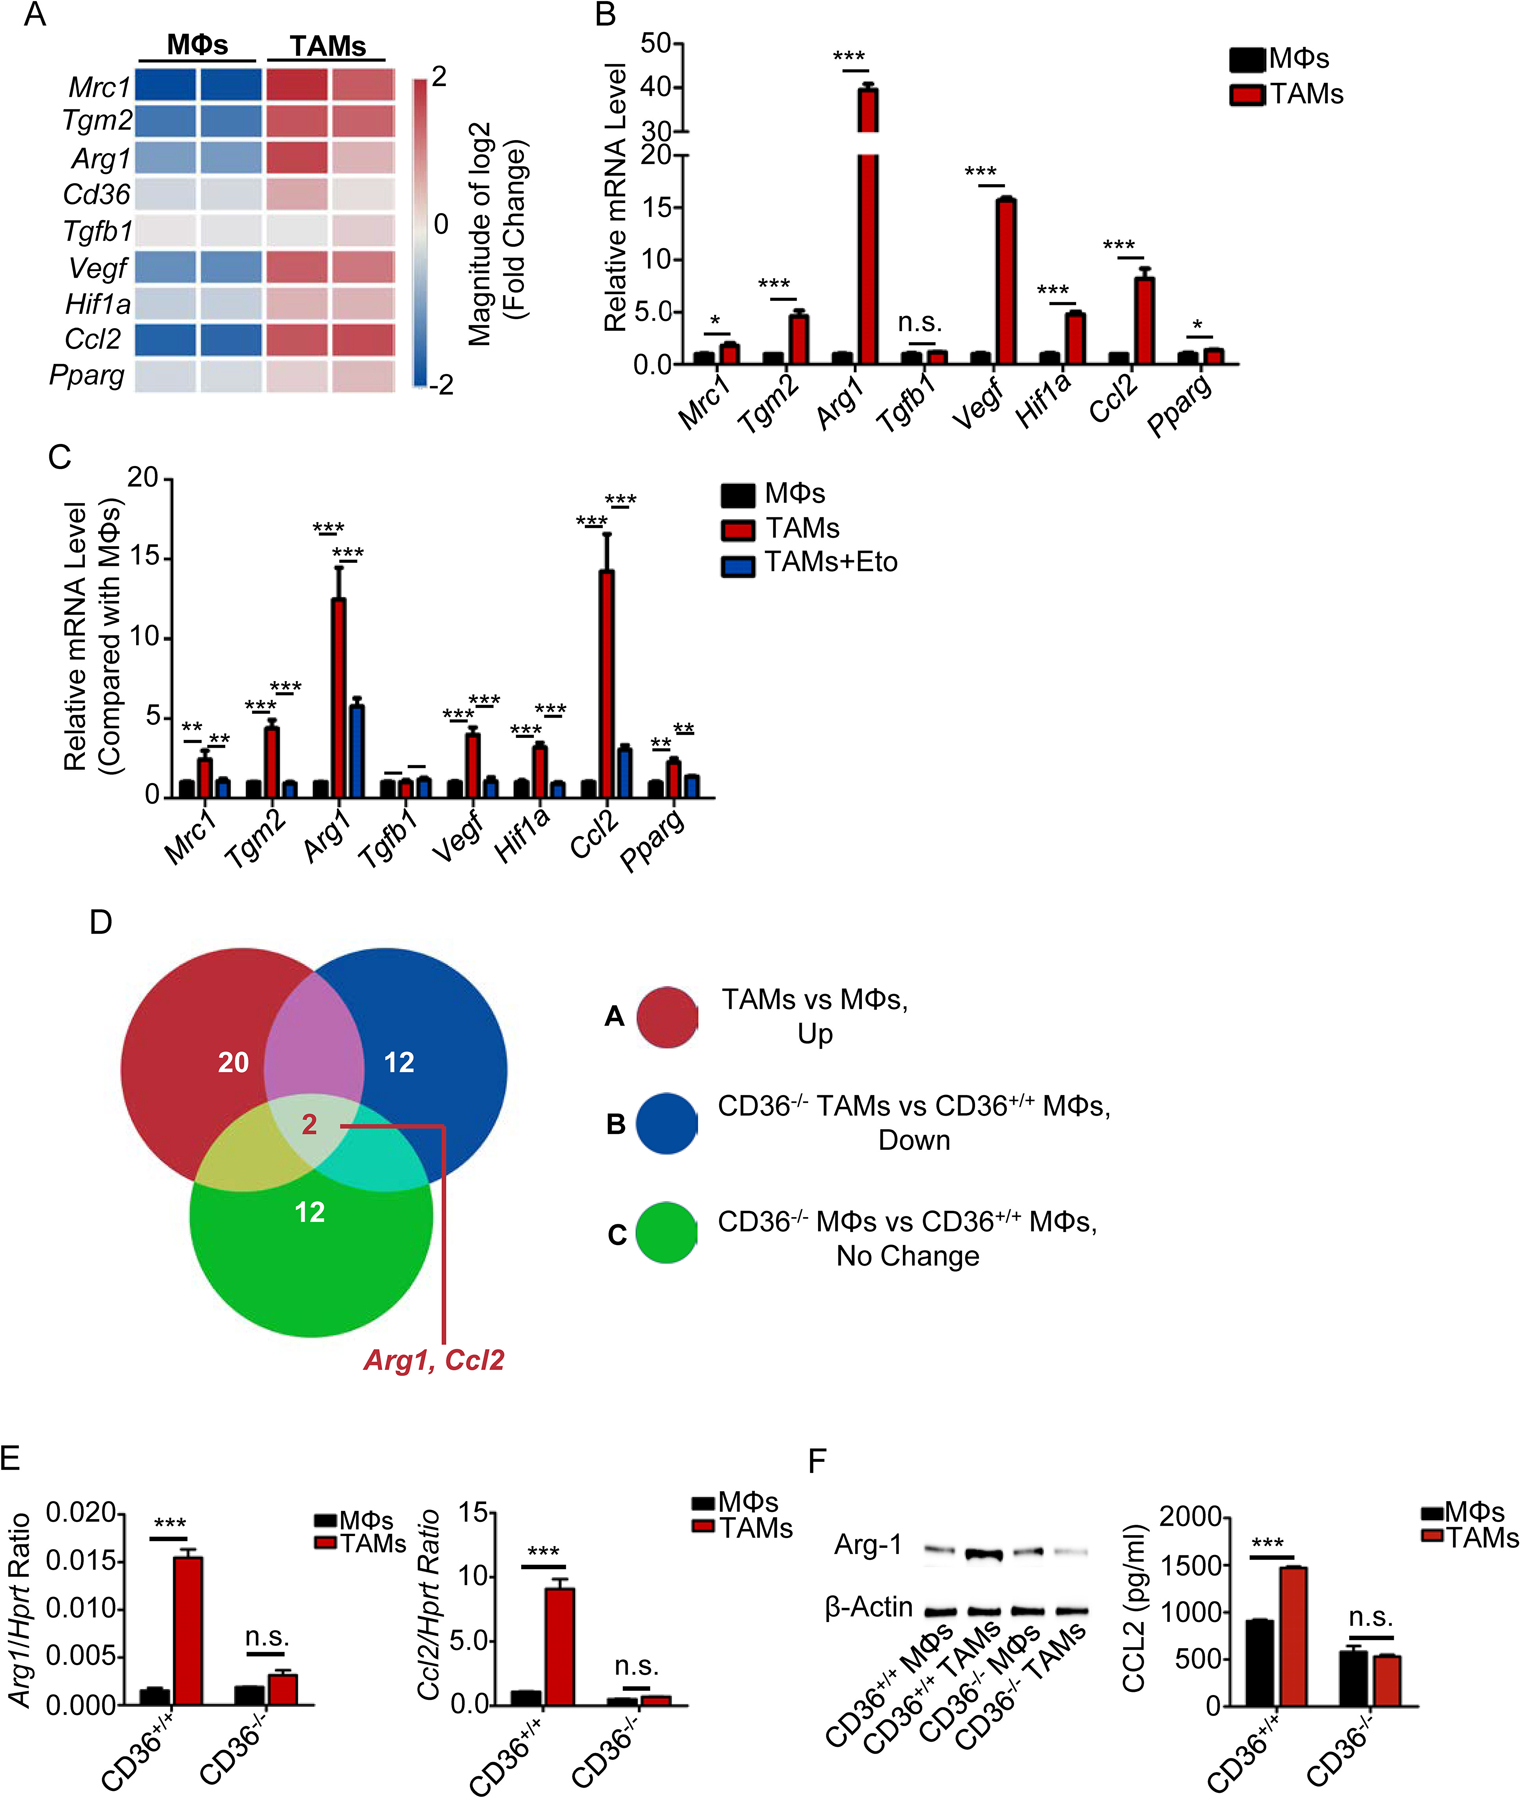
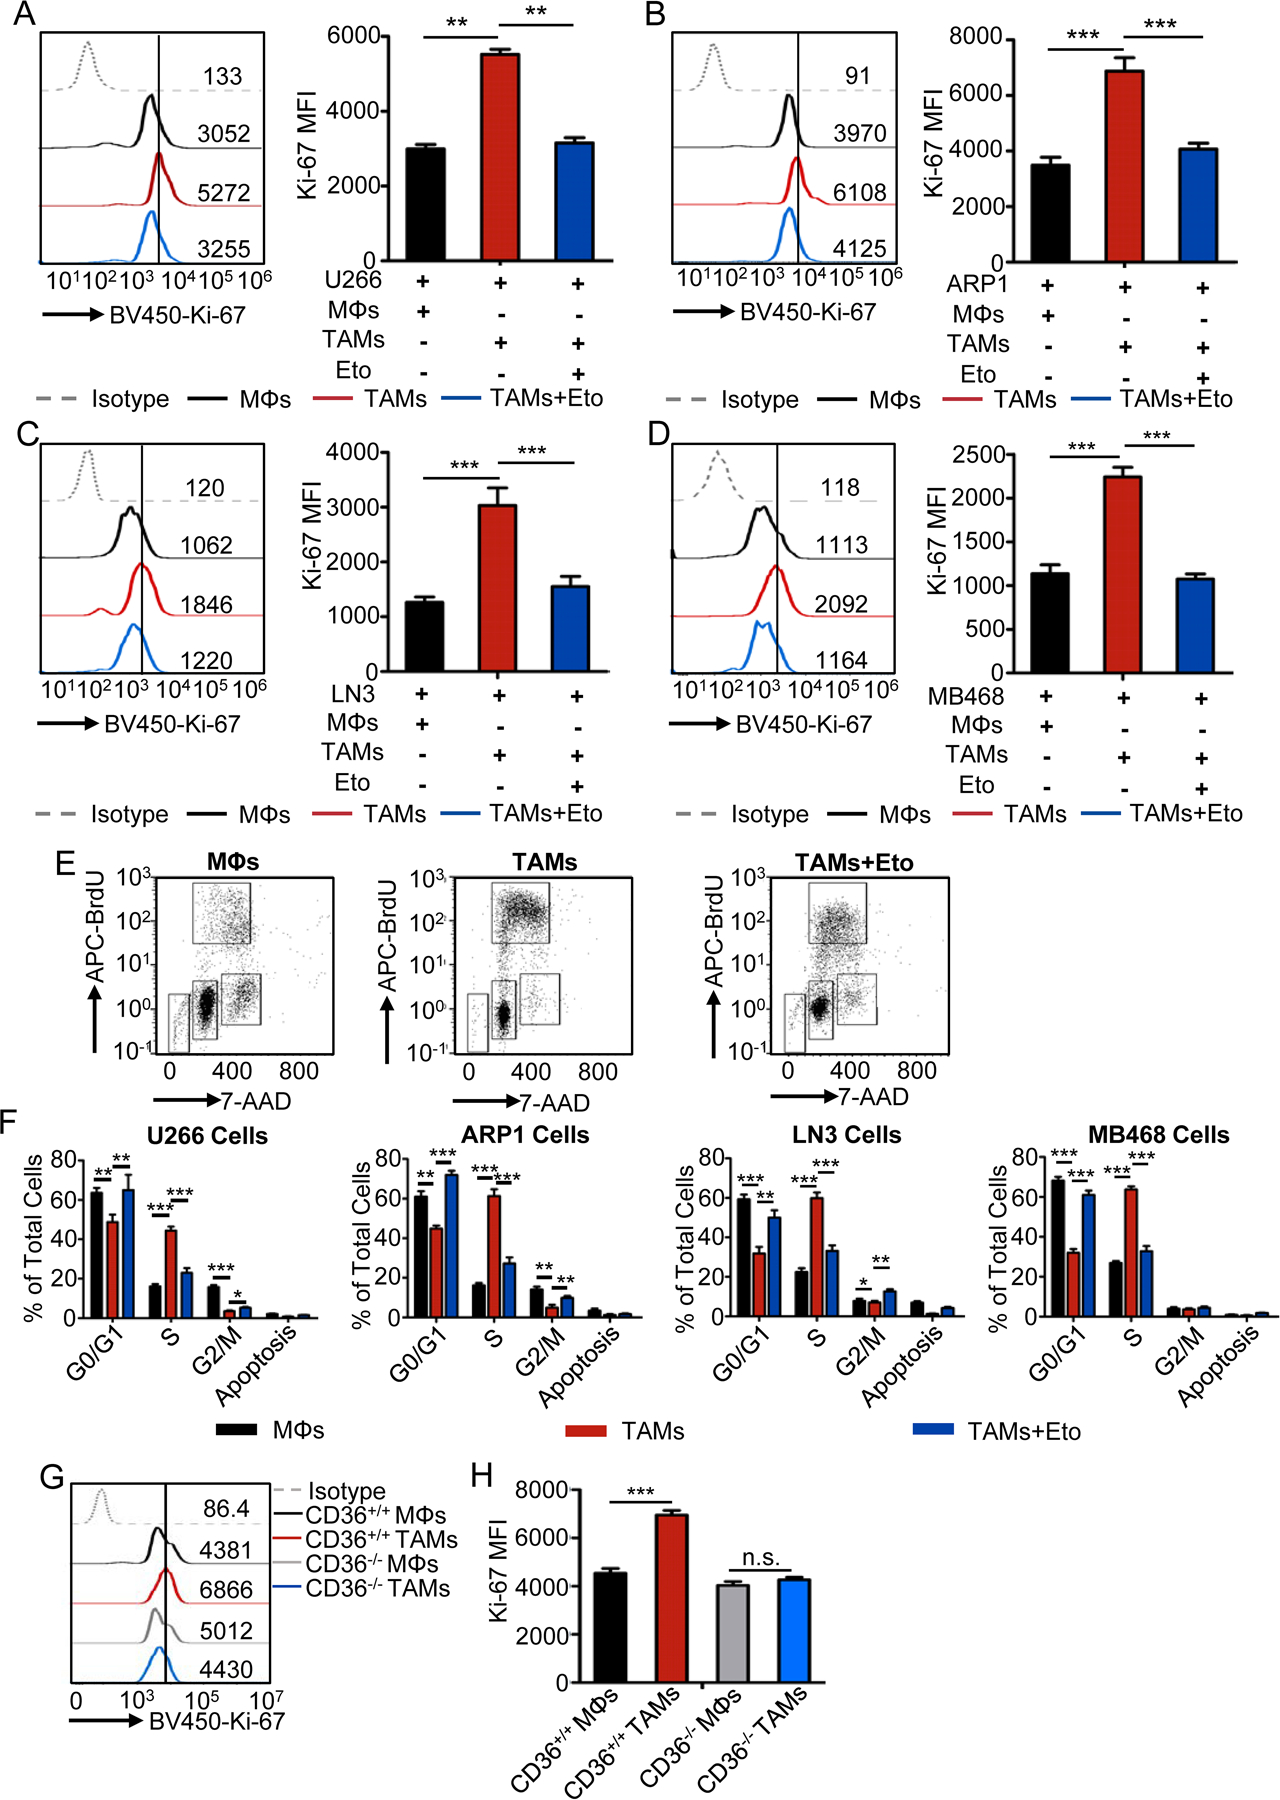
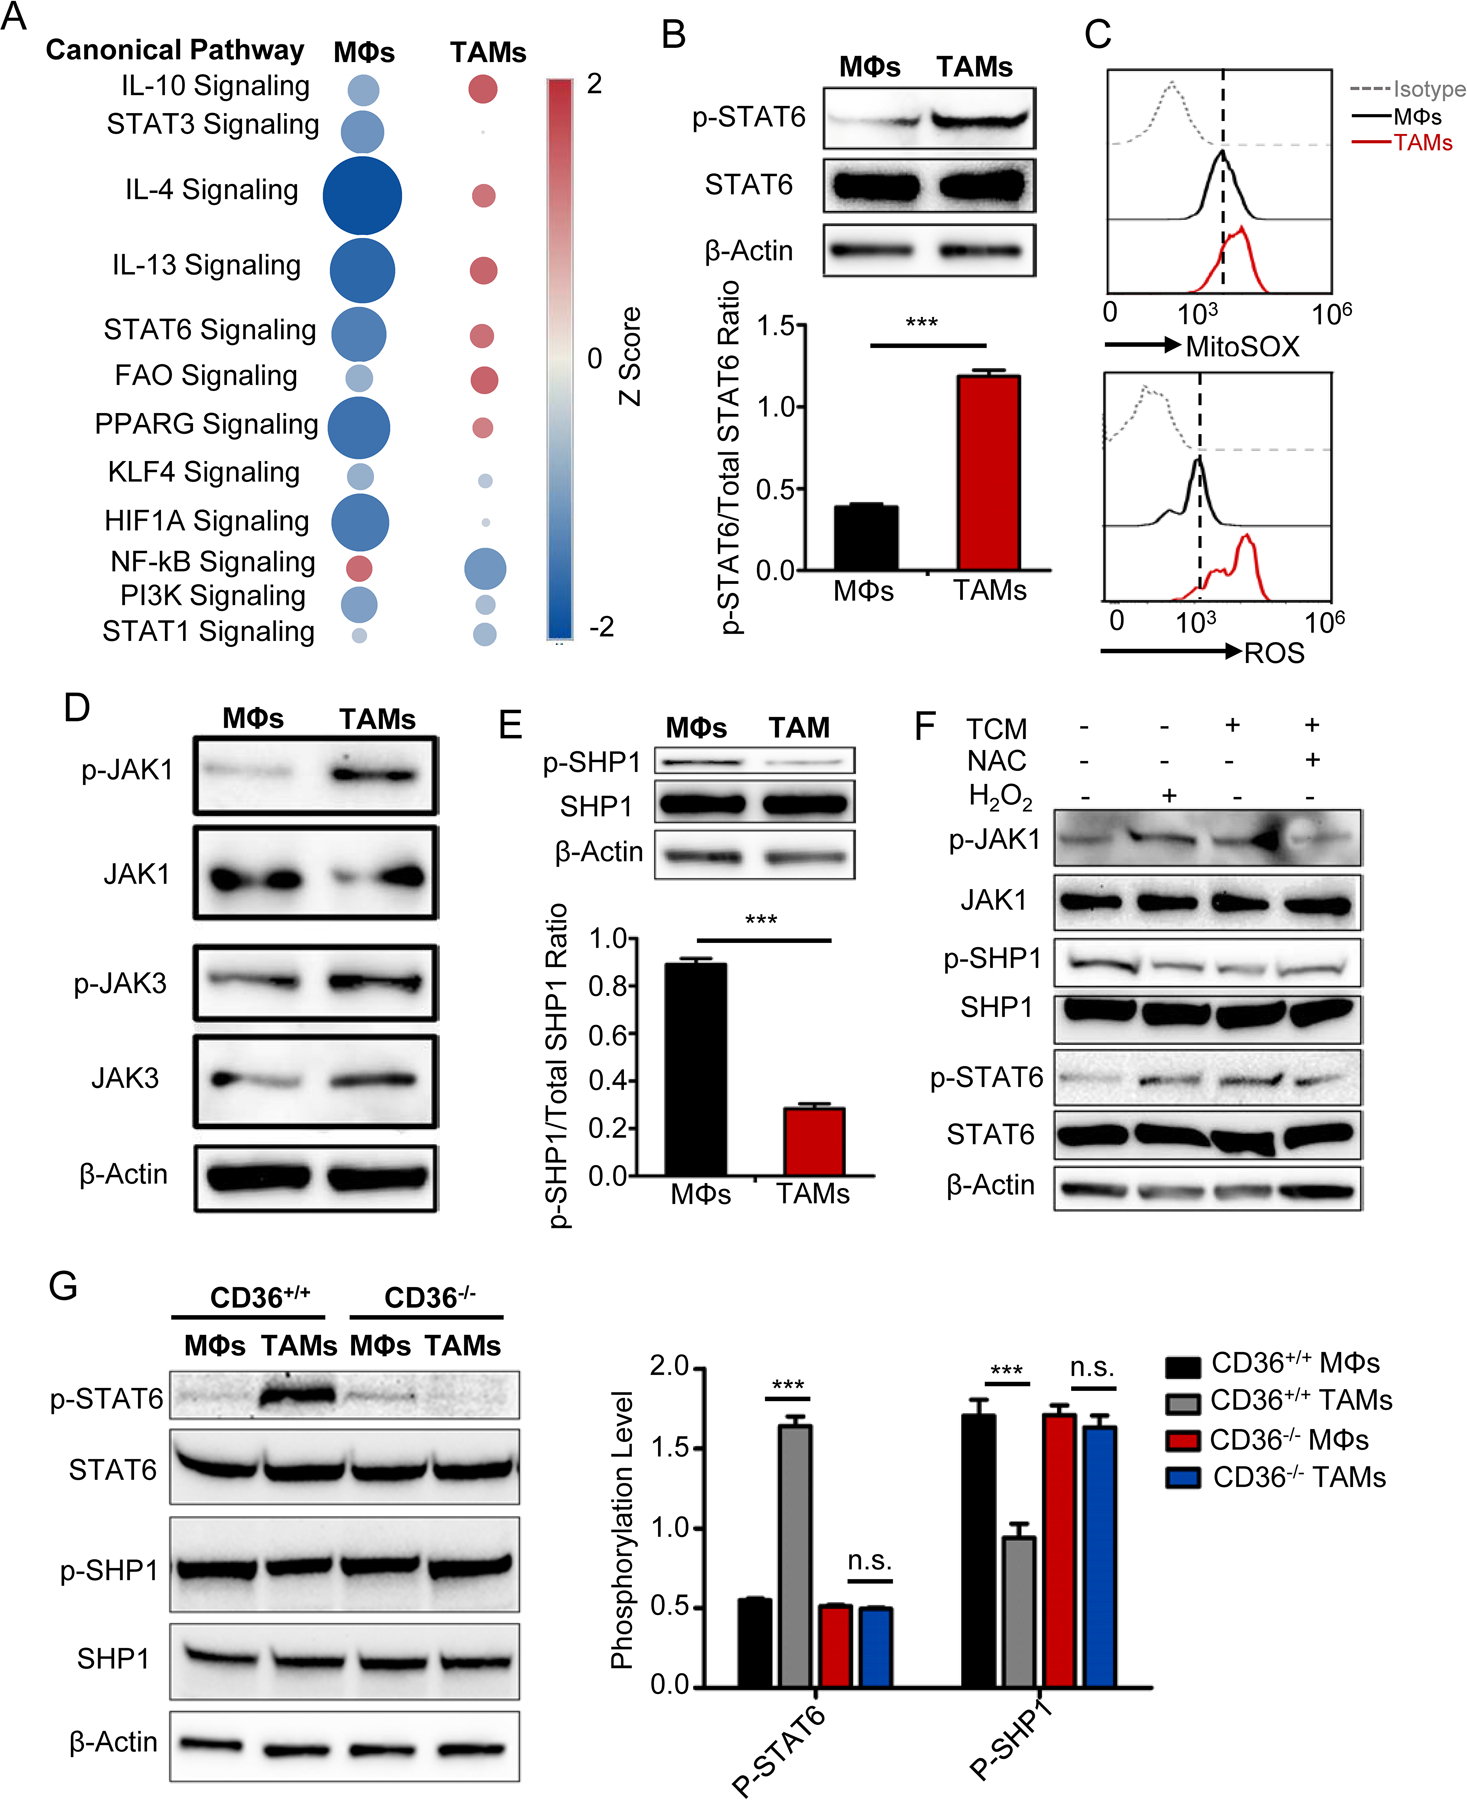
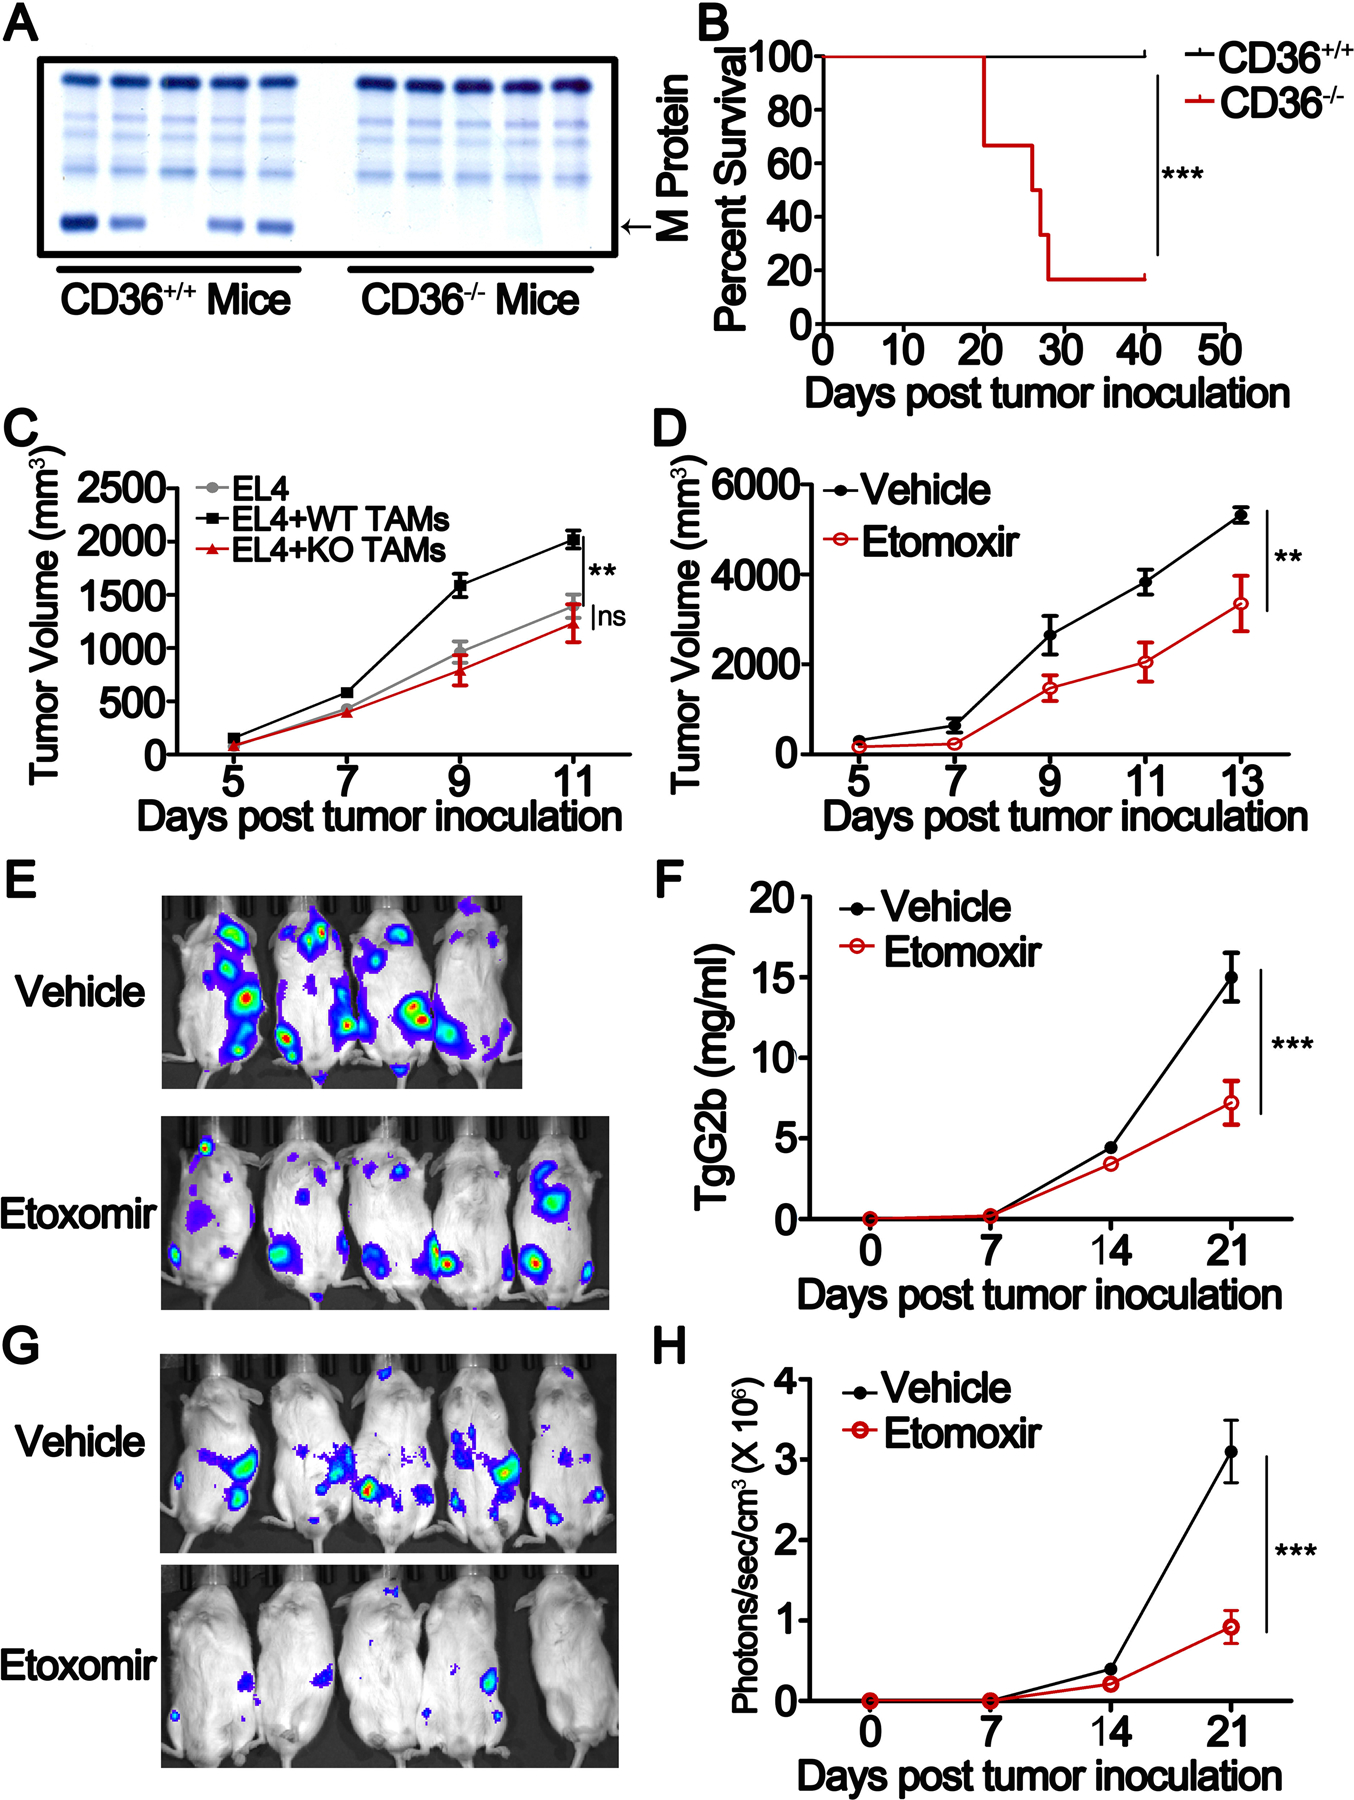
Tumor-associated macrophages (TAM) are important tumor-promoting cells. However, the mechanisms underlying how the tumor and its microenvironment reprogram these cells remain elusive. Here we report that lipids play a crucial role in generating TAMs in the tumor microenvironment (TME). Macrophages from both human and murine tumor tissues were enriched with lipids due to increased lipid uptake by macrophages. TAMs expressed elevated levels of the scavenger receptor CD36, accumulated lipids, and used fatty acid oxidation (FAO) instead of glycolysis for energy. High levels of FAO promoted mitochondrial oxidative phosphorylation, production of reactive oxygen species, phosphorylation of JAK1, and dephosphorylation of SHP1, leading to STAT6 activation and transcription of genes that regulate TAM generation and function. These processes were critical for TAM polarization and activity, both in vitro and in vivo. In summary, we highlight the importance of lipid metabolism in the differentiation and function of protumor TAMs in the TME. SIGNIFICANCE: This study highlights the role of lipid metabolism in the differentiation and function of TAMs and suggests targeting TAM fatty acid oxidation as a potential therapeutic modality for human cancers.


Conflict of interest statement

Conflict of interest: The authors have declared that no conflict of interest exists.

Figures

Fig. 1.
Fig. 1.. Lipid accumulation in TAMs
A-B, Representative fluorescent confocal images showing the morphology and lipid levels of human MΦs sorted from BM samples of normal donors (A) and MM patients (B). TD represents contrast image by transmitted light differential interference. C-E, Representative images of lipid levels and CD68 expression in human frozen sections of breast, colon, and prostate cancer and normal tissues. F, Representative histogram showing the levels of lipids in CD11b+CD68+ MΦs from human colon normal and cancer tissues (left panel). Right panel showing the statistic result of the mean fluorescence intensity (MFI) of lipids in MΦs from normal and tumor tissues. Statistical significance was determined by two-tailed Student’s t test between control MΦs and TAMs. ***, P < 0.001. G, Representative histograms (left panel) and quantitative result (right panel) of the lipid levels in MΦs from human normal and melanoma tissues. Statistical significance was determined by two-tailed Student’s t test between control MΦs and TAMs. ***, P < 0.001. H, Bar graph representing the lipid levels in CD11b+CD68+ MΦs from normal, MGUS, and MM BM samples. Statistical significance was determined by two-tailed Student’s t test between normal and disease group. **, P < 0.01; ***, P < 0.001. I, Statistic results of lipid levels in F4/80+CD11b+ MΦs of tumor tissues and their corresponding normal tissues from indicated tumor-bearing (TB) or normal mice. Statistical significance was determined by two-tailed Student’s t test between control MΦs and TAMs. ***, P < 0.001. J-K, Bar graphs depicting the MFI of lipids in MΦs cultured with or without indicated tumor cells (J) or TCM (K). Statistical significance was determined by two-tailed Student’s t test between control MΦs and different TAMs. **, P < 0.01; ***, P < 0.001. L-M, Representative confocal images of lipid droplet in MΦs cultured with tumor cells (L) or TCM (M).
Fig. 2.
Fig. 2.. Blocking CD36 abolishes lipid accumulation in TAMs
A, Representative fluorescent confocal images showing Fatty Acid-Red C12 uptake by human control MΦs and TAMs. B, Bar graph depicting ELISA results of fatty acid uptake by control MΦs and TAMs using a Free Fatty Acid Uptake Assay kit. Statistical significance was determined by two-tailed Student’s t test between control MΦs and TAMs. ***, P < 0.001. C, Heat map showing the relative expression of human scavenger receptors in TAMs compared with control MΦs. D, Representative histograms (left) and statistic results (right) showing lipids in MΦs and TAMs with indicated blocking antibody treatments. Statistical significance was determined by two-tailed Student’s t test between control MΦs and TAMs. **, P < 0.01; ***, P < 0.001; n.s., not significant. E-F, Representative histograms (left) and statistic results (right) showing lipid levels in control MΦs and indicated TAMs cultured with or without SSO. Statistical significance was determined by two-tailed Student’s t test between control MΦs and TAMs. ***, P < 0.001. G-H, Representative confocal images of lipids of murine MΦs from CD36 WT and KO mice cultured with or without 5TGM1 (G) or EL4 (H) cells in vitro.
Fig. 3.
Fig. 3.. Culture with tumor cells increases the fatty acid oxidation in TAMs
A-B, Microarray analysis of genes related to lipid β-oxidation in control MΦs and TAMs. Pie charts showing the percentage of total gene changes (A) in each indicated group of cells. Heat map showing the relative expression of lipid β-oxidation-associated genes (B) in control MΦs and TAMs. C, Relative mRNA expression of indicated genes related to lipid β-oxidation in control MΦs and TAMs. Statistical significance was determined by two-tailed Student’s t test between control MΦs and TAMs. ***, P < 0.001; n.s., not significant. D-E, Oxygen consumption rates (OCRs) of control MΦs, TAMs and etomoxir treated TAMs by Seahorse XF Analyzer (D). Statistic results depicting the basal and maximal respiration and spare respiratory capacity in control MΦs and TAMs by analyzing the OCRs (E). Statistical significance was determined by two-tailed Student’s t test between control MΦs and TAMs. *, P < 0.05; **, P < 0.01; ***, P < 0.001. F, Relative mRNA expression of indicated genes in control MΦs and TAMs from CD36 WT and KO mice using qPCR. Statistical significance was determined by two-tailed Student’s t test between control MΦs and TAMs. **, P < 0.01; ***, P < 0.001; n.s., not significant. G-H, OCRs of control MΦs and TAMs from CD36 WT and KO mice (G) and statistic results (H) depicting the basal and maximal respiration and spare respiratory capacity. Statistical significance was determined by two-tailed Student’s t test between control MΦs and TAMs. *, P < 0.05; **, P < 0.01; ***, P < 0.001, n.s., not significant.
Fig. 4.
Fig. 4.. Fatty acid oxidation promotes TAM differentiation
A, Heat map showing the relative expression of TAM signature genes in control MΦs and TAMs. B, Relative mRNA expression of TAM signature genes in control MΦs and TAMs by qPCR. Statistical significance was determined by two-tailed Student’s t test between control MΦs and TAMs. *, P < 0.05; ***, P < 0.001, n.s., not significant. C, Relative mRNA expression of indicated genes in the MΦs with indicated treatment. Statistical significance was determined by two-tailed Student’s t test between control MΦs and TAMs. **, P < 0.01; ***, P < 0.001, n.s., not significant. D, Venn diagram showing the changes in gene expression in control MΦs and TAMs under various conditions. Arg1 and Ccl2 were in the intersection between these three gene sets. E-F, Relative mRNA expression (e) and protein levels (f) of Ccl2 and Arg1 in control MΦs and TAMs from CD36 WT and KO mice. Statistical significance was determined by two-tailed Student’s t test between control MΦs and TAMs. ***, P < 0.001, n.s., not significant.
Fig. 5.
Fig. 5.. Inhibition of fatty acid oxidation impairs protumor function of TAMs
A-D, Representative histograms (left) and statistic results (right) of the expression of Ki-67 in human U266 (A) and ARP1 (B) myeloma cells, LNCap-LN3 prostate tumor cells (C), and MDA-MB-468 breast tumor cells (D), cultured with control MΦs or TAMs in the presence or absence of etomoxir. Statistical significance was determined by two-tailed Student’s t test between indicated groups. **, P < 0.01; ***, P < 0.001. E, Representative dot plots showing cell cycle progression of tumor cells with indicated coculture conditions using APC-BrdU and 7-AAD. F, Bar graphs showing the percentage of human U266, ARP1, LNCaP-LN3, and MDA-MB-468 cells in the indicated cell cycle stages under indicated coculture conditions. Statistical significance was determined by two-tailed Student’s t test between indicated groups. *, P < 0.05; **, P < 0.01; ***, P < 0.001. G-H, Representative histograms (G) and statistic results (H) showing the expression of Ki-67 in 5TGM1 cells cultured with control MΦs or TAMs from CD36 WT and KO mice. Statistical significance was determined by two-tailed Student’s t test between indicated groups. ***, P < 0.001; n.s., not significant.
Fig. 6.
Fig. 6.. High level of fatty acid oxidation enhances the phosphorylation of STAT6
A, IPA analysis of canonical signaling pathways in control MΦs and TAMs. The circle surface area is proportional to −log (P-value) and the color intensity of circles indicates the Z score. B, Representative western blots (upper) of 3 independent experiments and statistic result (lower) showing STAT6 phosphorylation in control MΦs and TAMs. Statistical significance was determined by two-tailed Student’s t test between indicated groups. ***, P < 0.001. C, Representative histograms showing the levels of superoxide determined by Mitosox Red (upper) and cellular ROS by DCFDA (lower) in control MΦs and TAMs. D, Representative immunoblots of JAK1 and JAK3 phosphorylation in control MΦs and TAMs. E, Representative immunoblots (lower) and quantitative result (upper) of the SHP1 phosphorylation in control MΦs and TAMs. Statistical significance was determined by two-tailed Student’s t test between indicated groups. ***, P < 0.001. F, immunoblots of the phosphorylated and total JAK1, STAT6, and SHP1 in MΦs with indicated treatment. G, Western blots of STAT6 and SHP1 phosphorylation in control MΦs and TAMs from CD36 WT and KO mice. Bar graph showing means ± SEM of 3 independent experiments. Statistical significance was determined by two-tailed Student’s t test between indicated groups. ***, P < 0.001, n.s., not significant.
Fig. 7.
Fig. 7.. Effect of fatty acid oxidation inhibition on protumor function of TAMs
A, SPEP was performed on a representative Vk*MYC-bearing CD36 WT and KO mice. Arrows indicate M protein in Vk*MYC-bearing mice. B, Survival curves of CD36 WT and KO mice bearing Vk*MYC myeloma cells. The results were analyzed by Log-rank (Mantel-Cox) test (**, P < 0.01). C, EL4 lymphoma cells were mixed with or without CD36 WT or KO TAMs at a ratio of 5:1, and then injected subcutaneously into C57BL/6J mice. Tumor growth was monitored for 7 days. Results of tumor volumes are shown as means ± SEM. (* P < 0.05) D, EL4-bearing NSG mice were treated with 50 mg/kg etomoxir intraperitoneally every two days after tumor injection. Tumor growth was followed for 9 days. Results of tumor volumes were shown as means ± SEM. (* P < 0.05) E, Bioluminescent images of 5TGM1-luc myeloma cell-bearing NSG mice treated with 50 mg/kg etomoxir or vehicle on day 21. F, Tumor burden measured as serum concentration of IgG2b in 5TGM1-bearing mice treated with etomoxir or vehicle. Results are shown as means ± SEM. **, P < 0.01. G-H, Bioluminescent images (G) and statistic results of bioluminescent signals (H) of human MM.1S-luc cell-bearing NSG mice on day 21. Results are presented as means ± SEM. **, P < 0.01.

References

    1. Gordon S, Pluddemann A, Martinez Estrada F. Macrophage heterogeneity in tissues: phenotypic diversity and functions. Immunological reviews 2014;262:36–55 - PMC - PubMed
    1. Ye H, Zhou Q, Zheng S, Li G, Lin Q, Wei L, et al. Tumor-associated macrophages promote progression and the Warburg effect via CCL18/NF-kB/VCAM-1 pathway in pancreatic ductal adenocarcinoma. Cell death & disease 2018;9:453. - PMC - PubMed
    1. Chanmee T, Ontong P, Konno K, Itano N. Tumor-associated macrophages as major players in the tumor microenvironment. Cancers 2014;6:1670–90 - PMC - PubMed
    1. Wang Q, Lu Y, Li R, Jiang Y, Zheng Y, Qian J, et al. Therapeutic effects of CSF1R-blocking antibodies in multiple myeloma. Leukemia 2018;32:176–83 - PMC - PubMed
    1. Yang C, He L, He P, Liu Y, Wang W, He Y, et al. Increased drug resistance in breast cancer by tumor-associated macrophages through IL-10/STAT3/bcl-2 signaling pathway. Med Oncol 2015;32:352. - PubMed

Publication types

MeSH terms