. 2020 Feb 18;117(7):3874-3883.
doi: 10.1073/pnas.1912130117. Epub 2020 Feb 3.

Rhizosphere microbiome mediates systemic root metabolite exudation by root-to-root signaling

Affiliations

Rhizosphere microbiome mediates systemic root metabolite exudation by root-to-root signaling

Elisa Korenblum et al. Proc Natl Acad Sci U S A. .

Abstract

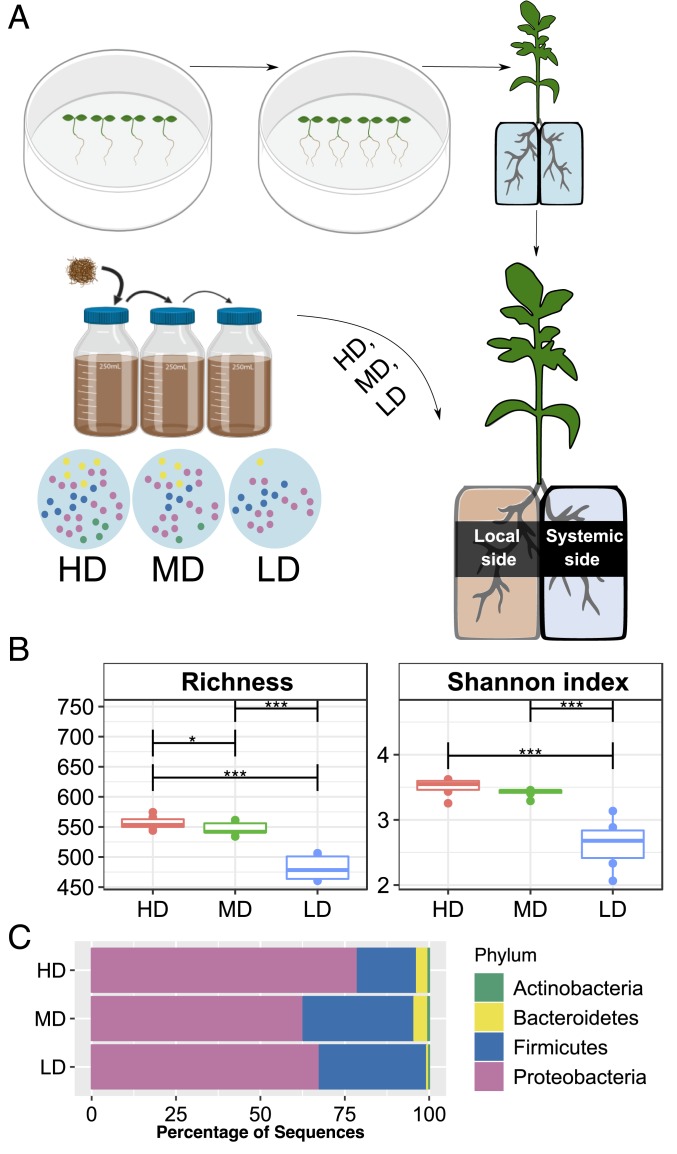
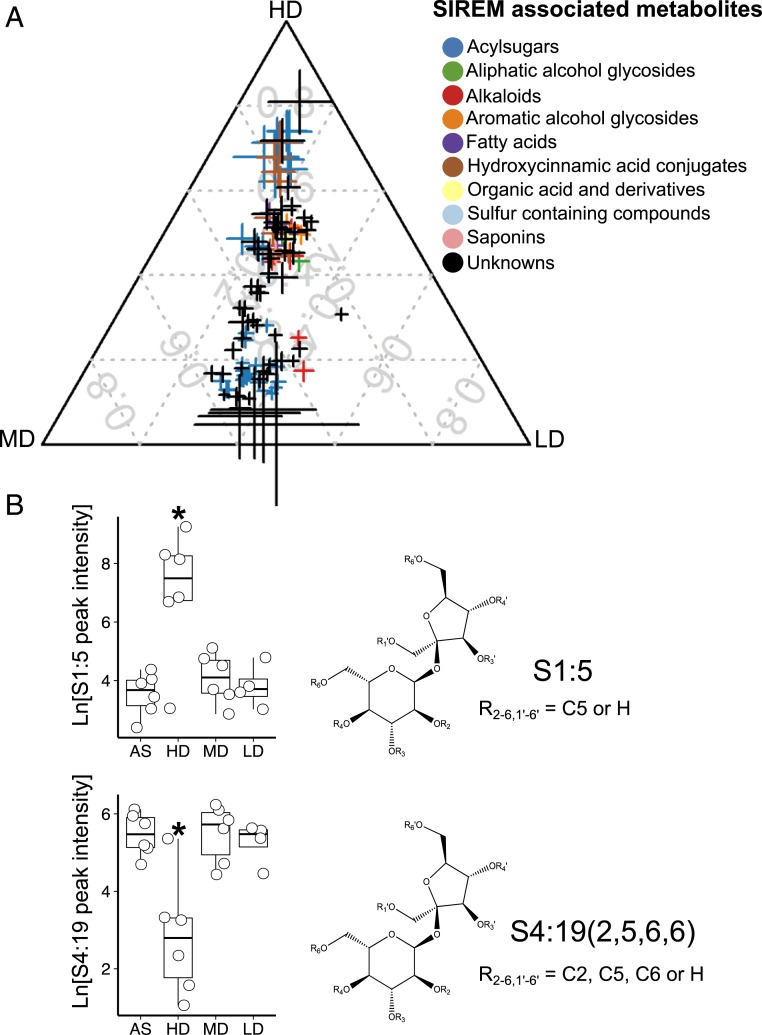
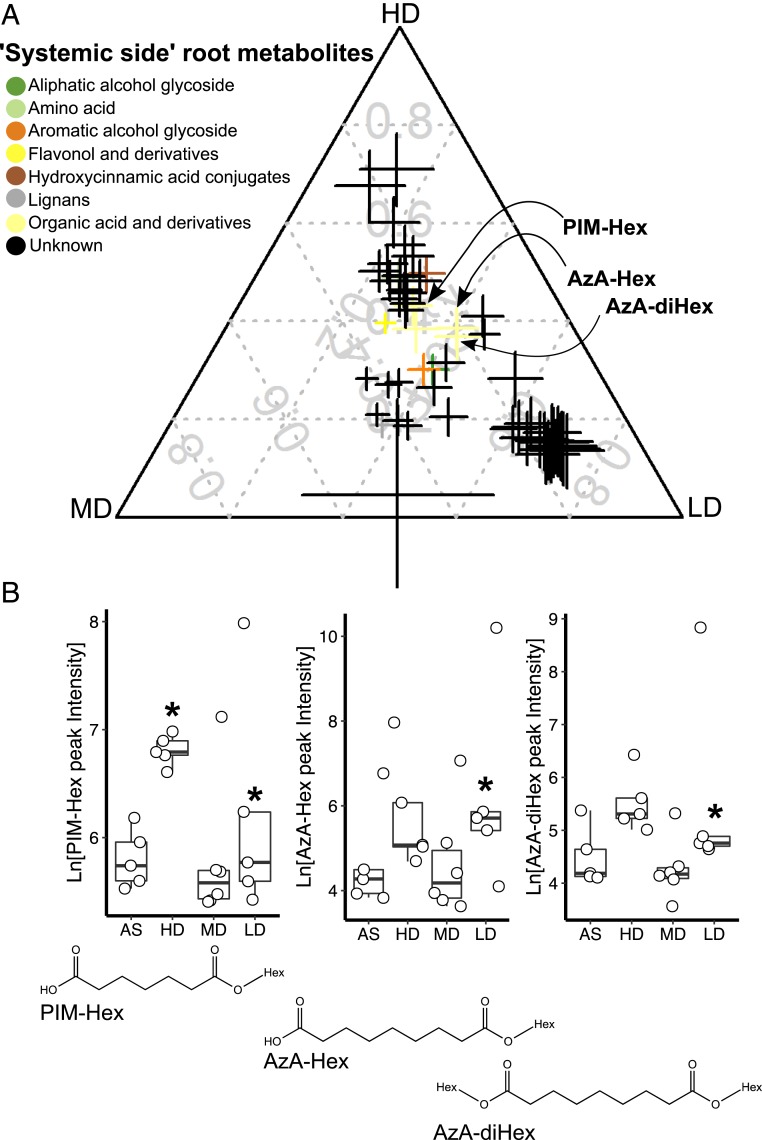
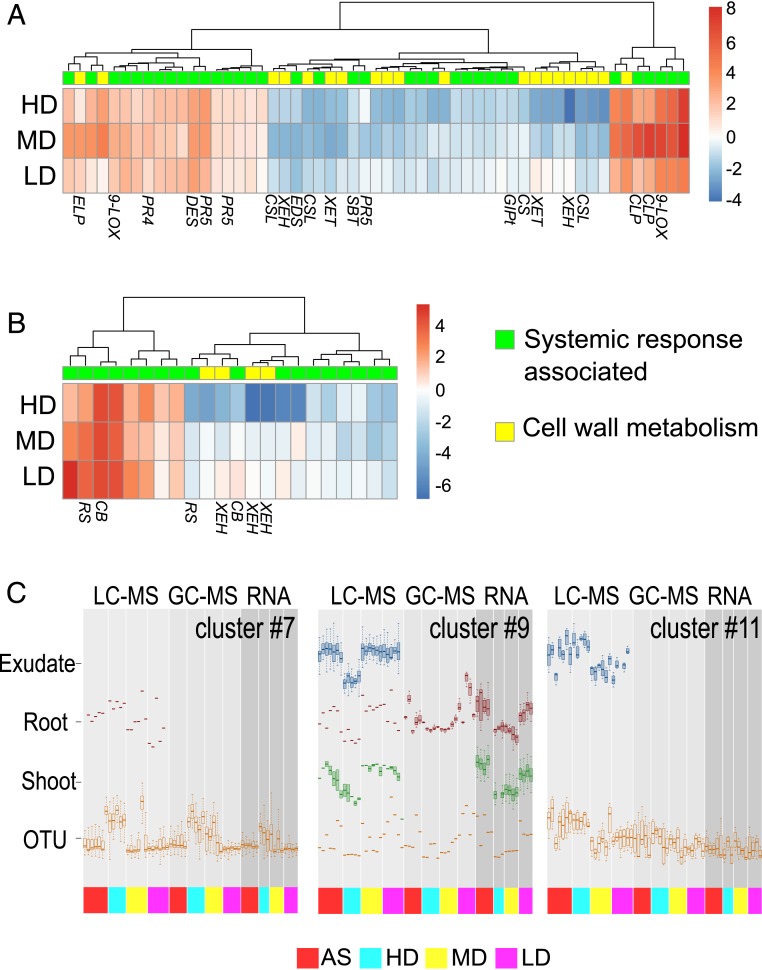
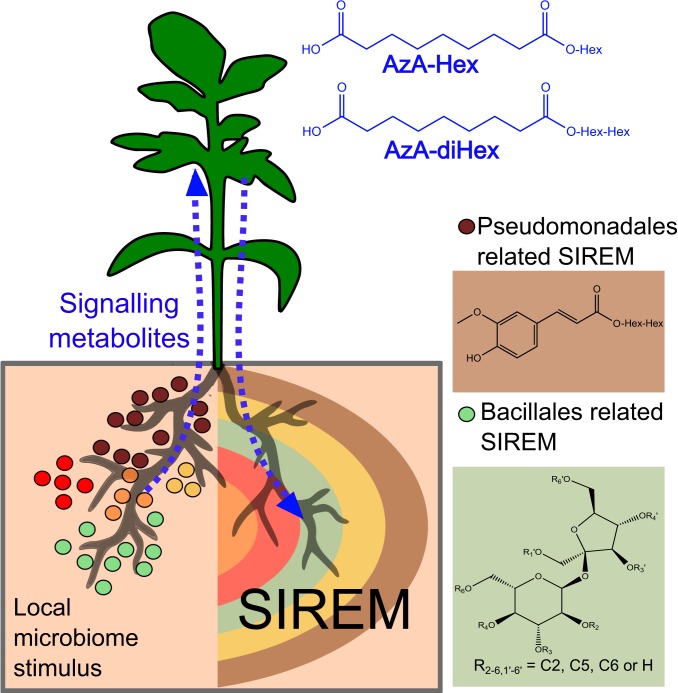
Microbial communities associated with roots confer specific functions to their hosts, thereby modulating plant growth, health, and productivity. Yet, seminal questions remain largely unaddressed including whether and how the rhizosphere microbiome modulates root metabolism and exudation and, consequently, how plants fine tune this complex belowground web of interactions. Here we show that, through a process termed systemically induced root exudation of metabolites (SIREM), different microbial communities induce specific systemic changes in tomato root exudation. For instance, systemic exudation of acylsugars secondary metabolites is triggered by local colonization of bacteria affiliated with the genus Bacillus Moreover, both leaf and systemic root metabolomes and transcriptomes change according to the rhizosphere microbial community structure. Analysis of the systemic root metabolome points to glycosylated azelaic acid as a potential microbiome-induced signaling molecule that is subsequently exuded as free azelaic acid. Our results demonstrate that rhizosphere microbiome assembly drives the SIREM process at the molecular and chemical levels. It highlights a thus-far unexplored long-distance signaling phenomenon that may regulate soil conditioning.

Keywords: long-distance signaling; metabolomics; microbiome; root exudation.


Conflict of interest statement

The authors declare no competing interest.

Figures

Fig. 1.
Fig. 1.
Linking local-side root microbiome diversity to the chemical composition of systemic root exudation. (A) Schematic representation of the split-root hydroponics experimental design. Local-side roots of the split-root set-up were inoculated with soil microbiome, established using the dilution-to-extinction approach; HD, MD, or LD diversity microbiomes and exudate samples were collected from the systemic side. (B) Alpha diversity indices of root microbiomes (local side) measured 7 d postinoculation. Number of species (richness) or Shannon index gradually decreased among HD, MD, LD microbiomes (asterisks denote difference in alpha diversity indices, *P < 0.05, ***P < 0.0005, ANOVA followed by Tukey’s honestly significant difference (HSD) post hoc multiple comparison). (C) Bar plots of relative abundances of the top four phyla in each root microbiome (HD, MD, and LD) after 7 d of inoculation. Data are the average of six biological replicates. OTU abundance (97% similarity) and assigned taxonomic classifications used to construct this panel can be found in Dataset S1C. The bacterial relative abundance displayed at the phylum level for all individual samples can be found in SI Appendix, Fig. S3B.
Fig. 2.
Fig. 2.
SIREM represents a root–root long-distance signaling that results in systemic exudation of various classes of metabolites. (A) Ternary plot of SIREM-induced metabolites differentially enriched in HD-, MD-, or LD-treated plants as compared to AS-control plants. Each data point represents a metabolite enriched in the systemic-side exudate associated with a microbiome treatment in the local-side root (n = 5 to 6, FDR <0.05, fold change >2). Data point size denotes the sum of fold change (square root transformed) of one metabolite in HD-, MD-, or LD-treated samples as compared to the AS controls. Data point position indicates the percent of each metabolite present in each group (i.e., HD, MD, LD). Color codes represent the metabolite chemical class. The metabolite annotation data and numerical values used to construct the ternary plot can be found in Datasets S2 A and C, respectively. (B) Root microbiome modulation of acylsucrose acylations in SIREM. Boxplots of peak intensities (natural log transformed) of representative acylsucroses that were HD-enriched (C5 acylsucrose; S1:5) and HD-depleted [acylsucrose with different acyl chains, S4:19 (2, 5, 6, 6)]. Asterisks above boxes indicate significant difference tested by ANOVA performed with Tukey’s HSD test (n = 5 to 6, FDR <0.05). Structures of C5 acylsucroses and S4:19 (2, 5, 6, 6) are depicted on the Right side of the boxplots.
Fig. 3.
Fig. 3.
Glycosylated forms of azelaic and pimelic acids accumulate in the systemic root side upon SIREM induction. (A) Ternary plot of metabolites differentially enriched in the systemic-side root tissue of HD-, MD-, or LD-treated plants as compared to AS-control plants. Each data point represents a metabolite enriched in the systemic-side root associated with a microbiome treatment in the local-side root (n = 5 to 6, FDR <0.05, fold change >2). Data point size denotes the sum of fold change (square root transformed) of one metabolite in HD-, MD-, or LD-treated samples as compared to the AS controls. Data point position indicates the percent of each metabolite present in each group (i.e., HD, MD, LD). Color codes represent the metabolite chemical class. Data points of azelaic acid dihexose (AzA-(di)Hex) and pimelic acid hexose (PIM-Hex) are highlighted. The metabolite annotation data and the numerical values used to construct the ternary plot can be found in Dataset S2 A and E, respectively. (B) Root microbiome induced of the accumulation of azelaic and pimelic acids glycosides in systemic-side roots. AzA-(di)Hex and PIM-Hex peak intensities (natural log transformed) are represented in boxplots. Asterisks above boxes indicate significant difference tested by ANOVA performed with Tukey’s HSD test (n = 5 to 6, FDR <0.05). Structures of AzA-(di)Hex and PIM-Hex are depicted below the corresponding boxplots.
Fig. 4.
Fig. 4.
Acylsugars and SGAs exuded in SIREM are localized in specific and varying root regions. (A, E, and I) Optical images of the tomato root used for MALDI-MSI analysis. The white broken line marks the region analyzed by MALDI-MSI. (B) MALDI-MSI of acylsucrose S1:5, m/z 427.18 ± 0.01 Da; (C) acylsucrose S4:19, m/z 665.33 ± 0.01 Da; (F and J) hydroxytomatine, m/z 1050.54 ± 0.01 Da; and (G and K) dehydrotomatine, m/z 1032.54 ± 0.01 Da. The intensity of spectra representing each metabolite is visualized in false color. (D, H, and L) Overlap of false color MALDI-MSI images of acylsucroses or SGAs. Arrows in B and D point to the specific accumulation of the S1:5 in the tip of lateral roots. The two representative SGAs are distributed along the main roots, while dehydrotomatine was also distributed along the lateral roots.
Fig. 5.
Fig. 5.
Integration of SIREM-associated data. Heat maps representing the expression of known systemic response-associated genes (green) and those related to cell wall biosynthesis (yellow) expressed in (A) shoots and (B) roots significantly regulated by local-side root microbiome. Induced (red to white) and repressed (white to blue) genes are depicted as log2 (fold changes) relative to plants AS treated. 9-LOX, 9-lipoxygenase; CLP, chitinase; CSL, cellulose synthase-like protein; XEH, xyloglucan endotransglucosylase-hydrolase; XET, xyloglucan endo-transglycosylase; CS, cellulose synthase; GlPt, glycerol-3-phosphate transporter; PR5, pathogen-induced protein 5; SBT, subtilisin-like protease; EDS, enhanced disease resistance-like protein; DES, divinyl ether synthase; PR4, pathogen-induced protein 4; ELP, extensin-like protein; CB, calcium-binding protein; RS, riboflavin biosynthesis protein. The gene annotations and numerical values can be found in Dataset S4 B and E. (C) Selected SOM clusters representing integrated data (i.e., microbiome, transcriptomics, and metabolomics). The dataset was filtered to include variables exhibiting significant root microbiome effects (ANOVA P value ≤0.05). Boxplots for the variables mapped to three SOM clusters. The OTU accumulation in these clusters was enriched in a specific bacterial group; clusters 7 and 11 accumulated OTUs related to Pseudomonadales, while cluster 9 accumulated one OTU related to Bacillales. The complete set of SOM clusters can be found in SI Appendix, Fig. S15 and the SOM classification of integrated data can be found in Dataset S5.
Fig. 6.
Fig. 6.
Proposed model for the SIREM root–root signaling pathway resulting in systemic root exudation. Specific root bacterial populations colonizing the local root induce systemic root exudation of metabolites. For example, Pseudomonadales (brown circles) and Bacillales (green circles) are associated with secretion of ferulic acid hexose (structure in brown box) and the acylsucrose S4:19 (6, 6, 5, 2) (green box), respectively. Local root microbiome also induces accumulation of azelaic acid glycosides (mono- or diglycosylated; structures in blue) in plants. Azelaic acid glycosides are potential signaling metabolites (blue dashed arrows) triggering the SIREM process while the aglycone form of azelaic acid is a SIREM exudate component. In nature, SIREM represents a long-distance communication between unshared microhabitats of a plant rhizosphere. SIREM is triggered by a microbial population at a specific root zone; the signal likely reaches the shoot (e.g., AzA-Hex) and descends to unshared areas of the root, inducing systemic exudation that finally mediates rhizosphere interactions.

Similar articles

Cited by

References

    1. Lundberg D. S., et al. , Defining the core Arabidopsis thaliana root microbiome. Nature 488, 86–90 (2012). - PMC - PubMed
    1. Herrera Paredes S., Lebeis S. L., Giving back to the community: Microbial mechanisms of plant–soil interactions. Funct. Ecol. 30, 1043–1052 (2016).
    1. Ofek-Lalzar M., et al. , Niche and host-associated functional signatures of the root surface microbiome. Nat. Commun. 5, 4950 (2014). - PubMed
    1. Schlaeppi K., Dombrowski N., Oter R. G., Ver Loren van Themaat E., Schulze-Lefert P., Quantitative divergence of the bacterial root microbiota in Arabidopsis thaliana relatives. Proc. Natl. Acad. Sci. U.S.A. 111, 585–592 (2014). - PMC - PubMed
    1. Bulgarelli D., et al. , Structure and function of the bacterial root microbiota in wild and domesticated barley. Cell Host Microbe 17, 392–403 (2015). - PMC - PubMed

Publication types