. 2020 Feb 18;117(7):3828-3838.
doi: 10.1073/pnas.1914247117. Epub 2020 Feb 3.

Protection of cochlear synapses from noise-induced excitotoxic trauma by blockade of Ca2+-permeable AMPA receptors

Affiliations

Protection of cochlear synapses from noise-induced excitotoxic trauma by blockade of Ca2+-permeable AMPA receptors

Ning Hu et al. Proc Natl Acad Sci U S A. .

Abstract

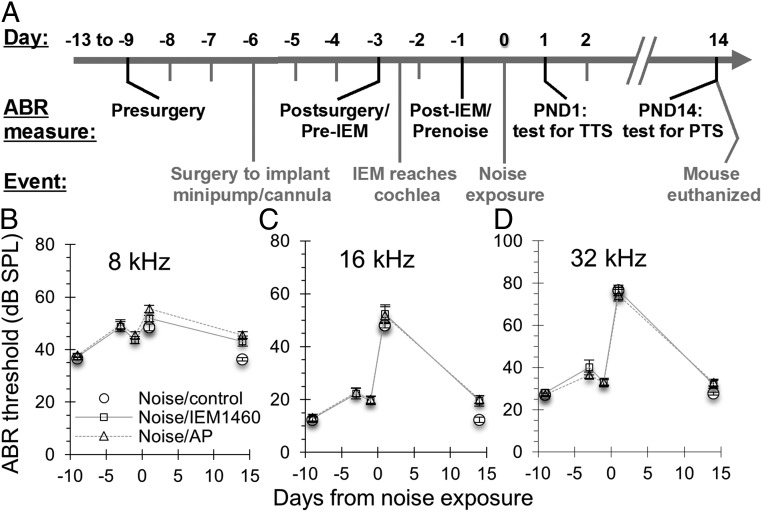
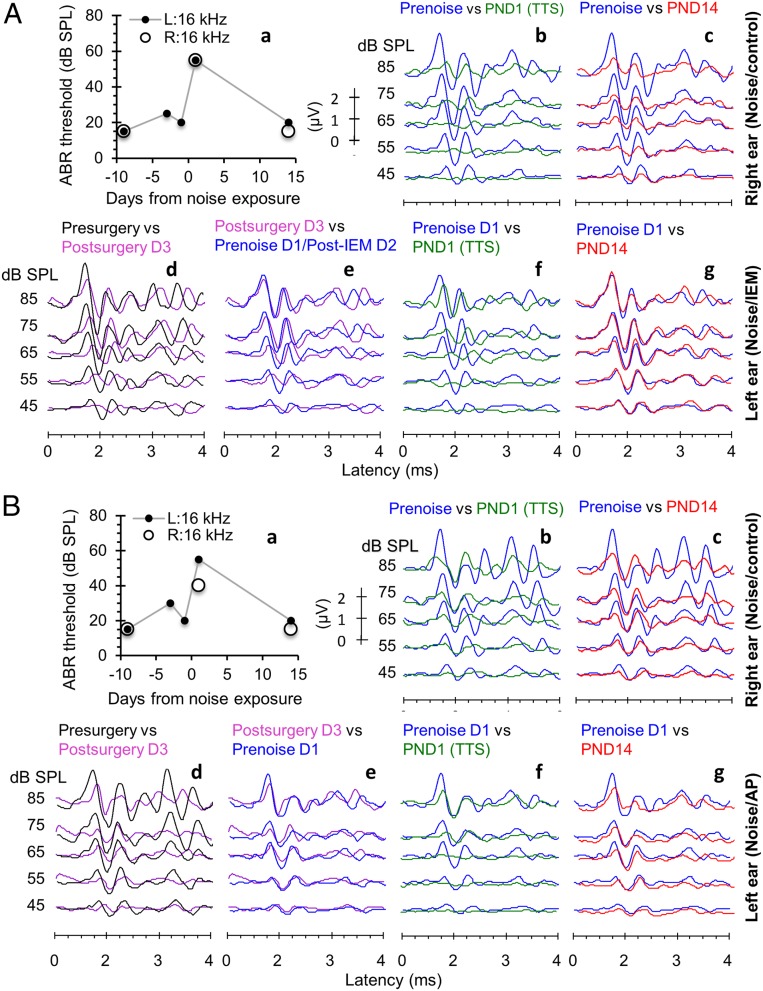
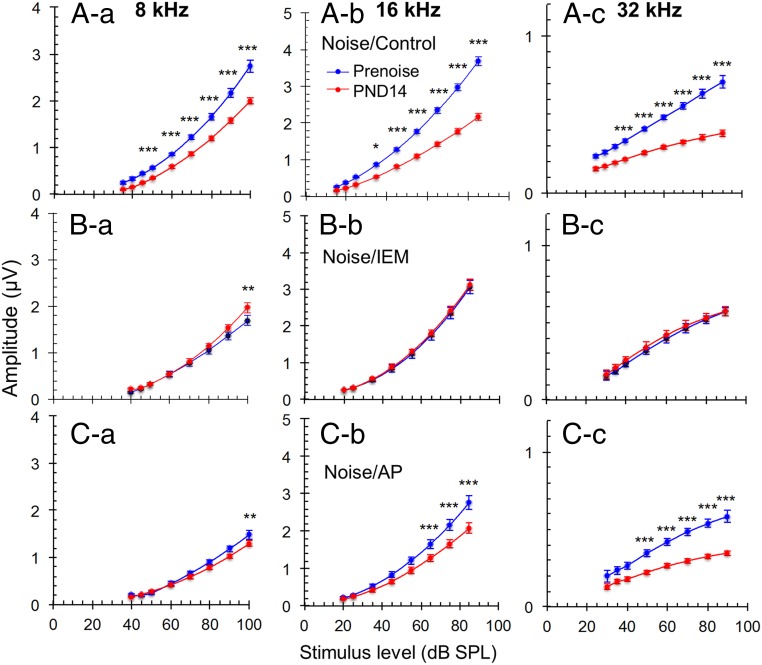
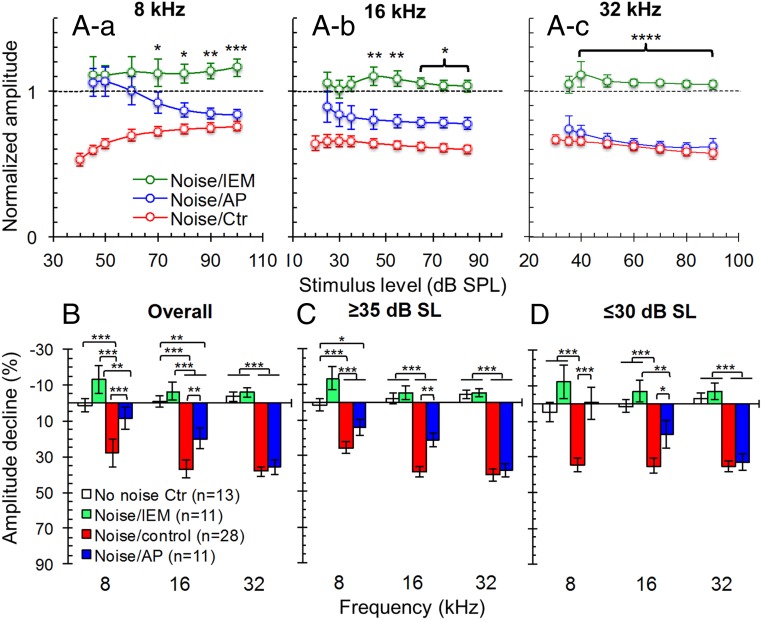
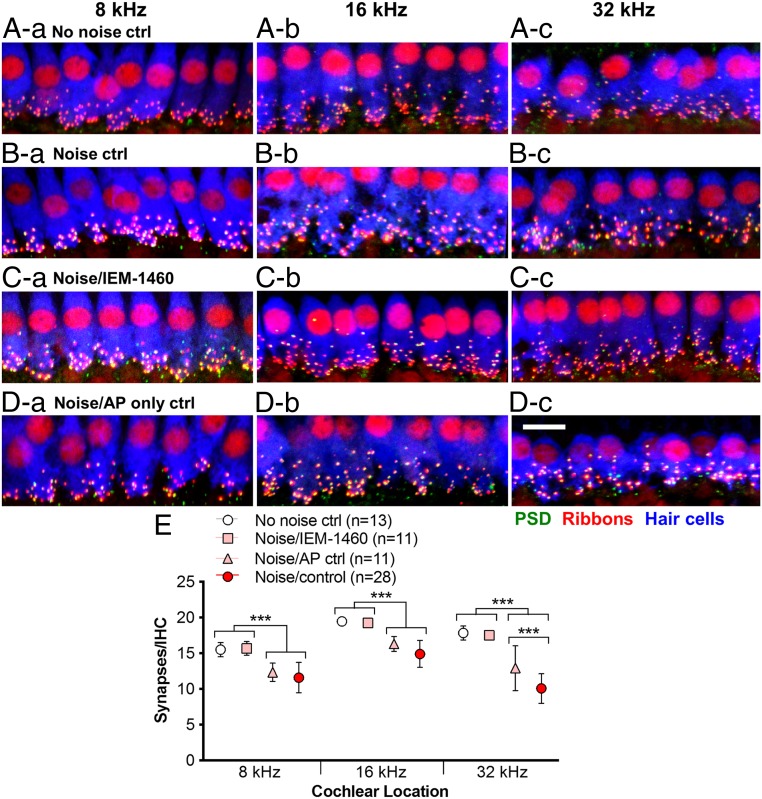
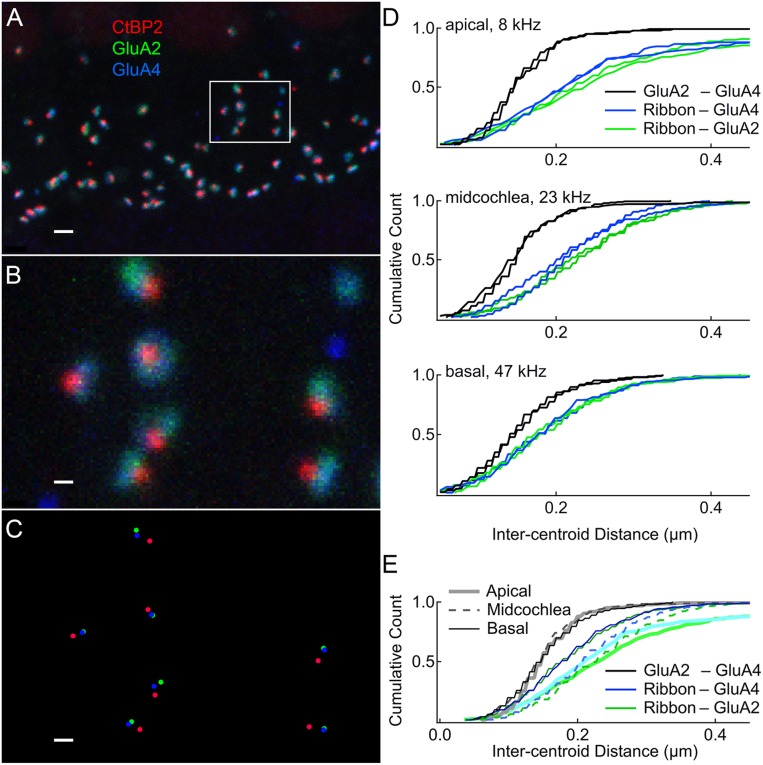
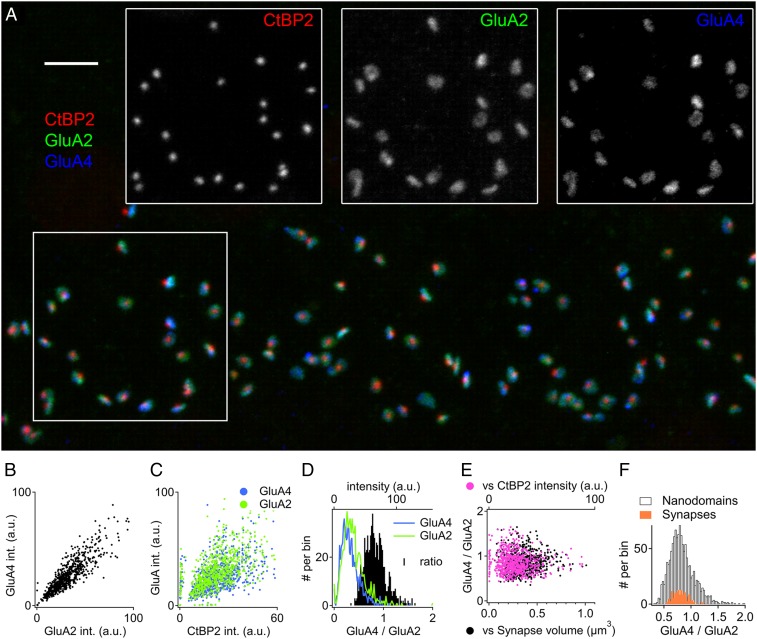
Exposure to loud sound damages the postsynaptic terminals of spiral ganglion neurons (SGNs) on cochlear inner hair cells (IHCs), resulting in loss of synapses, a process termed synaptopathy. Glutamatergic neurotransmission via α-amino-3-hydroxy-5-methylisoxazole-4-propionic acid (AMPA)-type receptors is required for synaptopathy, and here we identify a possible involvement of GluA2-lacking Ca2+-permeable AMPA receptors (CP-AMPARs) using IEM-1460, which has been shown to block GluA2-lacking AMPARs. In CBA/CaJ mice, a 2-h exposure to 100-dB sound pressure level octave band (8 to 16 kHz) noise results in no permanent threshold shift but does cause significant synaptopathy and a reduction in auditory brainstem response (ABR) wave-I amplitude. Chronic intracochlear perfusion of IEM-1460 in artificial perilymph (AP) into adult CBA/CaJ mice prevented the decrease in ABR wave-I amplitude and the synaptopathy relative to intracochlear perfusion of AP alone. Interestingly, IEM-1460 itself did not affect the ABR threshold, presumably because GluA2-containing AMPARs can sustain sufficient synaptic transmission to evoke low-threshold responses during blockade of GluA2-lacking AMPARs. On individual postsynaptic densities, we observed GluA2-lacking nanodomains alongside regions with robust GluA2 expression, consistent with the idea that individual synapses have both CP-AMPARs and Ca2+-impermeable AMPARs. SGNs innervating the same IHC differ in their relative vulnerability to noise. We found local heterogeneity among synapses in the relative abundance of GluA2 subunits that may underlie such differences in vulnerability. We propose a role for GluA2-lacking CP-AMPARs in noise-induced cochlear synaptopathy whereby differences among synapses account for differences in excitotoxic susceptibility. These data suggest a means of maintaining normal hearing thresholds while protecting against noise-induced synaptopathy, via selective blockade of CP-AMPARs.

Keywords: Ca2+-permeable AMPA receptor; cochlear synapse; excitotoxicity; noise-induced synaptopathy; spiral ganglion neuron.


Conflict of interest statement

Competing interest statement: A provisional patent application titled “Targeting Calcium-Permeable AMPA Receptors for Inner Ear Therapy with IEM-1460 and Related Compounds” was filed on 23 December 2019. Some data presented in this paper was cited in the application.

Figures

Fig. 1.
Fig. 1.
In vivo assessment of IEM-1460. (A) Timeline for the noise exposure experiments showing times relative to noise exposure (day 0) for five ABR measures: (1) presurgery, to verify normal hearing; (2) postsurgery but before IEM-1460 reaching the cochlea, to determine any effect of surgery on the ABR; (3) prenoise/post–IEM-1460 reaching the cochlea, to determine any effect of IEM-1460 on the ABR and to establish a prenoise baseline for normalizing subsequent measures; (4) at 1 d postnoise, to measure temporary threshold shift; and (5) at 10 to 14 d postnoise, to ensure that there was no permanent threshold shift. (BD) Measure of ABR thresholds (mean ± SEM) at 8, 16, and 32 kHz for each of the five timepoints shown in A (only three timepoints for unoperated controls) for ears perfused with IEM-1460 (n = 11; representative example in Fig. 2A), with control vehicle (AP; n = 11; representative example in Fig. 2B), or unoperated controls (contralateral ears and six other mice; n = 28; representative examples in Fig. 2 A and B). The threshold elevation at day −1 is not significantly different between control mice receiving AP only and mice receiving AP with IEM-1460 (P = 0.3493, P > 0.9999, and P = 0.2997, respectively, for 8, 16, and 32 kHz; Student’s t test). These data show a mean threshold shift of ∼35 dB for 16-kHz tone bursts between 1 d prenoise and 1 d postnoise for operated ears and unoperated control ears.
Fig. 2.
Fig. 2.
Representative examples of ABR thresholds and waveforms for perfused and contralateral unoperated ears of two mice. Latency is in milliseconds. In all experiments, the operated ear of each mouse was the left ear, and the unoperated control ear was the right ear. Both ears were exposed identically to noise, but only the left ear was perfused. (A) IEM-1460 perfused mouse. (B) Control AP perfused mouse. (a) Auditory thresholds for 16-kHz tone bursts for the left and right ears from a mouse receiving IEM-1460 or AP control, recorded at the time points shown in Fig. 1A. (bg) ABR waveforms from 85 to 45 dB SPL are shown for the unoperated (right) ears (b, c) and for the perfused (left) ears (dg) for the indicated time points. Prenoise comparisons show an ∼10 dB threshold elevation at 3 d postsurgery relative to presurgery (a and d). The minipump contents enter the cochlea at ∼3.5 d postsurgery. Day −1 (1 d prenoise) is 5 d postsurgery, ∼1.5 d after IEM-1460 (or control AP) enters the cochlea. By day −1, the ABR threshold and wave-I amplitude have recovered to near presurgery values (a and e), showing recovery from surgery and demonstrating that IEM-1460 itself has no significant effect on the auditory nerve response (see text). Postnoise comparisons show that a TTS due to noise exposure is equally evident in both ears as ABR thresholds elevated by ∼35 dB (a) and ABR amplitudes reduced on PND1 (b and f). By PND14, ABR thresholds have recovered to the prenoise level in both ears (a). ABR wave-I amplitude has recovered to the prenoise level in the noise/IEM-1460 ear (A, g) but not in the noise/AP ear (B, g) or in the noise/control (right) ears (A, c and B, c), consistent with the conclusion that IEM-1460 prevented synaptopathy in this ear.
Fig. 3.
Fig. 3.
IEM-1460 prevents noise-induced long-term reduction in ABR wave-I amplitude. Shown are ABR wave-I amplitude measurements (“growth curves”) made in the same mice, prenoise (blue) and at 14 d postnoise (PND14; red) for 8-kHz (a), 16-kHz (b), and 32-kHz (c) tone bursts at indicated sound levels. (A) Noise-exposed unoperated control (noise/control; n = 28). (B) Noise-exposed IEM-treated (noise/IEM; n = 11). (C) Noise-exposed vehicle-only control (noise/AP, n = 11). Data are mean ± SEM. The curves were constructed by fitting the data (by least squares) to a second-order polynomial. The significance of amplitude differences between prenoise and PND14 measures at each stimulus level was as shown: *P < 0.05, **P < 0.01, ***P < 0.001, repeated-measures two-way ANOVA over all stimulus levels and prenoise vs. PND14, Sidak’s multiple comparisons test. The overall difference between each pair of curves, prenoise vs. PND14, was derived from the repeated-measures ANOVA. Significant differences between prenoise and PND14 measures were found for Figures A, ac and C, b and c; that is, in noise-exposed control mice and for noise-exposed mice treated only with AP, there was a significant decline in ABR wave-I amplitude at 14 d after noise exposure, but in noise-exposed, IEM-1460–treated mice, there was no difference in the ABR wave-I growth curve at 14 d postnoise.
Fig. 4.
Fig. 4.
IEM-1460 prevents noise-induced long-term reduction in ABR wave-I amplitude: normalized amplitude growth curves. (A) (ac) Normalized ABR wave-I amplitude growth curves for 8-kHz (a), 16-kHz (b), and 32-kHz (c) tone bursts over stimulus levels (mean ± SEM). The PND14 amplitude measure at each stimulus level (from Fig. 3) for each individual mouse was normalized to the prenoise (day −1 in Fig. 1A for operated ears) measure for that mouse to provide a within-subject comparison. A normalized value or ratio of 1 (dotted line ) indicates no change in wave-I amplitude at PND14 relative to the prenoise value. The figures compare normalized wave-I amplitudes among the noise-exposed unoperated control group (noise/Ctr), noise-exposed IEM-1460–treated group (noise/IEM), and noise-exposed vehicle-only control group (noise/AP; n = 11). Two-way ANOVA was used to test the significant differences of normalized amplitude among these groups and across stimulus levels. There is no significant difference across stimulus levels (F(5, 282) = 0.1948, P = 0.9644 at 8 kHz; F(6, 329) = 0.6437, P = 0.6952 at 16 kHz; F(5, 270) = 1.525, P = 0.1823 at 32 kHz). Differences are significant among the experimental groups (F(2, 282) = 96.53, P < 0.0001 at 8 kHz; F(2, 329) = 158.8, P < 0.0001 at 16 kHz; F(2, 270) = 196.6, P < 0.0001 at 32 kHz) with Sidak’s post hoc test for multiple comparisons. Significant differences at each stimulus intensity between noise/IEM and noise/AP are indicated in the figure by asterisks. *P < 0.05, **P < 0.01, ***P < 0.001, ****P = 0.0001. (BD) The overall average amplitude decline at PND14 over the range of stimulus intensities was calculated by averaging the amplitude declines of all stimulus intensities exceeding threshold. These overall declines in the normalized PND14 amplitudes for all stimulus levels, expressed as percentage [= 100% × ((prenoise amplitude – PND14 amplitude)/prenoise amplitude)] are shown in B. The percentage amplitude declines for responses only to high-intensity stimuli, ≥35 dB SL (i.e., stimulus level relative to ABR threshold), are shown in C; the percentage amplitude declines for responses only to low-intensity stimuli, ≤30 dB SL, are shown in D. Results were similar for responses to high- and low-intensity stimuli. Significance of differences was determined by two-way ANOVA over all conditions with Tukey’s post hoc test for multiple comparisons. *P < 0.05, **P < 0.01, ***P < 0.001. Because the noise/AP ≥35 dB SL at 32 kHz results did not pass a D’Agostino–Pearson normality test, a Kruskal–Wallis test with Dunn’s multiple comparisons test was applied (P < 0.0001). Noise/IEM is significantly different from noise/AP control at all three frequencies for all stimulus intensity groups, and noise/IEM is not significantly different from the no noise control at all three frequencies for all stimulus intensity groups, indicating that IEM-1460 effectively prevents noise-induced reduction in ABR wave-I amplitude.
Fig. 5.
Fig. 5.
Number of synapses surviving at 14 d postnoise exposure. (AD) Representative examples of organ of Corti whole-mount preparations from indicated regions (a, 8 kHz; b, 16 kHz; c, 32 kHz) of control or noise-exposed mouse cochleae. (A) No noise control. (B) Noise-exposed. (C) Noise-exposed/IEM-1460–treated. (D) Noise-exposed/AP. Shown are 2D Z-projections, the actual synapse counts were done on the entire three-dimensional (3D) confocal image stacks. The preparations were labeled to detect PSDs (anti-PSD95; green), presynaptic ribbons (anti-CtBP2; red), and hair cells (anti-myosin VI/anti-myosin VIIa; blue), as described in SI Appendix, Materials and Methods. Magnification is the same for all panels. (Scale bar: 10 μm.) In the examples shown here, the numbers of synapses counted were as follows: A, a, 15.1; A, b, 19.5; A, c, 17.9; B, a, 12.3; B, b, 13.5; B, c, 12.8; C, a, 14.6, C, b, 20.0; C, c, 17.0; D, a, 10.6; D, b, 16.8; D, c, 11.9. Synapse counts at the 8-, 16-, and 32-kHz locations for the indicated numbers of cochleae are summarized in E. Conditions under the same bracket are not significantly different from one another unless indicated. ***P < 0.001, two-way ANOVA over all conditions and frequencies, Tukey correction for multiple comparisons. The noise/control and noise/AP at 8 kHz groups failed a normality test, so a Kruskal–Wallis test was applied (Dunn's multiple comparisons test, P < 0.0001). Noise/IEM-1460 is significantly different from noise/AP control at all three locations and is not significantly different from the no noise control at all three locations, indicating that IEM-1460 effectively prevents noise-induced synapse loss.
Fig. 6.
Fig. 6.
Distance between ribbons and AMPAR subunits within synapses. (A) Afferent synapses between IHCs and auditory nerve fibers from the midcochlea of a P30 mouse, immunolabeled to detect presynaptic ribbon (anti-CtBP2; red), postsynaptic glutamate receptor subunit GluA2 (anti-GluA2; green), and GluA4 (anti-GluA4; blue); maximum intensity Z-projection of a confocal stack. (B) White box in A enlarged. (C) Synapse puncta in B replaced with markers showing centroids identified in three dimensions. (D) Cumulative histograms of 3D intercentroid distances between synaptic puncta in each synapse, for two images in the apical cochlea (8-kHz region; n = 285 synapses), midcochlea (23-kHz region; n = 423 synapses), and basal cochlea (47-kHz region; n = 381 synapses). GluA2-GluA4, black; Ribbon-GluA2, green; Ribbon-GluA4, blue. (E) For comparison of cochlear tonotopic regions, the overall distributions from apical, midcochlear, and basal regions (thick, dashed, and thin lines, respectively). Same colors as in D. (Scale bars: 5 µm in A; 0.3 µm in B and C.)
Fig. 7.
Fig. 7.
Heterogeneous abundance of AMPAR subunits among and within synapses. (A) Afferent synapses between IHCs and auditory nerve fibers from the midcochlea of a P30 mouse, labeled with antibodies to the presynaptic ribbon (anti-CtBP2; red), the postsynaptic glutamate receptor subunit GluA2 (anti-GluA2; green), and GluA4 (anti-GluA4; blue). Individual channels are shown in gray scale for the region of interest in the white box. (Scale bar: 3 µm.) Maximum intensity projection. (B) Fluorescence intensity (in arbitrary units, a.u.) of GluA4 (y-axis) vs. GluA2 (x-axis) showing that the relative abundance of AMPAR subunits per synapse was positively correlated over a >10-fold range. (C) Fluorescence intensity of GluA4 (blue) or GluA2 (green) vs. CtBP2 intensity. (D) Distributions of intensity per synapse for GluA4 (blue) and GluA2 (green, top axis). The GluA4/GluA2 ratio per synapse ranged from <0.5 to >1.5 (black, bottom axis). (E) GluA4/GluA2 ratio as a function of CtBP2 intensity (magenta, top axis) or overall synapse volume (black, bottom axis). Data are pooled from three images centered at 23-, 30-, and 45-kHz cochlear locations; n = 745 synapses. (F) For the image presented in A, comparison of GluA4/GluA2 ratios among synapses (solid orange columns; n = 138 synapses) and within synapses (open black columns; n = 1,242 nanodomains).

Similar articles

Cited by

References

    1. Safieddine S., El-Amraoui A., Petit C., The auditory hair cell ribbon synapse: From assembly to function. Annu. Rev. Neurosci. 35, 509–528 (2012). - PubMed
    1. Rutherford M. A., Moser T., “The ribbon synapse between type I spiral ganglion neurons and inner hair cells” in The Primary Auditory Neurons of the Mammalian Cochlea, Dabdoub A., Fritzsch B., Popper A. N., Fay R. R., Eds. (Springer, New York, 2016), pp. 117–156.
    1. Kujawa S. G., Liberman M. C., Adding insult to injury: Cochlear nerve degeneration after “temporary” noise-induced hearing loss. J. Neurosci. 29, 14077–14085 (2009). - PMC - PubMed
    1. Lin H. W., Furman A. C., Kujawa S. G., Liberman M. C., Primary neural degeneration in the guinea pig cochlea after reversible noise-induced threshold shift. J. Assoc. Res. Otolaryngol. 12, 605–616 (2011). - PMC - PubMed
    1. Pujol R., Lenoir M., Robertson D., Eybalin M., Johnstone B. M., Kainic acid selectively alters auditory dendrites connected with cochlear inner hair cells. Hear. Res. 18, 145–151 (1985). - PubMed

Publication types