. 2020 Feb 18;117(7):3819-3827.
doi: 10.1073/pnas.1920403117. Epub 2020 Feb 3.

Synaptotagmin 1 oligomers clamp and regulate different modes of neurotransmitter release

Affiliations

Synaptotagmin 1 oligomers clamp and regulate different modes of neurotransmitter release

Erica Tagliatti et al. Proc Natl Acad Sci U S A. .

Abstract

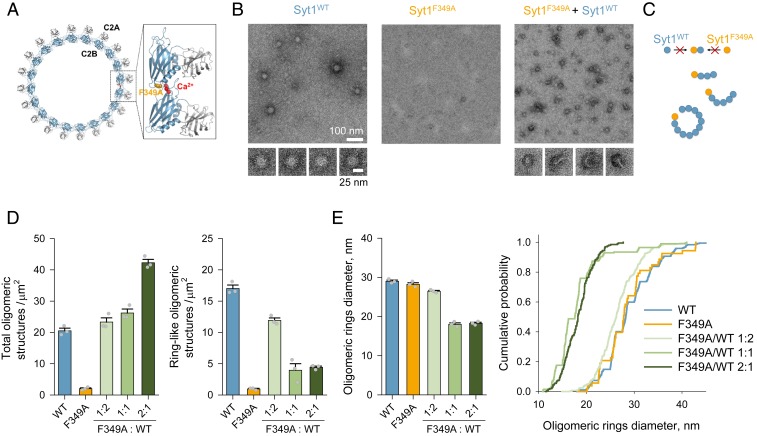
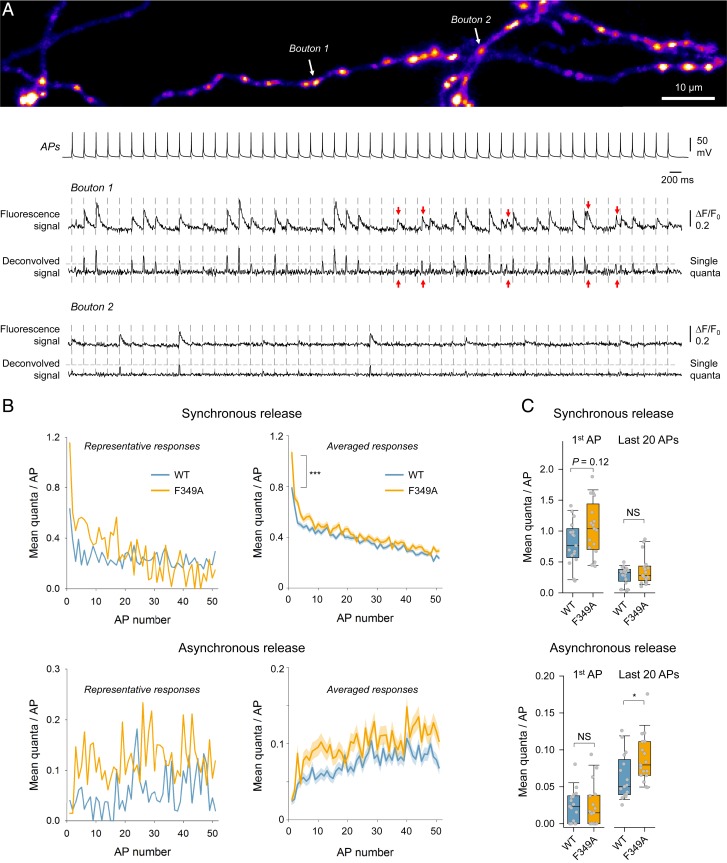
Synaptotagmin 1 (Syt1) synchronizes neurotransmitter release to action potentials (APs) acting as the fast Ca2+ release sensor and as the inhibitor (clamp) of spontaneous and delayed asynchronous release. While the Syt1 Ca2+ activation mechanism has been well-characterized, how Syt1 clamps transmitter release remains enigmatic. Here we show that C2B domain-dependent oligomerization provides the molecular basis for the Syt1 clamping function. This follows from the investigation of a designed mutation (F349A), which selectively destabilizes Syt1 oligomerization. Using a combination of fluorescence imaging and electrophysiology in neocortical synapses, we show that Syt1F349A is more efficient than wild-type Syt1 (Syt1WT) in triggering synchronous transmitter release but fails to clamp spontaneous and synaptotagmin 7 (Syt7)-mediated asynchronous release components both in rescue (Syt1-/- knockout background) and dominant-interference (Syt1+/+ background) conditions. Thus, we conclude that Ca2+-sensitive Syt1 oligomers, acting as an exocytosis clamp, are critical for maintaining the balance among the different modes of neurotransmitter release.

Keywords: C2B domain; fusion clamp; synaptic transmission; synaptotagmin.


Conflict of interest statement

The authors declare no competing interest.

Figures

Fig. 1.
Fig. 1.
Dominant effect of F349A mutation on Syt1 oligomerization. (A) Reconstruction of the Syt1 ring-like oligomers shows that the interaction of the C2B domains (blue) drives the oligomerization, with the Ca2+-binding loops (red) locating to the dimer interface. The F349A mutation designed to disrupt oligomerization (15) is shown in orange. (B and C) Negative-stain EM analysis shows that Syt1F349A by itself does not form oligomeric structures, and when mixed with Syt1WT (1:1 molar ratio) dominantly interferes with the formation of Syt1 oligomeric rings (B), likely by acting as a chain terminator of the polymerization reaction (C). (D) Syt1F349A, when mixed with Syt1WT, increases the total number of oligomeric structures (Left) but critically lowers the number of ring-like oligomeric structures (Right) in a dose-dependent manner. (E) The resultant oligomeric ring-like structures (in 1:1 and 2:1 Syt1F349A/Syt1WT mixtures) were smaller in size (average outer diameter ∼20 nm) as compared with ring-like oligomers observed with Syt1WT or Syt1F349A alone (∼30-nm outer diameter). Bar graphs in D and E represent mean ± SEM. The cumulative plot in E contains data on the size of ring-like particles pooled from all experiments. Detailed statistical analysis including the number of independent experiments is shown in SI Appendix, Table S1.
Fig. 2.
Fig. 2.
Disruption of Syt1 oligomerization increases release in response to single APs and abolishes clamping of Syt7-mediated asynchronous release. (A, Top) Representative sypHy fluorescence images in untransduced Syt1−/− and Syt1+/+ neurons illustrating identification of active synaptic boutons using 100-Hz stimulation of 20 APs. (A, Bottom) Representative sypHy fluorescence traces from experiments in Syt1−/− and Syt1+/+ neurons designed to determine the effect of F349A mutation on the relative RRP size (ΔF20AP), average release probability of RRP vesicles in response to a single AP (pv = ΔF1APF20AP) (18), and the asynchronous release component (ΔFasynch) (see Methods for details). (BD) Summary box-and-dot plots showing that overexpression of Syt1F349A does not change the RRP size (B) but increases pv (C) and the Syt7-mediated asynchronous release component (D) in both rescue (Syt1−/−) and dominant-interference (Syt1+/+) experiments. *P < 0.05, **P < 0.01, ***P < 0.001; NS, P > 0.2; ANOVA on ranks (B and D) and Mann–Whitney U test (C and D). Detailed statistical analysis including the number of independent experiments is reported in SI Appendix, Table S1.
Fig. 3.
Fig. 3.
Differential effects of Syt1F349A on synchronous and asynchronous release components during repetitive stimulation. (A) Representative iGluSnFR imaging experiment in control Syt1+/+ neurons, designed to detect quantal synchronous and asynchronous glutamate release events in individual synaptic boutons. (A, Top) Heatmap image revealing locations of glutamate release sites across the axonal arbor of a pyramidal neuron determined with 51 × 5-Hz stimulation (Movie S1). (A, Bottom) Traces, somatic APs, and iGluSnFR fluorescence responses from 2 representative boutons with high and low release probabilities. Corresponding deconvolved signals were used to estimate the quantal size (horizontal gray lines) and timing of release events (red arrows indicate asynchronous events). (B, Left) Mean quantal responses for synchronous (Top) and asynchronous (Bottom) release at each spike in 2 representative experiments recorded in Syt1+/+ neurons overexpressing either Syt1WT (n = 56 boutons) or Syt1F349A (n = 62 boutons). (B, Right) Responses averaged across all boutons in all recorded cells (Syt1WT, n = 1,367 boutons from 17 cells; Syt1F349A, n = 935 boutons from 17 cells; shaded areas indicate SEM; ***P < 0.001; Mann–Whitney U test). (C) Summary plots showing the gain-of-function phenotype of the F349A mutation on synchronous release at the first spike and on asynchronous release triggered by the repetitive stimulation. Data points are mean values across all boutons (∼30 to 100 range) in each recorded cell. *P < 0.05; NS, P > 0.7; Mann–Whitney U test. Detailed statistical analysis including the number of independent experiments is shown in SI Appendix, Table S1.
Fig. 4.
Fig. 4.
Syt1 oligomerization is required for clamping spontaneous release. (A) Representative mEPSC traces recorded in untransduced Syt1−/− or Syt1+/+ neurons (control) and in Syt1−/− or Syt1+/+ neurons overexpressing either Syt1WT or Syt1F349A. (B and C) Quantification of the effects of Syt1WT or Syt1F349A overexpression on mEPSC frequency (B) and amplitude (C). Syt1F349A fails to rescue the Syt1-mediated clamp of spontaneous release in Syt1−/− neurons and potentiates spontaneous release in Syt1+/+ neurons, without affecting mEPSC amplitudes in all conditions. *P < 0.05, ***P < 0.001; NS, P > 0.17; Mann–Whitney U test (B) and ANOVA on ranks (C). Detailed statistical analysis including the number of independent experiments is shown in SI Appendix, Table S1.

References

    1. Kaeser P. S., Regehr W. G., Molecular mechanisms for synchronous, asynchronous, and spontaneous neurotransmitter release. Annu. Rev. Physiol. 76, 333–363 (2014). - PMC - PubMed
    1. Schneggenburger R., Rosenmund C., Molecular mechanisms governing Ca(2+) regulation of evoked and spontaneous release. Nat. Neurosci. 18, 935–941 (2015). - PubMed
    1. Südhof T. C., Neurotransmitter release: The last millisecond in the life of a synaptic vesicle. Neuron 80, 675–690 (2013). - PMC - PubMed
    1. Paddock B. E., et al. , Membrane penetration by synaptotagmin is required for coupling calcium binding to vesicle fusion in vivo. J. Neurosci. 31, 2248–2257 (2011). - PMC - PubMed
    1. Rhee J. S., et al. , Augmenting neurotransmitter release by enhancing the apparent Ca2+ affinity of synaptotagmin 1. Proc. Natl. Acad. Sci. U.S.A. 102, 18664–18669 (2005). - PMC - PubMed

Publication types

LinkOut - more resources