. 2020 Mar 2;130(3):1405-1416.
doi: 10.1172/JCI128672.

A conserved intratumoral regulatory T cell signature identifies 4-1BB as a pan-cancer target

Affiliations

A conserved intratumoral regulatory T cell signature identifies 4-1BB as a pan-cancer target

Zachary T Freeman et al. J Clin Invest. .

Abstract

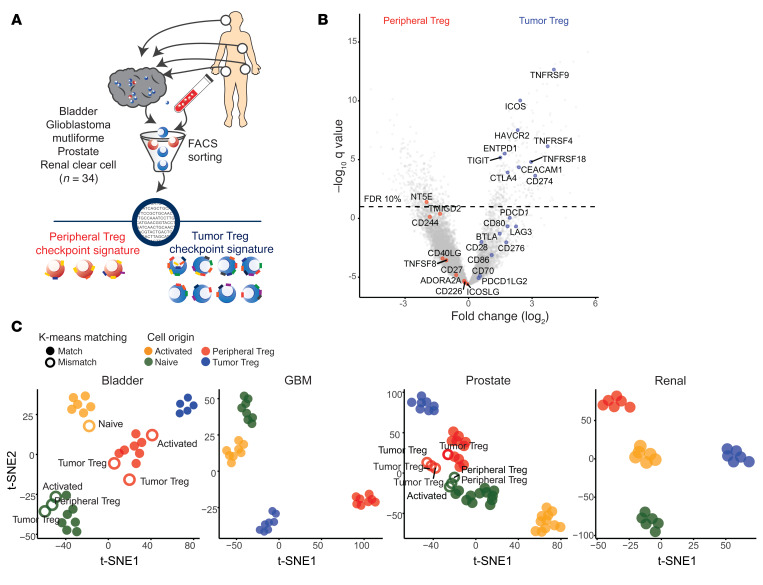
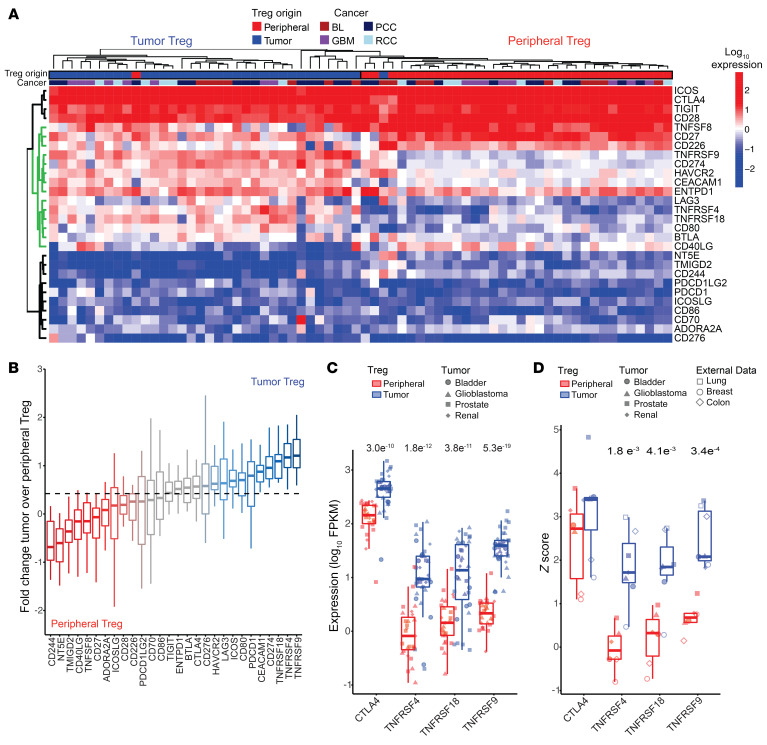
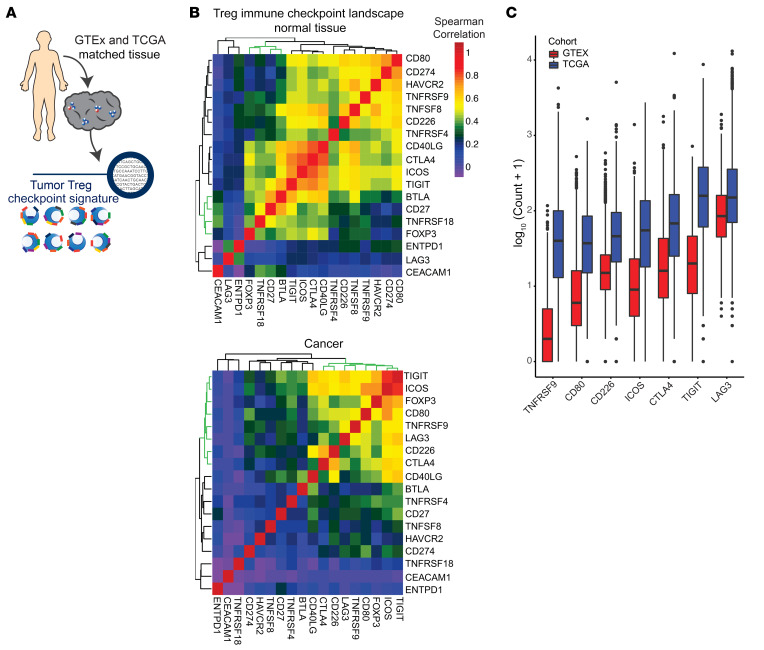
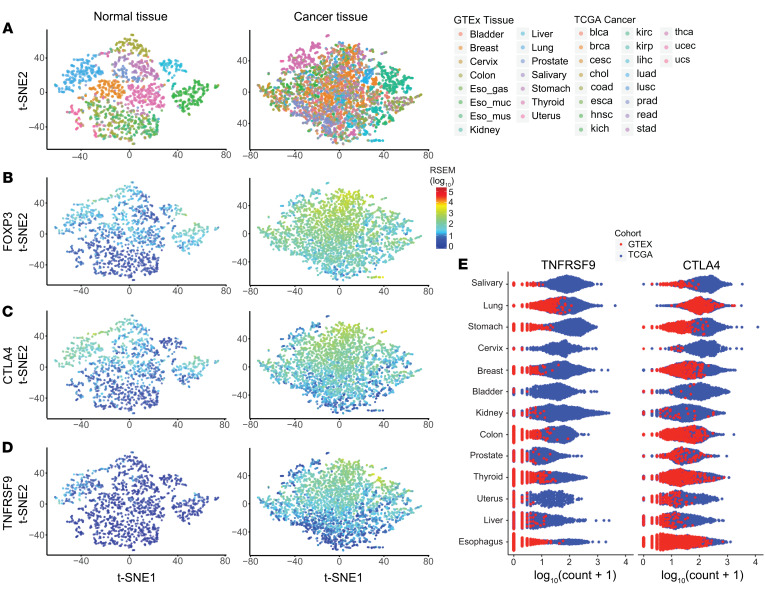
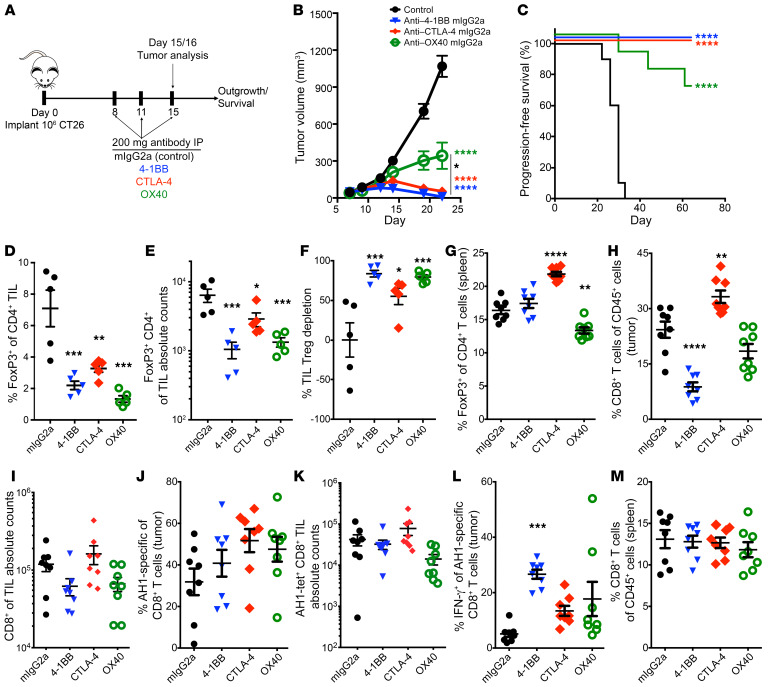
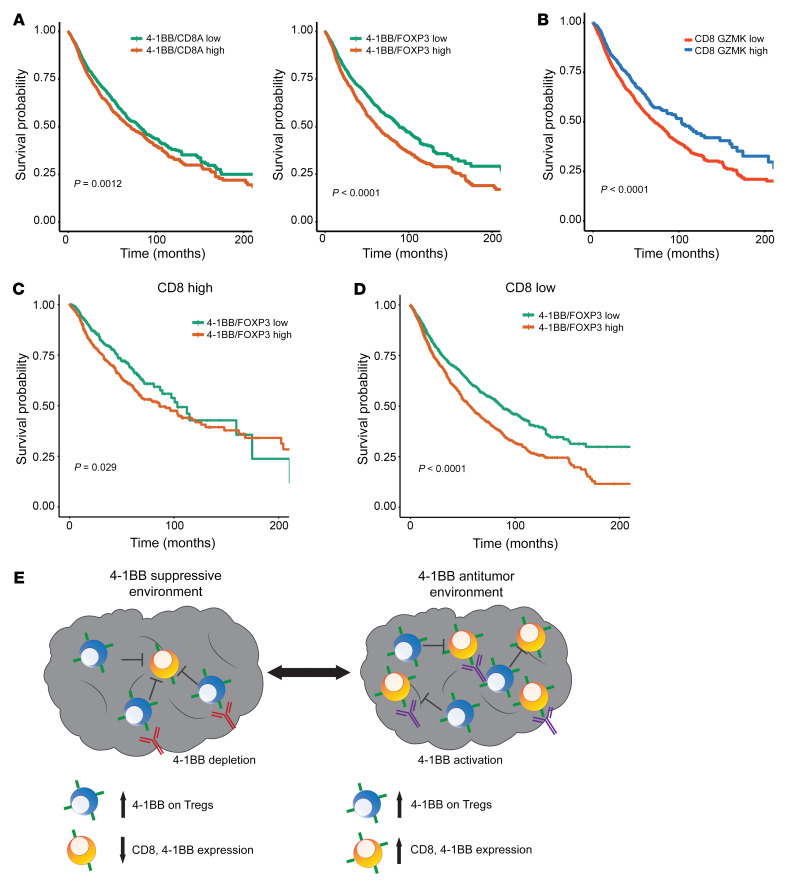
Despite advancements in targeting the immune checkpoints program cell death protein 1 (PD-1), programmed death ligand 1 (PD-L1), and cytotoxic T lymphocyte-associated protein 4 (CTLA-4) for cancer immunotherapy, a large number of patients and cancer types remain unresponsive. Current immunotherapies focus on modulating an antitumor immune response by directly or indirectly expanding antitumor CD8 T cells. A complementary strategy might involve inhibition of Tregs that otherwise suppress antitumor immune responses. Here, we sought to identify functional immune molecules preferentially expressed on tumor-infiltrating Tregs. Using genome-wide RNA-Seq analysis of purified Tregs sorted from multiple human cancer types, we identified a conserved Treg immune checkpoint signature. Using immunocompetent murine tumor models, we found that antibody-mediated depletion of 4-1BB-expressing cells (4-1BB is also known as TNFRSF9 or CD137) decreased tumor growth without negatively affecting CD8 T cell function. Furthermore, we found that the immune checkpoint 4-1BB had a high selectivity for human tumor Tregs and was associated with worse survival outcomes in patients with multiple tumor types. Thus, antibody-mediated depletion of 4-1BB-expressing Tregs represents a strategy with potential activity across cancer types.

Keywords: Cancer immunotherapy; Immunology; Immunotherapy; Oncology; T cells.


Conflict of interest statement

Conflict of interest: CGD is a coinventor on a patent for LAG-3, filing case C04255, licensed from Johns Hopkins to Bristol-Myers Squibb; has served as a paid consultant for Roche Genentech, Merck, and Novartis; and has received sponsored research funding from the Bristol-Myers Squibb International Immuno-Oncology Network and Janssen. SAT has served as a consultant for and received honoraria from Janssen, AbbVie, Sanofi, Almac Diagnostics, and Astellas/Medivation. SAT is a cofounder of, previous consultant for, equity holder in, and employee of Strata Oncology.

Figures

Figure 1
Figure 1. A conserved immune checkpoint signature differentiates peripheral and tumor Tregs across cancers.
(A) Treg immune checkpoint signatures were examined on peripheral and tumor Tregs isolated by FACS sorting from peripheral blood and tumor from patients with 1 of 4 cancer types (bladder carcinoma, n = 8; glioblastoma [GBM], n = 8; prostate carcinoma, n = 12; renal clear cell carcinoma, n = 6). (B) Differential expression analysis comparing gene expression for peripheral and tumor Tregs, with immune checkpoint genes highlighted. (C) Unsupervised clustering analysis based on immune checkpoint molecule expression in CD4 T cell subsets purified from patients with bladder cancer, glioblastoma, prostate cancer, or renal clear cell cancer. K-means clustering was used to assign T cell subtype labels based on immune checkpoint expression patterns, which were then compared with the true cell source origin. White circles represent mismatches between the k-means clustering assignment and the true cell identity; true cell identity is written adjacent to the circle.
Figure 2
Figure 2. 4-1BB is a tumor Treg-specific immune checkpoint.
(A) Immune checkpoint expression in peripheral and tumor Tregs. The green dendrogram represents immune checkpoints important for differentiating Treg origin. The top annotation row designates Treg origin and the second annotation row identifies tumor origin. (B) Log2 fold change of the ratio of tumor to peripheral Treg expression of checkpoint genes. The dashed line represents the median log2 fold change ratio for all checkpoints. (C) Peripheral and tumor Treg expression of CTLA4, ICOS, TNFRSF4 (OX40), TNFRSF18 (GITR), and TNFRSF9 (4-1BB) expression across 4 cancer types. (D) Representative Z score comparison of CTLA4, ICOS, TNFRSF4, TNFRSF18, and TNFRSF9 expression across 7 cancer types from 4 cancers acquired as a part of this study and 3 published data sets (14, 15). Statistical comparisons were performed using paired t tests to compare peripheral and tumor Tregs for each genes’ expression. Values show in C and D are P values.
Figure 3
Figure 3. Conserved Treg checkpoint landscape present in bulk sequencing of multiple cancers.
(A) Treg immune checkpoint signatures were examined by analysis of data available through TCGA and RNA-Seq performed on purified Tregs. Normalized and batch effect controlled data from GTEx and TCGA was used to examine bulk tissue checkpoint signature across normal and cancer tissue. (B) Correlation matrix of immune checkpoints and FOXP3 expression in normal tissue or cancer. The green dendrogram represents FOXP3-associated checkpoints. (C) Box plots of log10-normalized expression of Treg-correlated immune checkpoints ordered by median expression in normal tissue and cancer. All immune checkpoints were significantly higher in TCGA versus GTEx samples (P < 2 × 10–16 for GTEx vs. TCGA for each checkpoint).
Figure 4
Figure 4. 4-1BB displays tumor specificity across multiple tissues and cancer types.
(A) t-SNE clustering of FOXP3 and immune checkpoint gene expression in normal tissue and several different cancers. (B) Distribution of FOXP3 expression overlaid on cancer clustering analysis from D of immune checkpoint molecules and FOXP3 expression from 28 cancer types (n = 7608). (C and D) Expression of CLTA4 and TNFRSF9 in normal tissue and cancer. The color scale is the same as in B. (E) Expression of TNFRSF9 and CTLA4 across multiple normal and cancer tissue-matched samples demonstrating the normal and cancer landscape.
Figure 5
Figure 5. IgG2a antibody-mediated depletion of 4-1BB inhibits Tregs, leading to decreased tumor growth in mouse cancer.
(A) Schematic diagram of IgG2a treatment in murine CT26 tumor model. (B) Average median volume tumor growth (mm3) curves for mice treated as in A. (C) Kaplan-Meier survival curves for mice treated with depleting antibodies as in A. (D and E) Comparison of FOXP3+ CD4 T cells in tumor based on the percentage and absolute numbers of Tregs (n = 5/group). (F) The percentage of Treg depletion across antibody treatment conditions. (G) Splenic Treg numbers with different antibody treatments. (H and I) CD8 T cell frequency and absolute counts in tumor across treatment groups. (J and K) The percentage and absolute counts of AH1-specific CD8 T cells and (L) IFN-γ production by AH1 CD8 T cells across treatments. (M) Splenic CD8 T cell frequencies across treatment conditions. Representative example of 2 experiments. n = 10 for survival studies; n = 5–8 for flow cytometry studies. Statistical comparisons were performed using repeated-measures 2-way ANOVA with Tukey multiple comparisons test for tumor growth curve response to treatment and 1-way ANOVA with Dunnett multiple comparisons test for intratumoral analysis of different T cell populations. *P < 0.05; **P < 0.01; ***P < 0.001; ****P < 0.0001. Colored asterisks correspond to statistical comparison to control group.
Figure 6
Figure 6. Elevated Treg 4-1BB in the absence of CD8 T cells leads to decreased survival across multiple human cancers.
(A) Kaplan-Meier curve for survival based on the TNFRSF9/CD8A and TNFRSF9/FOXP3 ratio for 13 cancers from TCGA. (B) Kaplan-Meier curves based on cohorts with high or low CD8A GZMK expression. (C) Kaplan-Meier curve for TNFRSF9/FOXP3 in the cohort with high CD8A GZMK expression. (D) Kaplan-Meier curve for TNFRSF9/FOXP3 in the cohort with low CD8A GZMK expression. (E) Diagram of the different functional relationship between 4-1BB with either CD8 or Treg expression in the TME.

References

    1. Topalian SL, Drake CG, Pardoll DM. Immune checkpoint blockade: a common denominator approach to cancer therapy. Cancer Cell. 2015;27(4):450–461. doi: 10.1016/j.ccell.2015.03.001. - DOI - PMC - PubMed
    1. Zou W, Wolchok JD, Chen L. PD-L1 (B7-H1) and PD-1 pathway blockade for cancer therapy: Mechanisms, response biomarkers, and combinations. Sci Transl Med. 2016;8(328):328rv4. doi: 10.1126/scitranslmed.aad7118. - DOI - PMC - PubMed
    1. Pauken KE, Wherry EJ. Overcoming T cell exhaustion in infection and cancer. Trends Immunol. 2015;36(4):265–276. doi: 10.1016/j.it.2015.02.008. - DOI - PMC - PubMed
    1. Binnewies M, et al. Understanding the tumor immune microenvironment (TIME) for effective therapy. Nat Med. 2018;24(5):541–550. doi: 10.1038/s41591-018-0014-x. - DOI - PMC - PubMed
    1. Curiel TJ, et al. Specific recruitment of regulatory T cells in ovarian carcinoma fosters immune privilege and predicts reduced survival. Nat Med. 2004;10(9):942–949. doi: 10.1038/nm1093. - DOI - PubMed

Publication types

MeSH terms

Substances