. 2020 Feb 3;11(1):676.
doi: 10.1038/s41467-020-14406-w.

Two-stage electro-mechanical coupling of a KV channel in voltage-dependent activation

Affiliations

Two-stage electro-mechanical coupling of a KV channel in voltage-dependent activation

Panpan Hou et al. Nat Commun. .

Abstract

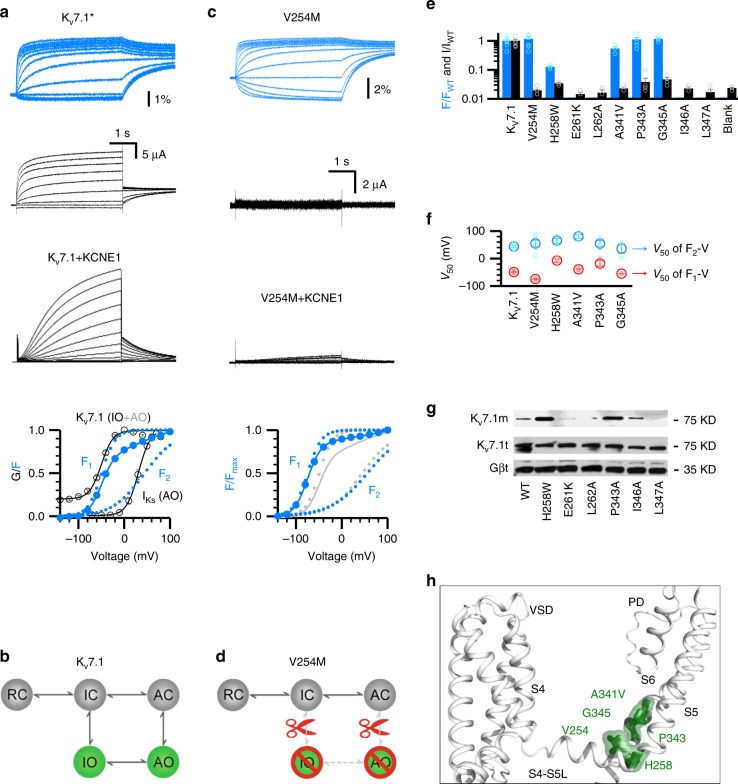
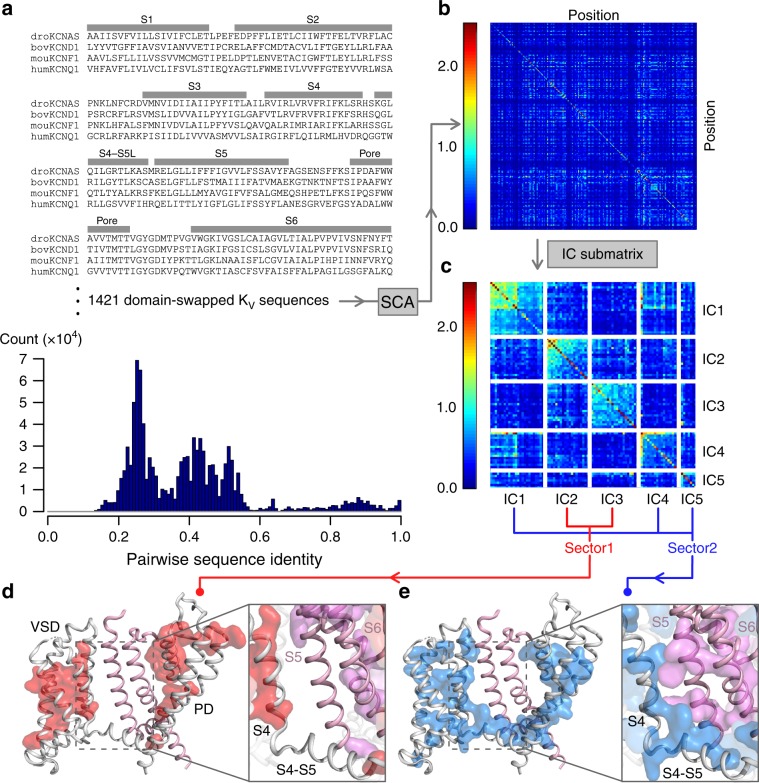
In voltage-gated potassium (KV) channels, the voltage-sensing domain (VSD) undergoes sequential activation from the resting state to the intermediate state and activated state to trigger pore opening via electro-mechanical (E-M) coupling. However, the spatial and temporal details underlying E-M coupling remain elusive. Here, utilizing KV7.1's unique two open states, we report a two-stage E-M coupling mechanism in voltage-dependent gating of KV7.1 as triggered by VSD activations to the intermediate and then activated state. When the S4 segment transitions to the intermediate state, the hand-like C-terminus of the VSD-pore linker (S4-S5L) interacts with the pore in the same subunit. When S4 then proceeds to the fully-activated state, the elbow-like hinge between S4 and S4-S5L engages with the pore of the neighboring subunit to activate conductance. This two-stage hand-and-elbow gating mechanism elucidates distinct tissue-specific modulations, pharmacology, and disease pathogenesis of KV7.1, and likely applies to numerous domain-swapped KV channels.


Conflict of interest statement

J.S. and J.C. are cofounders of a startup company VivoCor LLC, which is targeting IKs for the treatment of cardiac arrhythmia. Other authors declare they have no competing interests.

Figures

Fig. 1
Fig. 1. Classic interactions are necessary for E–M coupling when the VSD transitions into the intermediate state.
a VCF recordings of pseudo-WT KV7.1* (KV7.1-C214A/G219C/C331A). KV7.1+KCNE1 currents are shown at the same scale. The F–V relationships (blue circles) are fitted with a double Boltzmann function. F1–V represents the VSD transition from resting to intermediate state; F2–V represents the VSD transition from the intermediate to activated state. G-V represents channel opening with VSD transition at both the intermediate (IO) and the activated (AO) states. b Cartoon scheme illustrating the gating mechanism of two-step VSD movements and distinct two open states. c VCF recordings of V254M in KV7.1*. V254M+KCNE1 currents are shown at the same scales. The F–V relationships of KV7.1* and V254M are shown in gray and blue, respectively. d Cartoon scheme illustrating that V254M disrupts E–M couplings for both IO and AO. e Summary of data for WT and mutant KV7.1. VSD activation (blue, percentage change in fluorescence) and pore opening (black, current amplitude) are normalized to the WT. n ≥ 3. Blank: cells not injected with channel mRNA. Data points are shown in small open circles. f V50 values for the F1–V and F2–V. n ≥ 3. Data points are shown in small open circles. g Western blot results showing the membrane (top) and total (middle) expression of some mutants that eliminated both fluorescence and ionic currents. Gβ (bottom) from total protein is shown as negative control. WT KV7.1, H258W, and P343A are shown as positive controls. h Mapping the key residues V254, H258, A341, P343, and G345 (green) onto the S4-S5L/S6c interface in the KV7.1 cryoEM structure (PDB: 5VMS). All averaged data are shown in mean±SEM. Source data are provided as a Source Data file.
Fig. 2
Fig. 2. LQTS mutation W248R specifically eliminates the E–M coupling when the VSDs adopt the activated conformation.
a, b VCF recordings of W248R in KV7.1*. W248R+KCNE1 currents are shown at the same scale. The F–V relationships of KV7.1 and W248R are shown in gray and blue, respectively. n ≥ 3. All averaged data are shown in mean±SEM. c Representative currents of W248R/E1R/R2E and W248R/E1R/R4E activated from −120 mV to 60 mV with 20 mV increments. Same scale for both currents. The inset shows western blot data for membrane expression of W248R/E1R/R4E. d VCF recordings of W248R/F351A. e Cartoon scheme illustrating that W248R specifically disrupts the AO E–M coupling. f Mapping the key residues at the S4-S5L/S6c interface (green, V254, H258, A341, P343, and G345) in Fig. 1, and W248 and S338 (blue) onto the KV7.1 cryoEM structure (PDB: 5VMS). Source data are provided as a Source Data file.
Fig. 3
Fig. 3. Key residues involved in the E–M coupling when the VSD adopts the activated conformation.
a A cartoon scheme to illustrate that ML277 specifically enhances AO state E–M coupling. b Currents of WT KV7.1 and W248R before and after adding 1 µM ML277. Voltage: +40 mV then returned to −40 mV. c 1 µM ML277-induced current increase on KV7.1 WT and with mutations in the VSD, S4-S5L, S5, and S6. The residues were mutated to alanine (A), tryptophan (W), or to known LQTS mutations. The dotted line shows 2X the standard error below the average current increase of WT KV7.1. Mutations that show ML277-induced current increases (mean + SEM) below the dotted line are labeled as red. N.C. mutations show little or no current. Inact. mutations show obvious c-type like inactivation. Data points are shown in small open circles. d Current ratios of IIKs/IKv7.1 (black) and IE1R/R4E/IE1R/R2E (blue) for WT and mutant KV7.1. Star indicates LQTS-associated mutations. e V50 values of G–V, F1–V, and F2–V relations for WT and mutant KV7.1 channels. Data points are shown in small open circles. f Current ratios of IIKs/IKv7.1 (black) and IE1R/R4E/IE1R/R2E (blue) for WT and the S4c mutant channels. g V50 values of G–V, F1–V, and F2–V relations for WT and S4c mutant channels. Data points are shown in small open circles. h Mapping the residues key to E–M coupling for AO state onto the KV7.1 cryoEM structure. Only part of two adjacent subunits are shown. Yellow marks the residues in the charge transfer center (CTC) F167 (F0), E170, and D202. S1–S3 are transparent in the inset for clarity. Cyan: the four residues at the S4c, the fifth gating charge H5 (without showing the surface) is in the CTC when the S4c adopts the activated conformation; blue: the thirteen residues from the ML277-screening. Pink shows eight residues from the neighboring subunit S5' and S6' from the ML277-screening. All averaged data are shown in mean±SEM. Source data are provided as a Source Data file.
Fig. 4
Fig. 4. E–M coupling interactions when the VSD adopts the activated conformation.
a, b Double mutant cycle analysis of the interaction between L251 and I268. ∆∆G = ∆G – (∆G1 + ∆G2) = 1.8 kcal/mol, which indicates interaction between the two residues. n ≥ 3. All averaged data are shown in mean ± SEM. c Double mutant cycle analysis of interactions between W248 and I268, L251 and I268, L251 and F339, M238 and L271, and L239 and L271 (∆∆G = 1.4–4.4 kcal/mol). n ≥ 3. d Mapping the five pairs of interacting residues onto the KV7.1 cryoEM structure. Color codes are the same as in Fig. 3h. Source data are provided as a Source Data file.
Fig. 5
Fig. 5. MD simulation correlates temporal sequence of VSD movement to engagement of the two-stage E–M coupling interactions.
a Interaction frequencies of KV7.1 residue pairs as observed during the MD trajectories for the KV7.1 RC, IO, AO, and AC models. Frequency threshold of 0.4 or higher is defined as indicative of interaction between two residues (see Methods). b Representations of the IO state model of a KV7.1 subunit. Inset: enlarged structures of the boxed area. Blue, residues identified as important for E–M coupling in experiments (Fig. 1c–g); gray: V255 and T265, which were identified in MD simulations, but for which mutations still show functional currents (Fig. 3c). Residue V255 was found to be important for the AO state E–M coupling (Fig. 3). Each pair of residues is represented by a black dashed line connecting their respective sidechains. c Interaction frequencies of AO model-specific (top), IO model-specific (bottom left), and in both IO and AO models (bottom right) residue pairs during the MD trajectories. d Representations of the AO (top) and IO states (bottom) models of KV7.1. An entire subunit (in gray) as well as S5' and S6' segments of an adjacent subunit (in purple) are shown with insets of enlarged structures of the boxed area. Residues important for E–M coupling in experiments (Fig. 3) and involved in residue pair interactions in MD simulations are colored similarly as in Fig. 3h: cyan, residues in S4c; blue: S4-S5L, and purple: S5 and S6 from the adjacent subunit. Residues V241 and F275, which were identified in MD simulations as possibly involved in sidechain interactions but for which mutations did not alter AO states, are colored in dark grey. Each pair of residues is represented by a black dashed line connecting their respective sidechains. e Cartoon schemes illustrating the two-stage hand-and-elbow mechanism of KV7.1 voltage-dependent activation. Only two neighboring subunits (gray and pink) are shown for clarity. Gating charges on the S4 segment are shown in orange, the hydrophobic plug F0 in the gating charge transfer center is shown in green, and the two sets of interactions are shown as yellow circles. Source data are provided as a Source Data file.
Fig. 6
Fig. 6. Statistical coupling analysis suggest conservation of the two-stage E–M coupling across domain-swapped KV superfamily.
a Sample multiple sequence alignment (MSA) containing domain-swapped KV channels (KV1-KV9) used as input for statistical coupling analysis (SCA). The bottom histogram shows counts for pairwise sequence identity between all pairs of residues within the MSA. MSA uses the nomenclature established by the HUGO Gene Nomenclature Committee (HGNC) for voltage-gated potassium channels. b SCA covariance matrix calculated by SCA (see Methods). X and Y axes indicate amino acid positions, while colors indicate the degree of covariance, with blue and red corresponding to lowest and highest degrees of covariation. c The independent component (IC) submatrix visualizes a subset of the SCA matrix (panel b) in which the residues are the highest covariant. Each IC represents a group of co-varying/co-evolving amino acids as calculated by SCA (see Methods). Axes are amino acid position numbers. Diagonal boxes indicate covariation within each IC, off-diagonal boxes indicate cross talk between ICs. Sector 1 and sector 2 were defined by combining the IC as shown (also see Methods and Supplementary Fig. 7). de Mapping sectors 1 and 2, as calculated by SCA, on the KV7.1 cryoEM structure. The main subunit is colored gray, the neighboring subunit is colored pink. Sectors 1 (d) and 2 (e) on the main subunit are colored red and blue. Insets show S4, S4-S5L of the main subunit and S5, S6 of the neighboring subunit. The respective sectors on the neighboring subunit are colored magenta in the inset. All other elements in the insets are transparent for the clarity. Source data for SCA are provided as a Source Data file.

Similar articles

Cited by

References

    1. Long SB, Campbell EB, Mackinnon R. Crystal structure of a mammalian voltage-dependent Shaker family K+ channel. Science. 2005;309:897–903. doi: 10.1126/science.1116269. - DOI - PubMed
    1. Sun J, MacKinnon R. Cryo-EM structure of a KCNQ1/CaM complex reveals insights into congenital long QT syndrome. Cell. 2017;169:1042–1050 e1049. doi: 10.1016/j.cell.2017.05.019. - DOI - PMC - PubMed
    1. Baker OS, Larsson HP, Mannuzzu LM, Isacoff EY. Three transmembrane conformations and sequence-dependent displacement of the S4 domain in shaker K+ channel gating. Neuron. 1998;20:1283–1294. doi: 10.1016/S0896-6273(00)80507-3. - DOI - PubMed
    1. Barro-Soria R, et al. KCNE1 divides the voltage sensor movement in KCNQ1/KCNE1 channels into two steps. Nat. Commun. 2014;5:3750. doi: 10.1038/ncomms4750. - DOI - PMC - PubMed
    1. Hou P, et al. Inactivation of KCNQ1 potassium channels reveals dynamic coupling between voltage sensing and pore opening. Nat. Commun. 2017;8:1730. doi: 10.1038/s41467-017-01911-8. - DOI - PMC - PubMed

Publication types

MeSH terms

Substances