. 2020 Feb 3;11(2):81.
doi: 10.1038/s41419-020-2267-9.

PABPC1-induced stabilization of BDNF-AS inhibits malignant progression of glioblastoma cells through STAU1-mediated decay

Affiliations

PABPC1-induced stabilization of BDNF-AS inhibits malignant progression of glioblastoma cells through STAU1-mediated decay

Rui Su et al. Cell Death Dis. .

Abstract

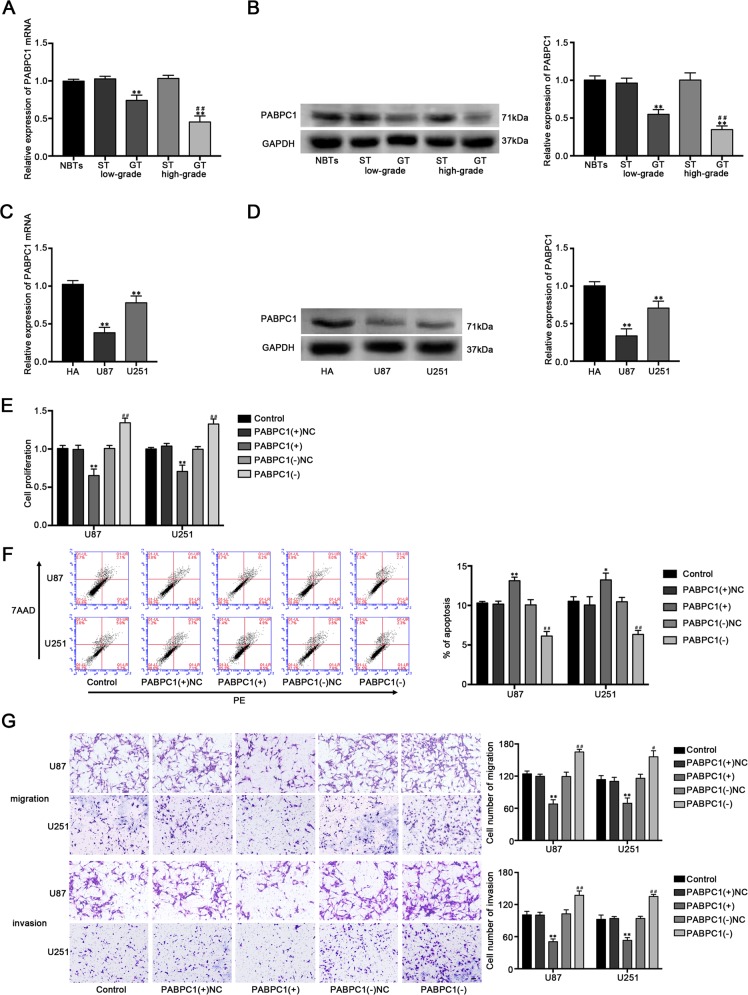
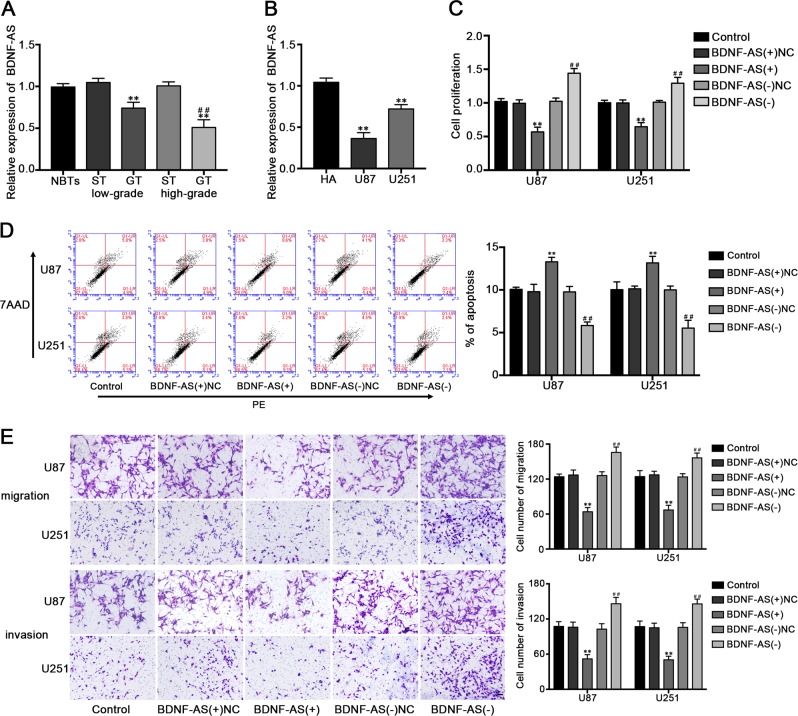
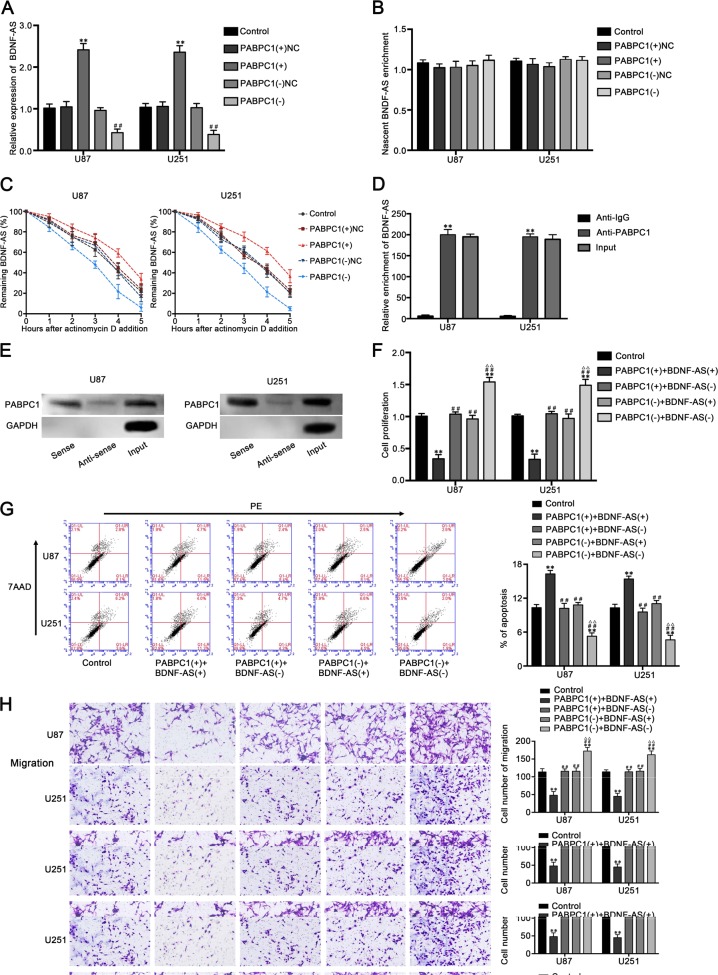
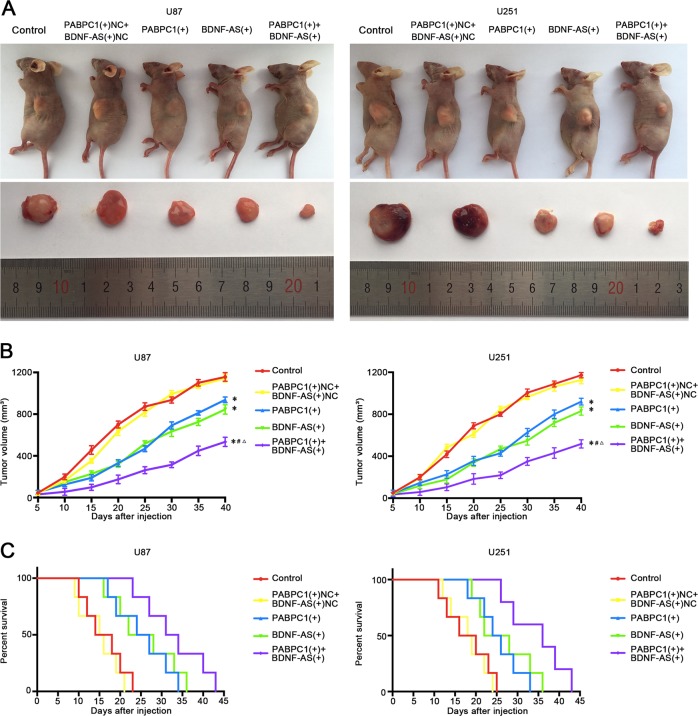
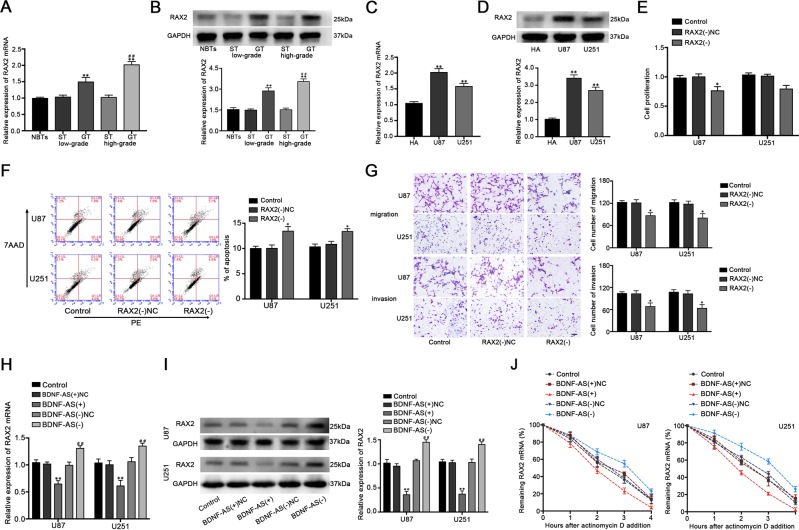
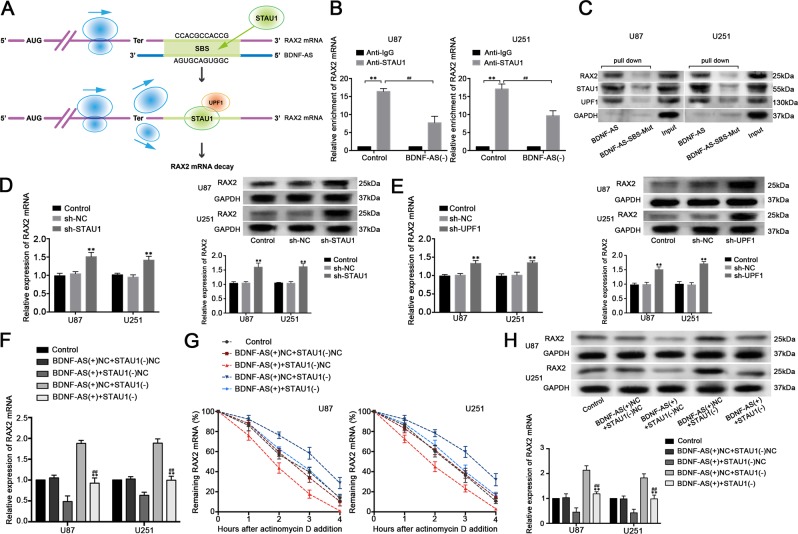
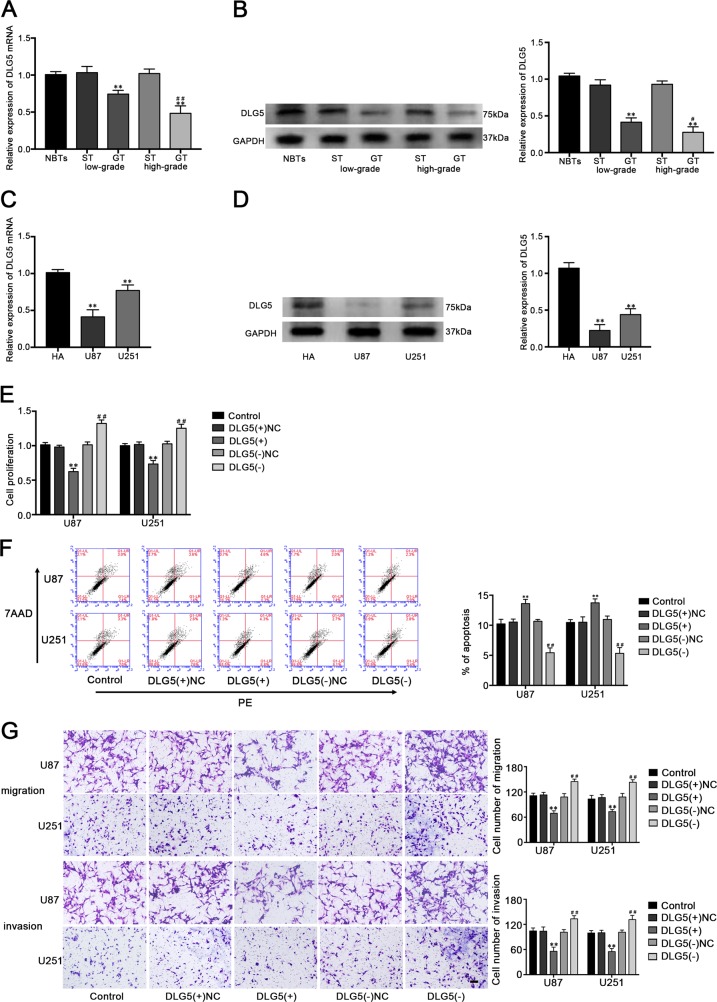
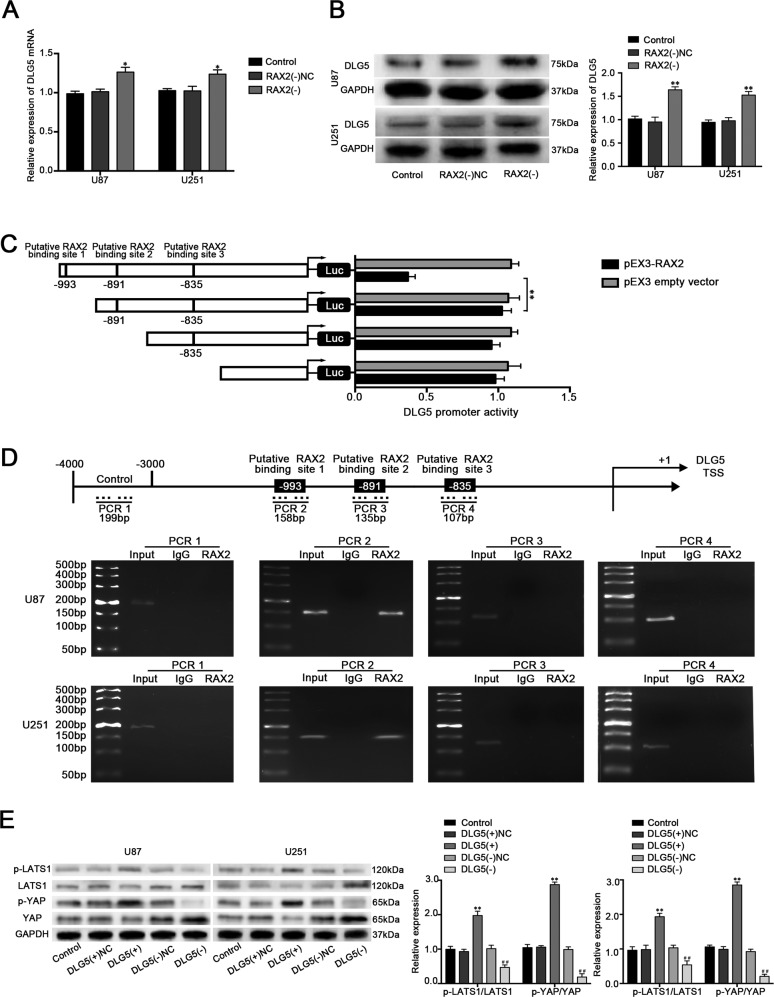
Glioblastoma is the most common and malignant form of primary central nervous tumor in adults. Long noncoding RNAs (lncRNAs) have been reported to play a pivotal role in modulating gene expression and regulating human tumor's malignant behaviors. In this study, we confirmed that lncRNA brain-derived neurotrophic factor antisense (BDNF-AS) was downregulated in glioblastoma tissues and cells, interacted and stabilized by polyadenylate-binding protein cytoplasmic 1 (PABPC1). Overexpression of BDNF-AS inhibited the proliferation, migration, and invasion, as well as induced the apoptosis of glioblastoma cells. In the in vivo study, PABPC1 overexpression combined with BDNF-AS overexpression produced the smallest tumor and the longest survival. Moreover, BDNF-AS could elicit retina and anterior neural fold homeobox 2 (RAX2) mRNA decay through STAU1-mediated decay (SMD), and thereby regulated the malignant behaviors glioblastoma cells. Knockdown of RAX2 produced tumor-suppressive function in glioblastoma cells and increased the expression of discs large homolog 5 (DLG5), leading to the activation of the Hippo pathway. In general, this study elucidated that the PABPC1-BDNF-AS-RAX2-DLG5 mechanism may contribute to the anticancer potential of glioma cells and may provide potential therapeutic targets for human glioma.


Conflict of interest statement

The authors declare that they have no conflict of interest.

Figures

Fig. 1
Fig. 1. The expression and effects of PABPC1 in glioblastoma cells.
a The PABPC1 mRNA expression levels in normal brain tissues (NBTs), low and high grades of human glioma tissues (GT), and homologous surrounding nonneoplastic tissues (ST). b The PABPC1 protein expression levels in NBTs, low and high grades of GT and homologous ST (n = 4, each group). **P < 0.01 vs. ST group; ##P < 0.01 vs. low-grade GT group. c The mRNA expression level of PABPC1 in human astrocytes (HA) and glioblastoma cell lines (U87 and U251). d The protein expression level of PABPC1 in human astrocytes (HA) and glioblastoma cell lines (U87 and U251). (n = 3, each group). **P < 0.01 vs. HA group. e The CCK-8 assay was used to measure the effect of PABPC1 on the proliferation of U87 and U251 cells. f The apoptotic percentages of U87 and U251 cells were detected after PABPC1 overexpression or knockdown. g The transwell assays were used to measure the effect of PABPC1 on cell migration and invasion of U87 and U251 cells. Scale bars represent 40 μm. (n = 5, each group). *P < 0.05 or **P < 0.01 vs. PABPC1(+) NC group; #P < 0.05 or ##P < 0.01 vs. PABPC1(−)NC group.
Fig. 2
Fig. 2. The expression and effects of BDNF-AS in glioblastoma cells.
a The relative expression levels of BDNF-AS in NBTs, low and high grades of human glioma tissues. Data are presented as the mean ± SD (n = 4, each group). **P < 0.01 vs. ST group; ##P < 0.01 vs. low-grade GT group. b The relative expression levels of BDNF-AS in HA and glioblastoma cell lines. Data are presented as the mean ± SD (n = 3, each group). **P < 0.01 vs. HA group. c Effect of BDNF-AS on the cell proliferation, cell apoptosis (d), cell migration and invasion (e) of glioblastoma cells. Scale bars represent 40 μm. (n = 5, each group). **P < 0.01 vs. BDNF-AS(+)NC group; ##P < 0.01 vs. BDNF-AS(−)NC group.
Fig. 3
Fig. 3. PABPC1 binds to BDNF-AS and stabilizes BDNF-AS.
a Expression of BDNF-AS after PABPC1 overexpression or knockdown (n = 3, each group). **P < 0.01 vs. PABPC1(+)NC group. ##P < 0.01 vs. PABPC1(−)NC group. b Identification of the newly synthesized RNA enrichment of BDNF-AS via RNA capture assay and qRT-PCR. c Half-life of BDNF-AS measured by qRT-PCR and normalized to the level of GAPDH. d RIP was performed in U87 and U251 cells and followed by qRT-PCR to detect BDNF-AS associated with PABPC1. **P < 0.01 vs. anti-IgG group. e Western blot analysis following RNA pull-down assays performed using U87 and U251 cellular exacts. f Effect of PABPC1 and BDNF-AS on cell proliferation, g apoptosis, h migration and invasion of glioblastoma cells. Scale bars represent 40 μm. (n = 5, each group). **P < 0.01 vs. control group; ##P < 0.01 vs. PABPC1(+) + BDNF-AS(+) group. ▵▵P < 0.01 vs. PABPC1(+) + BDNF-AS(−) group.
Fig. 4
Fig. 4. Tumor xenograft experiments.
a The nude mice carrying tumors from respective groups were shown and the sample tumors from respective group were shown. b Tumor growth curves were shown. Tumor volume was calculated every 5 days after injection, and the tumor was taken after 40 days. c Survival curves from respective nude mice injected into the right striatum were shown (n = 6, each group).
Fig. 5
Fig. 5. The expression and effects of RAX2 in glioblastoma cells.
a The mRNA and b protein expression level of RAX2 in NBTs, low and high grades of GT and homologous ST (n = 4, each group). **P < 0.01 vs. ST group; ##P < 0.01 vs. low-grade GT group. c The mRNA and d protein expression level of RAX2 in HA, U87, and U251 (n = 3, each group). **P < 0.01 vs. HA group. e Effect of RAX2 knockdown on the cell proliferation of U87 and U251 cells. f Effect of RAX2 knockdown on the cell apoptosis of U87 and U251 cells. g Effect of RAX2 knockdown on the cell migration and invasion of U87 and U251 cells. Scale bars represent 40 μm. (n = 5, each group). *P < 0.05 vs. RAX2(−)NC group. h Expression levels of RAX2 mRNA and I protein after BDNF-AS overexpression or knockdown (n = 3, each group). **P < 0.01 vs. BDNF-AS(+)NC group. ##P < 0.01 vs. BDNF-AS(−)NC group. j The half-life of RAX2 mRNA were estimated after BDNF-AS overexpression or knockdown (n = 3, each group).
Fig. 6
Fig. 6. BDNF-AS affects RAX2 mRNA expression and stability through SMD.
a Diagrams of the mechanism of SMD. A predicted imperfect base pairing (green) between Alu elements of RAX2 mRNA (purple) and BDNF-AS forms SBS. STAU1 (green ellipse) can recognize SBS and recruit UPF1 (orange ellipse) to trigger SMD and cause degradation of RAX2 mRNA. b Effects of BDNF-AS knockdown on the relative enrichment of RAX2 mRNA in IgG or STAU1 precipitates (n = 3, each group). **P < 0.01 vs. Anti-IgG control group. ##P < 0.01 vs. Anti-STAU1 control group. c U87 and U251 cells were transfected with biotinylated BDNF-AS (BDNF-AS) and BDNF-AS with mutational SBS (BDNF-AS-SBS-Mut), and western blot analysis following RNA pull-down assays performed using cellular exacts. d Effect of STAU1 and e UPF1 on the mRNA and protein expression of RAX2 in U87 and U251 cells (n = 3, each group). **P < 0.01 vs. sh-NC group. f Effects of the combination of overexpressed BDNF-AS and the decreased STAU1 on mRNA expression level, g stability and h protein expression level (n = 5, each group). **P < 0.01 vs. BDNF-AS(+)+STAU1(−)NC group. ##P < 0.01 vs. BDNF-AS(+)NC+STAU1(−) group.
Fig. 7
Fig. 7. Expression of DLG5 in glioma tissues and cell lines and the effects of DLG5 on glioblastoma cells.
a The mRNA and b protein expression level of DLG5 in normal and glioma tissues (n = 4, each group). **P < 0.01 vs. ST group; ##P < 0.01 vs. low-grade GT group. c The mRNA and d protein expression level of DLG5 in HA, U87 and U251 (n = 3, each group). **P < 0.01 vs. HA group. e Effect of DLG5 on the cell proliferation, f cell apoptosis, g cell migration and invasion of glioblastoma cells (n = 5, each group). **P < 0.01 vs. DLG5(+)NC group; ##P < 0.01 vs. DLG5(−)NC group.
Fig. 8
Fig. 8. RAX2 increased the expression of DLG5 by binding to the promoter of DLG5.
a The DLG5 mRNA expression after RAX2 knockdown was detected via qRT-PCR. b Western blot assay was used to detect the protein expression of DLG5 after RAX2 knockdown (n = 3, each group). **P < 0.01 vs. RAX2(−)NC group. c RAX2 affect on DLG5 promoter activity. d RAX2 bound to the promoter of DLG5 in U87 and U251 cells. Schematic representation of the human DLG5 promoter region 4000 bp upstream of the transcription start site (TSS), which was designated as +1. Putative RAX2-binding site was indicated. PCR was conducted with the resulting precipitated DNA. e Western blot assay of the p-LATS1/LATS and p-YAP/YAP expression regulated by DLG5. **P < 0.01 vs. DLG5(+)NC group; ##P < 0.01 vs. DLG5(−)NC group.

Similar articles

Cited by

References

    1. Agnihotri S, Aldape KD, Zadeh G. Isocitrate dehydrogenase status and molecular subclasses of glioma and glioblastoma. Neurosurg. Focus. 2014;37:E13. doi: 10.3171/2014.9.FOCUS14505. - DOI - PubMed
    1. Alifieris C, Trafalis DT. Glioblastoma multiforme: pathogenesis and treatment. Pharmacol. Therap. 2015;152:63–82. doi: 10.1016/j.pharmthera.2015.05.005. - DOI - PubMed
    1. Koster T, Staiger D. RNA-binding protein immunoprecipitation from whole-cell extracts. Methods Mol. Biol. 2014;1062:679–695. doi: 10.1007/978-1-62703-580-4_35. - DOI - PubMed
    1. Chen X, et al. The histone deacetylase SIRT6 suppresses the expression of the RNA-binding protein PCBP2 in glioma. Biochem. Biophys. Res. Commun. 2014;446:364–369. doi: 10.1016/j.bbrc.2014.02.116. - DOI - PubMed
    1. Uren PJ, et al. RNA-binding protein musashi1 is a central regulator of adhesion pathways in glioblastoma. Mol. Cell. Biol. 2015;35:2965–2978. doi: 10.1128/MCB.00410-15. - DOI - PMC - PubMed

Publication types

MeSH terms