. 2020 Feb 3;11(1):670.
doi: 10.1038/s41467-020-14479-7.

Balancing selection via life-history trade-offs maintains an inversion polymorphism in a seaweed fly

Affiliations

Balancing selection via life-history trade-offs maintains an inversion polymorphism in a seaweed fly

Claire Mérot et al. Nat Commun. .

Abstract

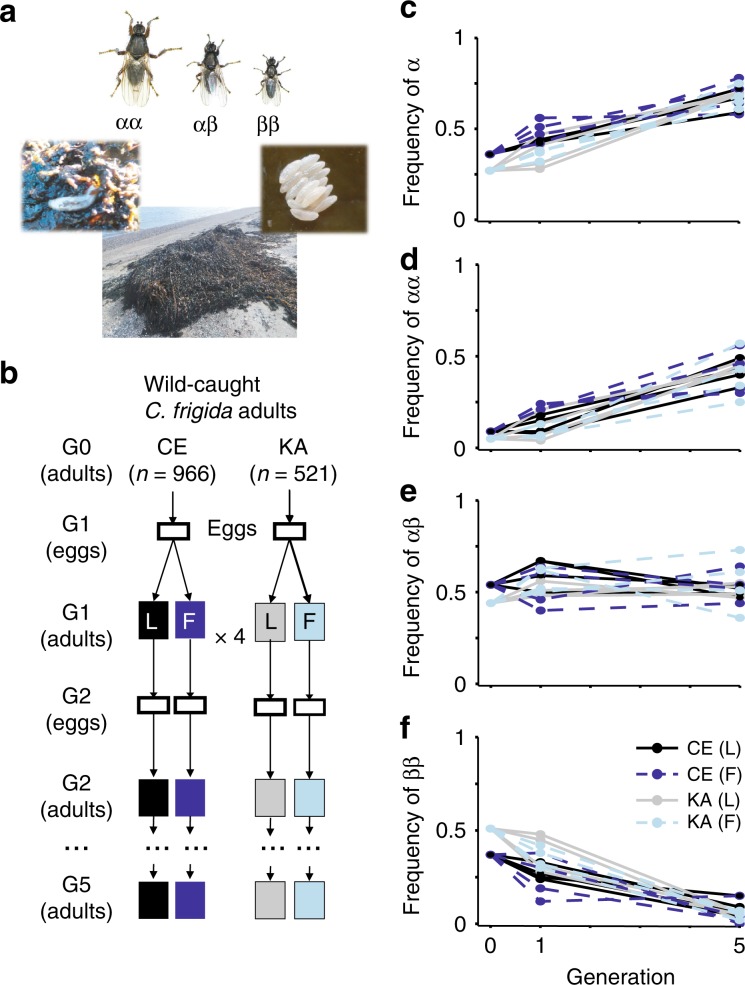
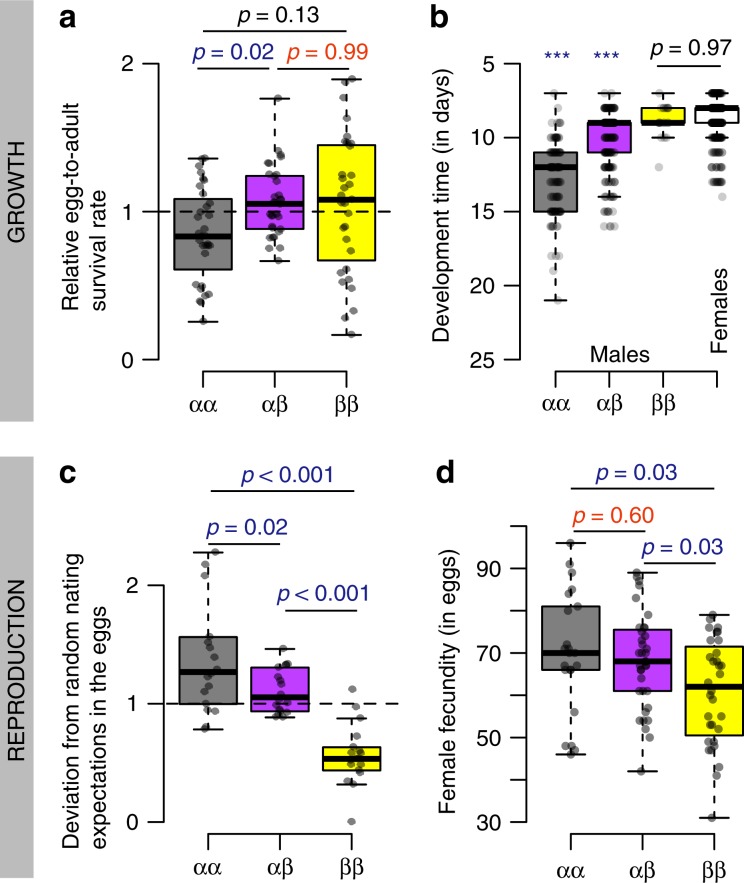
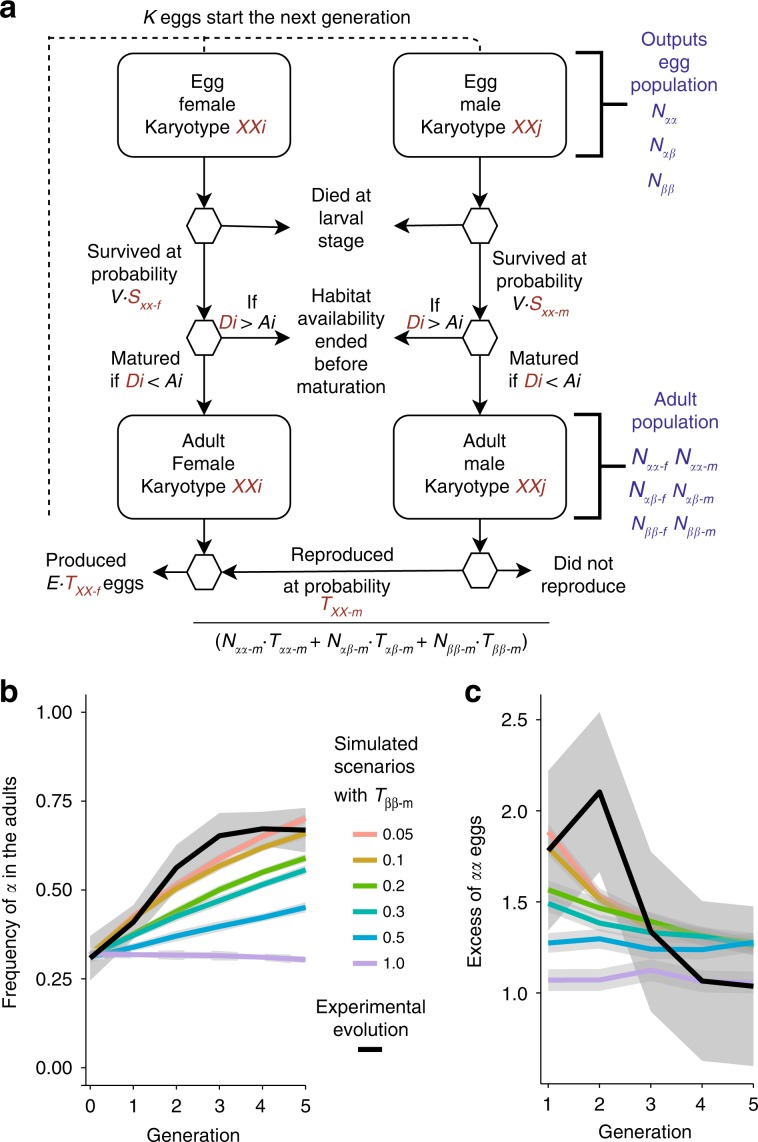
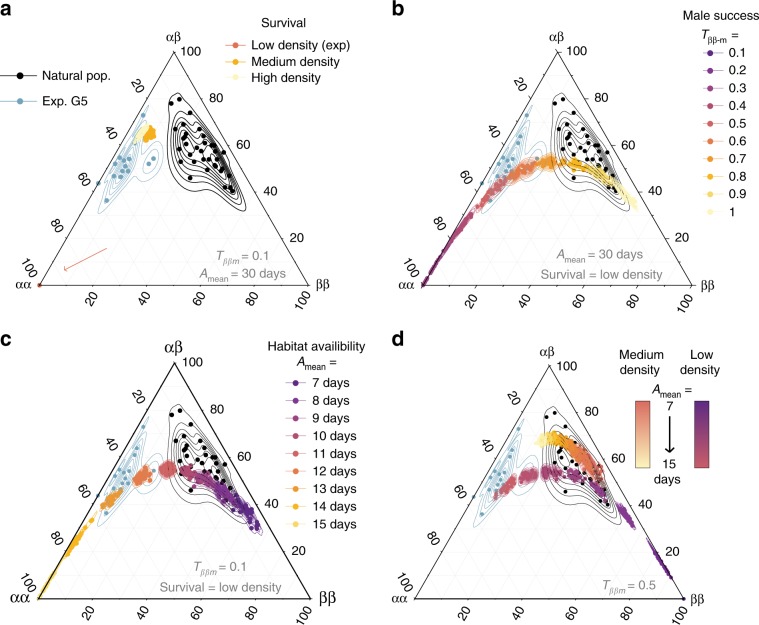
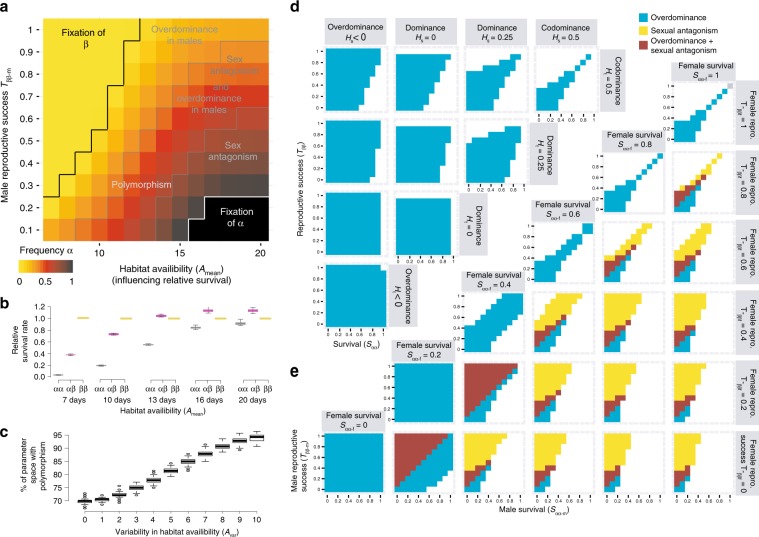
How natural diversity is maintained is an evolutionary puzzle. Genetic variation can be eroded by drift and directional selection but some polymorphisms persist for long time periods, implicating a role for balancing selection. Here, we investigate the maintenance of a chromosomal inversion polymorphism in the seaweed fly Coelopa frigida. Using experimental evolution and quantifying fitness, we show that the inversion underlies a life-history trade-off, whereby each haplotype has opposing effects on larval survival and adult reproduction. Numerical simulations confirm that such antagonistic pleiotropy can maintain polymorphism. Our results also highlight the importance of sex-specific effects, dominance and environmental heterogeneity, whose interaction enhances the maintenance of polymorphism through antagonistic pleiotropy. Overall, our findings directly demonstrate how overdominance and sexual antagonism can emerge from a life-history trade-off, inviting reconsideration of antagonistic pleiotropy as a key part of multi-headed balancing selection processes that enable the persistence of genetic variation.


Conflict of interest statement

The authors declare no competing interests.

Figures

Fig. 1
Fig. 1. In vivo experimental evolution of Coelopa frigida and inversion dynamics.
a C. frigida is a seaweed fly inhabiting seaweed wrackbeds that are accumulating and decomposing on the shoreline. Larva are exclusively restricted to this wrackbed substrate and adults are generally found crawling on or within the decomposing seaweed on which they lay eggs in clusters, although they can at times stray away from the wrackbed. Size variation in adult males is associated with the three genotypes of the inversion. Photos by C. Mérot & M. Wellenreuther. b Overview of the in-laboratory evolution experiment design. Starting with wild populations collected from two locations (CE & KA) in Québec (Canada), we raised 16 replicated experimental populations separately over five generations (denoted as G), either on a substrate dominated by Laminariaceae L or Fucaceae F. Eggs and adults were genotyped for a SNP marker associated with the inversion to infer genotype frequencies. cf Evolution of the frequency of the inversion allele α and the proportion of each karyotypes between generation 0, 1 and 5. The same trend was observed in all 16 replicates for both KA and CE origins and on both substrates. Source data are provided as a Source Data file.
Fig. 2
Fig. 2. The pleiotropic and antagonistic effects of the inversion on different components of fitness.
a Relative egg-to-adult survival rate per genotype, calculated as the deviation of each genotype’s proportion between adults and eggs (males and females were considered together). b Development time, measured as the number of days from the egg to the emerging adult for each combination of genotype and sex (the white box being developmental time for all females given that no significant difference was found between genotypes). c Deviation of genotypic proportions in the eggs relative to the proportions expected under random mating of the previous generation. d Female fecundity, measured as the number of eggs in the first clutch. Colours stands for the different inversion genotypes (αα, grey, αβ purple, ββ, yellow). Boxes indicate quartile, central line indicates the median and whiskers extend to 1.5 times the interquartile value. Overlapping points represent individual estimates per replicate. P-values, from post-hoc pairwise t-test, represent significant differences when indicated in blue and, when indicated in red, they represent non-significant differences between the heterozygotes and homozygote, suggesting dominance relationships between α and β alleles. Source data are provided as a Source Data file.
Fig. 3
Fig. 3. In silico evolution of Coelopa frigida and inversion dynamics over five generations.
a Overview of the individual-based simulation model. Each egg is characterized by a genotype and a sex, inherited in a Mendelian fashion from its parents. Eggs survive through the larval stage at a probability determined by the product of V (global viability = 0.3) and SXX-s, the relative survival rate for each combination of sex and genotype (Table 1). The larva transitions into an adult only if its development time, an individual value (Di) drawn from a distribution determined by its genotype and sex, is shorter than its individual value of habitat availability (Ai), drawn from a uniform distribution of habitat availability characterized by two parameters, mean duration (Amean) and variability (Avar). For scenarios simulating laboratory experimental conditions, Amean is set to a very large value (30 days). Adults go through a reproduction phase during which all females mate and lay a number of eggs determined by the product of the fertility parameter E (70 eggs) and TXX-f, the relative female reproductive success by genotype drawn from experimental estimate (Table 1). Male can reproduce several times. For each female, a random male is drawn from the pool of adult males at a probability TXX-m, the relative male reproductive success, determined by their genotype (Table 1), and based on the relative proportions of males in the population. The next generation starts with a subset of K eggs representing either the experimental procedure or a limited carrying capacity in nature. b, c Comparison of the evolution of α frequency and αα excess in the eggs over five generations in the experiment to simulated scenarios of in silico evolution based on experimental parameters. Data are smoothed using a loess method across four replicates per generation for experimental data and across 30 replicates per generation and per set of parameters for simulated data, and standard error of the mean bounds are represented by the grey shade. Source data are provided as a Source Data file.
Fig. 4
Fig. 4. Inversion genotype proportions under simulated scenarios of in silico evolution.
Ternary plots comparing the proportions of the three genotypes in natural populations, , after the 5th generation of our laboratory experiment and at the equilibrium after 200 generations of simulations exploring the parameter space representative of the conditions encountered by Coelopa frigida in the wild. Simulated scenario vary a the effect of density, and the related relative survival rate, b the range of values for male relative reproductive success (Tαα-m = 1, Tαβ-m = 1/2(Tαα-m + Tββ-m), Tββ-m = [0.1–1.0]), c the effect of a limited duration of the habitat availability (Amean = [7–15 days], Avar = 2 days), and d the combined effects of density and environment for moderate differences of male relative reproductive success (ββ male reproductive success Tββ-m = 0.5, i.e. two-fold lower than αα male reproductive success). Each point is either the proportion of genotypes for one natural population, one experimental replicate at G5 or the outcome of a single simulation. Lines draw a kernel density estimate for each group (natural populations, generation 5 of the experiment or each set of parameters). Source data are provided as a Source Data file.
Fig. 5
Fig. 5. Conditions of maintenance of polymorphism through antagonistic pleiotropy.
a Inversion frequencies at equilibrium and mechanisms of balancing selection emerging from the antagonistic pleiotropy, within the range of parameters explored for the Coelopa frigida wild populations. Female reproductive parameter values were based on experimental values, variability in the duration of the habitat (Avar) was set to 2 days and relative survival rates correspond to low-density conditions. b Male relative survival according to the duration of habitat availability (Amean). Values are normalized relatively to a value of 1 for ββ males. Colours stands for the different inversion genotypes (αα, grey, αβ purple, ββ, yellow). Boxplots show the distribution of 30 replicated simulations, with boxes indicating quartile, central line indicating median and whisker expanding to 1.5 times the interquartile. c Variability in the duration of habitat availability (Avar) further increases the portion of the parameter space leading to polymorphism persistence. The parameter space if defined by Tββ-m = [0.1–1.0] and Amean = [7–20 days], as in panel a. Boxplots show the distribution of 100 replicated simulations, with boxes indicating quartile, central line indicating median, whisker expanding to 1.5 times the interquartile and dots being outliers. d Outcome of simulations within a theoretical parameter space, without differences of parameters between sex nor any environmental effect. Overdominance in total fitness emerges as a result of antagonistic pleiotropy, even in the case of co-dominance for each fitness component (top right corner: Hs = 0.5, Ht = 0.5). Simulations in which dominance for survival (Hs) and reproduction (Ht) are independent show how a reversal of dominance and/or variation in the strength of dominance between components of fitness further expand the range of parameters leading to overdominance and the maintenance of polymorphism. e Outcome of simulations within a theoretical parameter space in which fitness parameters are independent between males and females (Sαα-f is the relative survival of αα females, Sαα-m is the relative survival of αα males, Tββ-f is the relative reproductive success of ββ females, Tββ-m is the relative reproductive success of ββ males), without dominance (Hs = Ht = 0.5) or without any environmental effect. Source data are provided as a Source Data file.

Similar articles

Cited by

References

    1. Brian, Charlesworth & Hugues, K. A. The maintenance of genetic variation in life-history traits. In Evolutionary Genetics from Molecules to Morphology (eds Singh, R. S. & Krimbas, C. B.) 369–392 (Cambridge University Press, Cambridge, 2000).
    1. Charlesworth B. Causes of natural variation in fitness: evidence from studies of Drosophila populations. Proc. Natl Acad. Sci. USA. 2015;112:1662–1669. doi: 10.1073/pnas.1423275112. - DOI - PMC - PubMed
    1. Llaurens V, Whibley A, Joron M. Genetic architecture and balancing selection: the life and death of differentiated variants. Mol. Ecol. 2017;26:2430–2448. doi: 10.1111/mec.14051. - DOI - PubMed
    1. Gloss AD, Whiteman NK. Balancing selection: walking a tightrope. Curr. Biol. 2016;26:R73–R76. doi: 10.1016/j.cub.2015.11.023. - DOI - PubMed
    1. Prout, Timothy. How well does opposing selection maintain variation? In Evolutionary Genetics From Molecules to Morphology (eds Singh, R. S. & Krimbas, C. B.) 157–181 (Cambridge University Press, Cambridge, 2000).

Publication types