. 2020 Feb 3;11(1):669.
doi: 10.1038/s41467-020-14526-3.

Conformational plasticity of ligand-bound and ternary GPCR complexes studied by 19F NMR of the β1-adrenergic receptor

Affiliations

Conformational plasticity of ligand-bound and ternary GPCR complexes studied by 19F NMR of the β1-adrenergic receptor

J Niclas Frei et al. Nat Commun. .

Abstract

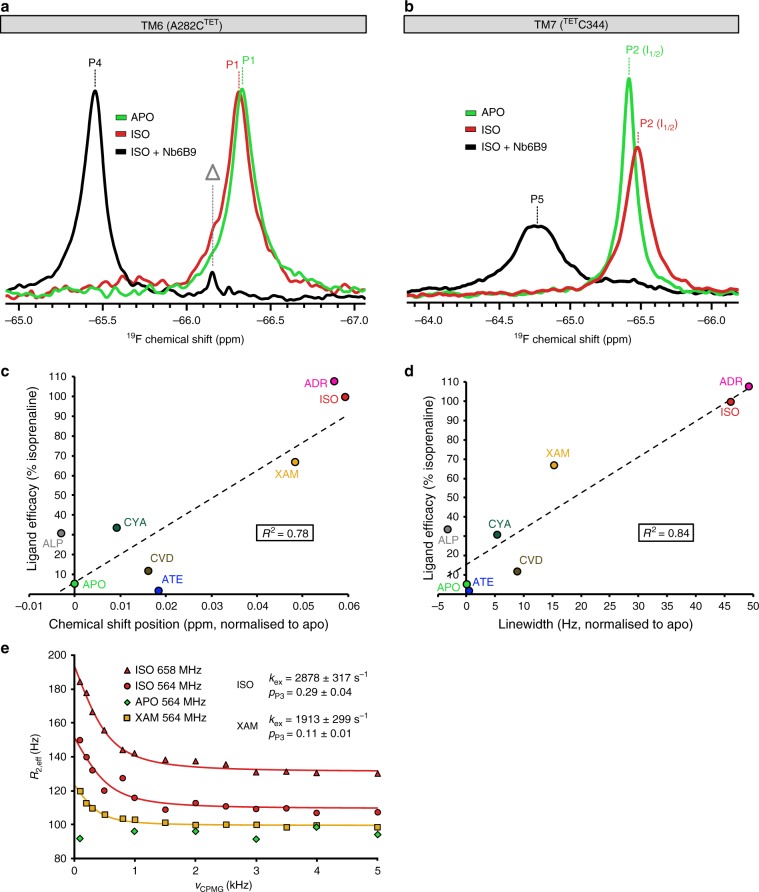
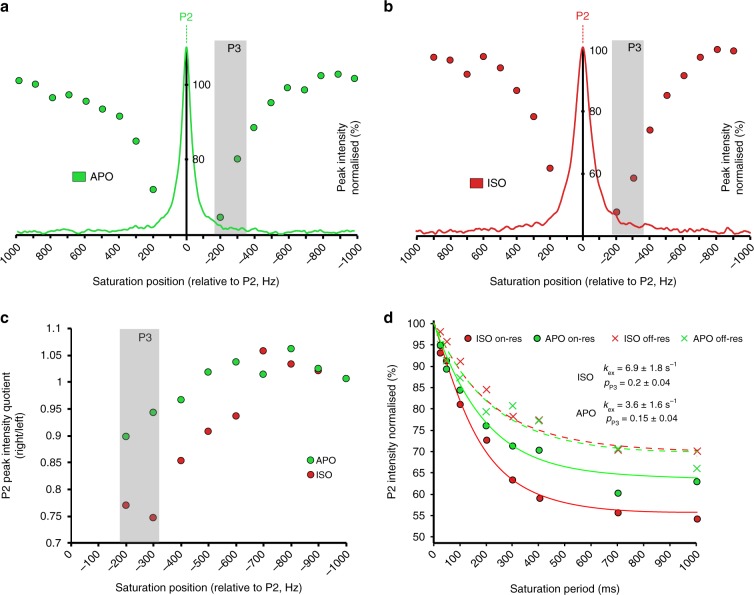
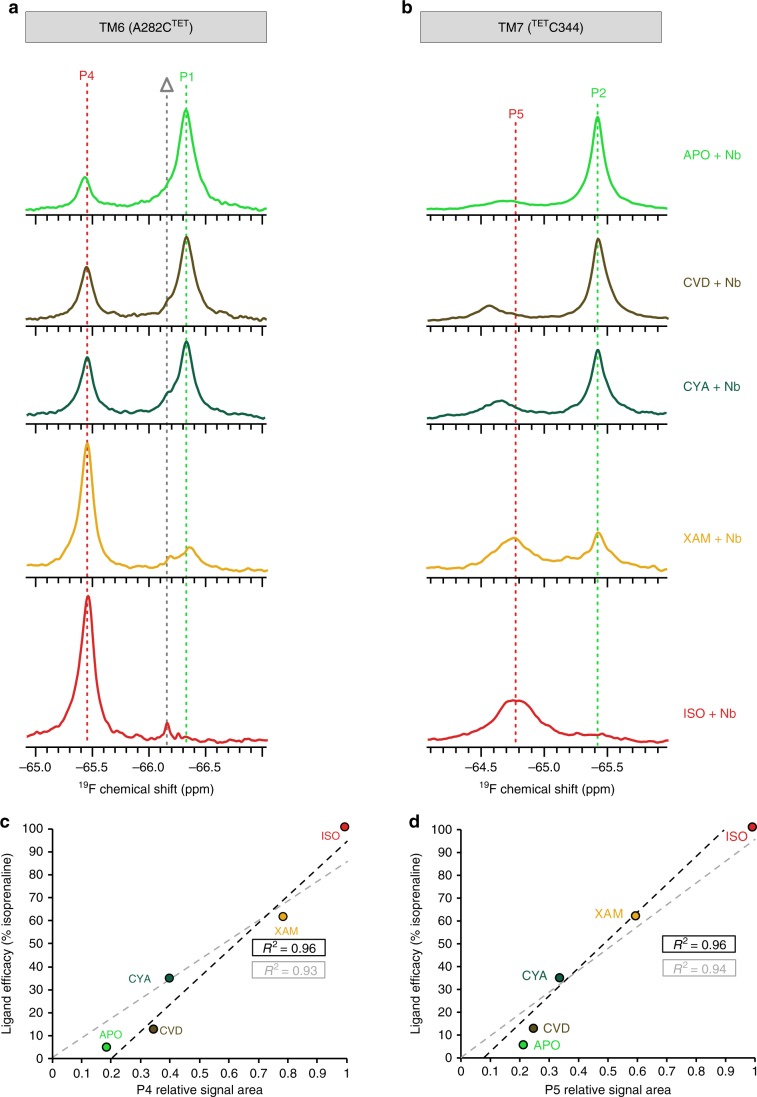
G-protein-coupled receptors (GPCRs) are allosteric signaling proteins that transmit an extracellular stimulus across the cell membrane. Using 19F NMR and site-specific labelling, we investigate the response of the cytoplasmic region of transmembrane helices 6 and 7 of the β1-adrenergic receptor to agonist stimulation and coupling to a Gs-protein-mimetic nanobody. Agonist binding shows the receptor in equilibrium between two inactive states and a pre-active form, increasingly populated with higher ligand efficacy. Nanobody coupling leads to a fully active ternary receptor complex present in amounts correlating directly with agonist efficacy, consistent with partial agonism. While for different agonists the helix 6 environment in the active-state ternary complexes resides in a well-defined conformation, showing little conformational mobility, the environment of the highly conserved NPxxY motif on helix 7 remains dynamic adopting diverse, agonist-specific conformations, implying a further role of this region in receptor function. An inactive nanobody-coupled ternary receptor form is also observed.


Conflict of interest statement

The authors declare no competing interests.

Figures

Fig. 1
Fig. 1. Structure overlay illustrating conformational changes in β1AR upon activation.
a Side-on view of β1AR bound to cyanopindolol, representative of the inactive state (magenta, PDB code 2YCY), and the nanobody Nb80 coupled receptor bound to isoprenaline, showing β1AR in the fully active state (blue, PDB code 6H7J). TM6, TM7 and helix 8 are shown in the colour of their respective state, with the Gs mimetic nanobody omitted for purposes of clarity. The 19F tagged cysteines A282CTET, 6.27 and TETC3447.54 are shown with their side chains represented as sticks and the Sγ atom as coloured spheres. The structure overlay highlights the outward movement of TM6 and the rotation of TM7 upon formation of the ternary complex. b Enlarged view showing the NPxxY7.53 motif on TM7 containing the highly conserved Y3437.53 that upon formation of the ternary complex rotates behind TM6 and makes a water-mediated hydrogen bond with Y2275.58 on TM5 that stabilises the active state. Both Y3437.53 and TETC3447.54 rotate inwards upon formation of the ternary complex. c Cytoplasmic view of the region shown in (b), which illustrates the clockwise rotation of Y3437.53 and TETC3447.54 on TM7.
Fig. 2
Fig. 2. 19F NMR spectroscopy of β1AR TM6 and TM7.
The individual helices were studied by monitoring A282CTET (a) and TETC344 (b), respectively, highlighting the response of the receptor to agonist binding and the formation of the ternary complex coupled to Nb6B9. All spectra were obtained at 308 K, 564 MHz (19F) with receptor concentrations of 20 to 30 µM and saturating ligand concentrations (1 mM). a 19F NMR spectra are shown for A282CTET for apo β1AR (light green), bound to full agonist isoprenaline (red) and with isoprenaline in ternary complex coupled to Nb6B9 (black). The peak corresponding to TM6 A282CTET in the apo and isoprenaline bound β1AR (P1) appears at a chemical shift of −66.3 ppm. Addition of a two-fold molar excess of Nb6B9 causes a downfield shift of 0.8 ppm to −65.5 ppm (P4). The line marked with Δ indicates the appearance of free TET due to the slow cleavage of the S-S bond at 308 K. b 19F NMR spectra for TM7 C344TET show a peak at −65.4 ppm (P2) for the apo β1AR (light green). Isoprenaline binding (red) causes an upfield shift by 0.06 ppm and a doubling of the linewidth. Coupling to Nb6B9 (black) shifts the signal of the ternary complex (P5) downfield to −64.8 ppm, together with a dramatic increase in the linewidth, compared to both isoprenaline bound and apo β1AR. For TETC344 on TM7 the chemical shifts (c) and the linewidths (d) of P2 correlate with the Gs efficacy of the agonists tested. Chemical shifts and linewidths are shown relative to the apo receptor (δ = −54.42 ppm, Δv1/2 = 46 Hz). Linear fits of the correlations are indicated by a line and R2 values are given (ATE atenolol, CVD carvedilol, ALP alprenolol, CYA cyanopindolol, XAM xamoterol, ISO isoprenaline, ADR adrenaline). e Fast timescale μs-to-ms conformational dynamics of P2 assessed by 19F CPMG relaxation dispersion measurements for isoprenaline (red) (studied at 19F frequencies of 564 MHz and 658 MHz) and xamoterol bound receptor (orange) (19F 564 MHz). Best fit curves to the dispersion data are shown together with values for kex and pP3 (pI2) obtained from the fits. The apo form of β1AR does not show any relaxation dispersion (green).
Fig. 3
Fig. 3. 19F saturation transfer experiments of TETC344 on TM7.
The experiments identify a low populated signal P3 that is in slow exchange with P2. The offset dependence of saturation for (a) the apo receptor (green), and (b) β1AR bound to isoprenaline (red) is probed in increments of 100 Hz. c Peak intensity ratios from pairwise experiments with saturation at symmetrical offsets reveal a maximal response at −300 Hz relative to the corresponding P2 signal (grey box). The response to saturation increases from the apo form to isoprenaline bound receptor. d Saturation time course for apo receptor (green) and β1AR bound to isoprenaline (red) with the irradiation field (field strength 25 Hz) in the on-resonance experiment (circles) applied at the position of P3, i.e. −300 Hz from P2. For the off-resonance reference experiment (crosses) saturation was applied at +300 Hz from P2. Best fits for the signal decays are shown by lines with values for kex and pP3 extracted from simultaneous fits indicated for isoprenaline bound receptor as well as the apo form.
Fig. 4
Fig. 4. Ternary complex formation of β1AR coupled to nanobody Nb6B9.
The experiments were conducted with the receptor in its apo form or in the presence of a range of agonists. All spectra were obtained at 308 K, 564 MHz (19F) with receptor concentrations of 20 − 30 μM, saturating concentrations (1 mM) of agonists and a two-fold molar excess of Nb6B9 over β1AR. 19F NMR spectra of A282CTET (a) and TETC344 (b) are shown for ternary complexes of β1AR in the apo form (light green), bound to carvedilol (brown), cyanopindolol (dark green), xamoterol (orange) and isoprenaline (red) (CVD carvedilol, CYA cyanopindolol, XAM xamoterol, ISO isoprenaline). The spectra are shown from top to bottom in increasing efficacy of the ligand bound. For reference the position of the uncoupled apo form is shown by a green dotted line (P1, P2) and the position of the ternary nanobody coupled complex with isoprenaline as a red dotted line (P4, P5). In (a) the grey dotted line (Δ) indicates the appearance of TET due to slow cleavage of the S-S bond at 308 K. The relative integrals of the ternary complexes P4 (c) and P5 (d) linearly correlate with the ligand efficacy. With increasing efficacy the amounts of P1 and P2 are decreasing. In (c) and (d) a black dashed line indicates the linear fit to the measured data points, while a grey dashed line shows the corresponding linear fit that goes through the origin (based on the assumption that no ternary complex should be formed if the ligand efficacy is 0%).
Fig. 5
Fig. 5. Schematic overview of β1AR ligand activation and ternary complex formation.
Cartoon cross sections spanned by TM6, TM7 and H8 with the TM7 TETC3447.54 probes shown as yellow spheres, adjacent to Y3437.53 of the NPxxY motif. The receptor exists in an equilibrium of inactive states (I1,2) and a pre-active state (A), with the latter populated in growing amounts with increasing efficacy of the bound ligand. Nanobody Nb6B9 addition leads to the formation of a fully active ternary complex (AG+) in amounts proportional to the ligand efficacy. Nanobody binding also occurs with the inactive form of the receptor, resulting in the formation of (AG−). The latter can be considered as a pre-coupled inactive form, with inactive and active ternary complexes in slow exchange with each other. The binding interface in the (AG−) complex is shown faded, emphasising that Nb6B9 has not yet fully engaged the epitope characteristic of the active receptor state. The (I1) ⇌ (I2) interchange takes place on a μs-to-ms timescale, while the (I2) ⇌ (A) interchange as well as the (AG−) ⇌ (AG+) exchange occurs on a slower sub-second timescale. Exchange rates, where measured, are indicated below the equilibrium arrows. In the ternary state (AG+) the cytoplasmic region of TM6 is rigid while TM7 remains dynamic on the μs-to-ms timescale, implied by TM7 showing partly blurred. In (AG+) the conformation of TM7 in the vicinity of the NPxxY motif reveals agonist-dependent conformational differences, emphasised by TM7 showing in different colours in the enlarged region marked with (*). The grey slider below each receptor cartoon approximates the relative hydrophobic/hydrophilic extent of the TM7 19F NMR probe surrounding in that particular state. Lipid bilayer hydrophobic regions are shown in light grey. Dark grey areas indicate transmembrane regions of the receptor with residues rich in hydrophobic side chains. These form hydrophobic gates above and below the NPxxY region (e.g. in I1 and I2) that shield the receptor interior against bulk water access. Blue dots on a grey background (e.g. in I1, I2 and AG−) indicate ordered internal water molecules, separated from the bulk water through the hydrophobic gates (dark grey). Conformational changes upon activation disrupt the two hydrophobic side chain layers, resulting in the gradual opening of a continuous internal water pathway with cytoplasmic influx of bulk water, as indicated by the speckled grey/blue area between TM6 and TM7 in (A) and (AG+).

Similar articles

Cited by

References

    1. Rosenbaum DM, Rasmussen SGF, Kobilka BK. The structure and function of G-protein-coupled receptors. Nature. 2009;459:356–363. doi: 10.1038/nature08144. - DOI - PMC - PubMed
    1. Zhou XE, Melcher K, Xu HE. Understanding the GPCR biased signaling through G protein and arrestin complex structures. Curr. Opin. Struct. Biol. 2017;45:150–159. doi: 10.1016/j.sbi.2017.05.004. - DOI - PubMed
    1. Erlandson SC, McMahon C, Kruse AC. Structural basis for G protein-coupled receptor signaling. Annu. Rev. Biophys. 2018;47:1–18. doi: 10.1146/annurev-biophys-070317-032931. - DOI - PubMed
    1. Zhang Y, Devries ME, Skolnick J. Structure modeling of all identified G protein-coupled receptors in the human genome. PLoS Comput. Biol. 2006;2:88–99. doi: 10.1371/journal.pcbi.0020088. - DOI - PMC - PubMed
    1. Hilger D, Masureel M, Kobilka BK. Structure and dynamics of GPCR signaling complexes. Nat. Struct. Mol. Biol. 2018;25:4–12. doi: 10.1038/s41594-017-0011-7. - DOI - PMC - PubMed

Publication types

MeSH terms