. 2020 Feb 3;10(1):1692.
doi: 10.1038/s41598-020-57884-0.

RNA-Seq reveals novel genes and pathways associated with hypoxia duration and tolerance in tomato root

Affiliations

RNA-Seq reveals novel genes and pathways associated with hypoxia duration and tolerance in tomato root

Vajiheh Safavi-Rizi et al. Sci Rep. .

Erratum in

Abstract

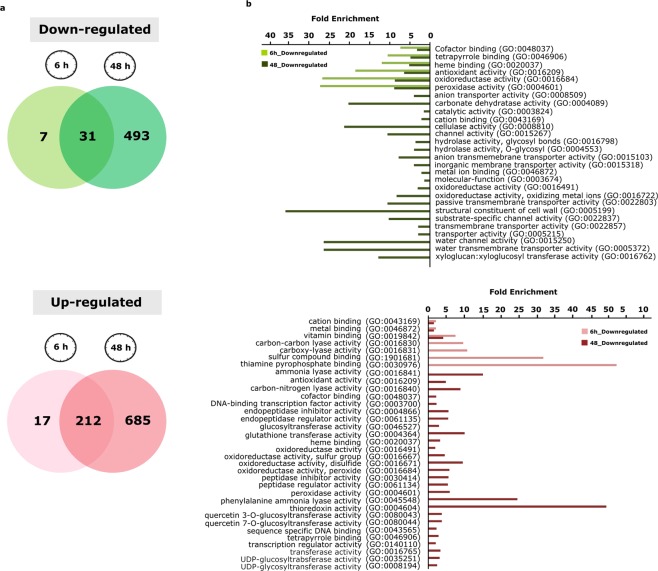
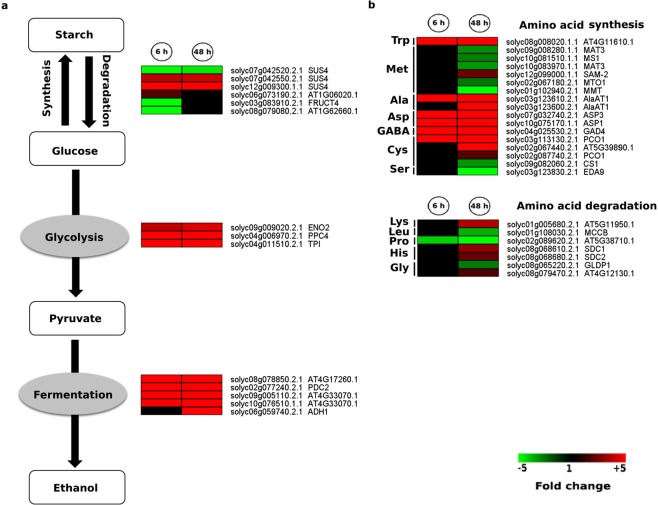
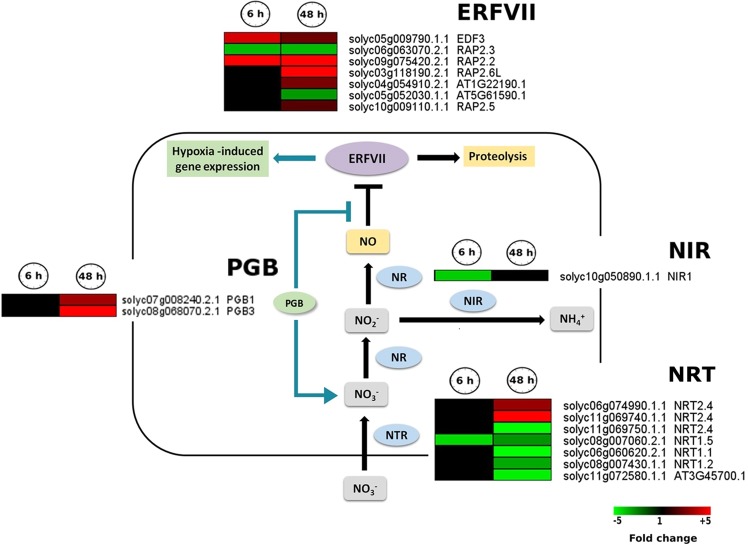
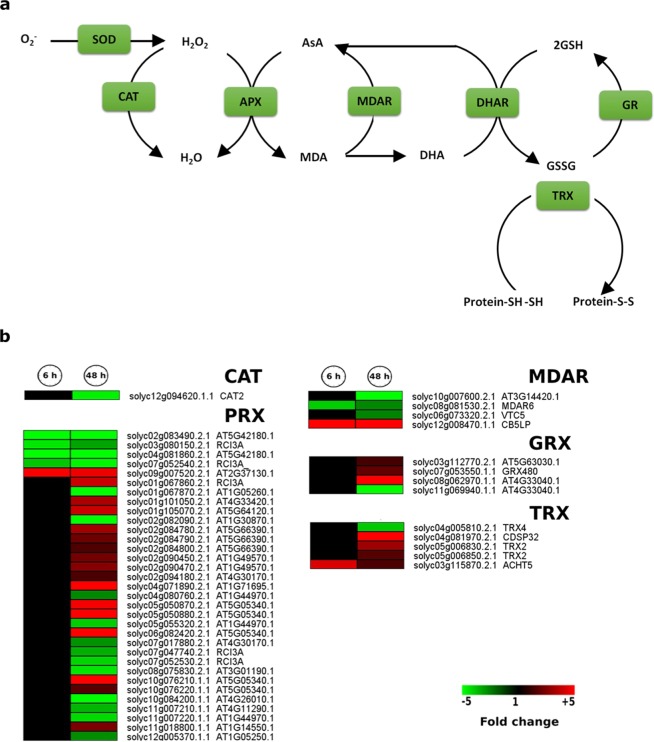
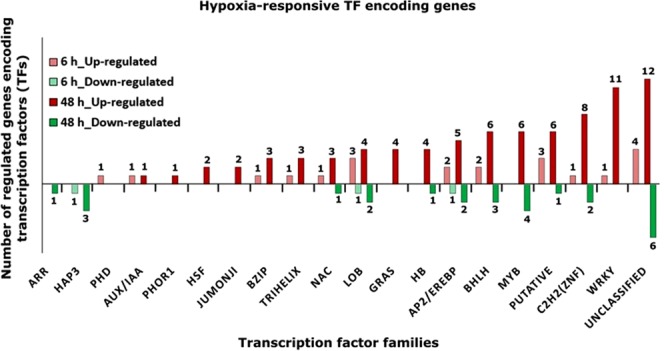
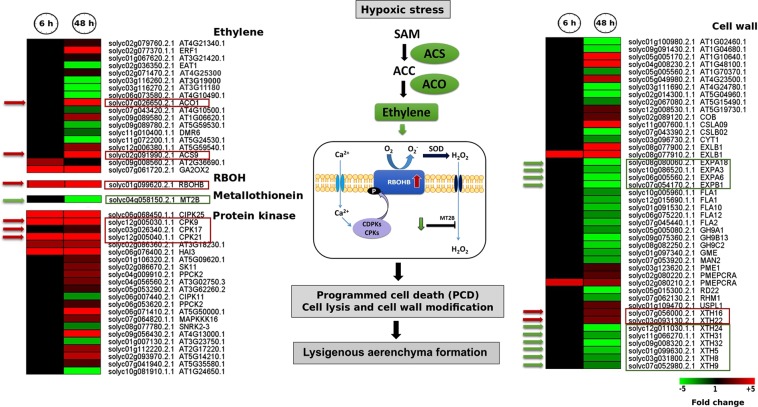
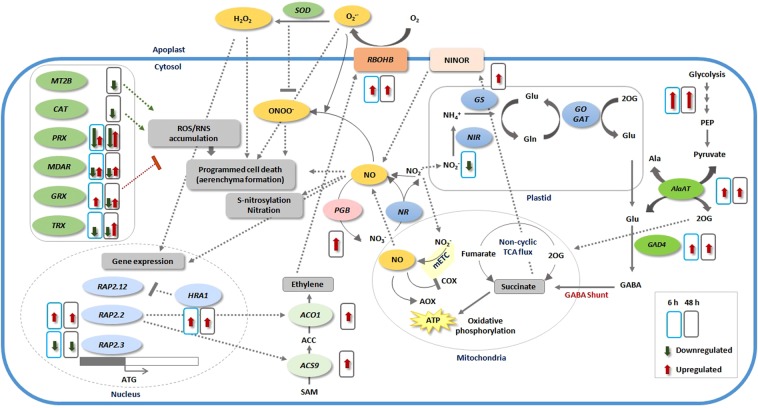
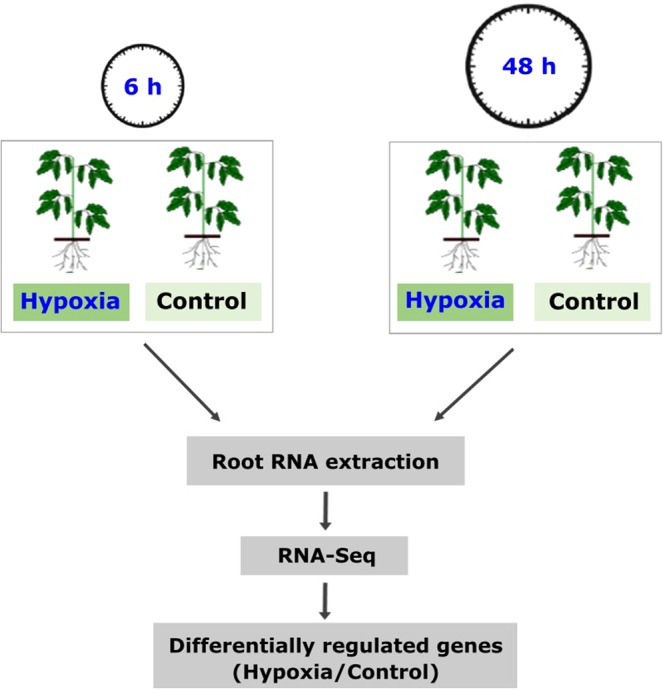
Due to climate change, economically important crop plants will encounter flooding periods causing hypoxic stress more frequently. This may lead to reduced yields and endanger food security. As roots are the first organ to be affected by hypoxia, the ability to sense and respond to hypoxic stress is crucial. At the molecular level, therefore, fine-tuning the regulation of gene expression in the root is essential for hypoxia tolerance. Using an RNA-Seq approach, we investigated transcriptome modulation in tomato roots of the cultivar 'Moneymaker', in response to short- (6 h) and long-term (48 h) hypoxia. Hypoxia duration appeared to have a significant impact on gene expression such that the roots of five weeks old tomato plants showed a distinct time-dependent transcriptome response. We observed expression changes in 267 and 1421 genes under short- and long-term hypoxia, respectively. Among these, 243 genes experienced changed expression at both time points. We identified tomato genes with a potential role in aerenchyma formation which facilitates oxygen transport and may act as an escape mechanism enabling hypoxia tolerance. Moreover, we identified differentially regulated genes related to carbon and amino acid metabolism and redox homeostasis. Of particular interest were the differentially regulated transcription factors, which act as master regulators of downstream target genes involved in responses to short and/or long-term hypoxia. Our data suggest a temporal metabolic and anatomic adjustment to hypoxia in tomato root which requires further investigation. We propose that the regulated genes identified in this study are good candidates for further studies regarding hypoxia tolerance in tomato or other crops.


Conflict of interest statement

The authors declare no competing interests.

Figures

Figure 1
Figure 1
Fresh weight, dry weight and relative chlorophyll content of tomato plants under short- and long-term hypoxia compared to controls. (a) Fresh weight; (b) dry weight and c water content (%) of 5 week old tomato roots after 6 h and 48 h hypoxia, compared to controls. (d) Relative chlorophyll content in leaf #3 of plants under hypoxia conditions and controls are shown as SPAD values. Data represents means ± SD; n = 3; *, Significant differences (Student’s t-test, P < 0.05).
Figure 2
Figure 2
Transcriptomic modulation in tomato roots in response to 6 h and 48 h hypoxia. (a) Venn diagrams display the number of up-regulated (light and dark red) and down-regulated (light and dark green) genes. Light and dark colours represent 6 and 48 h hypoxia, respectively. Only genes with significant ( ≥ 2-fold) expression changes and Padj < 0.05 are depicted. (b) Enriched GO terms (Padj < 0.05), describing molecular function, among down- and up-regulated genes in response to 6 h and 48 h hypoxia. The regulated genes in all samples were analysed for enriched GO terms using the online tool PANTHER 14.0 and Solanum lycopersicum as a reference organism. The light and dark green bars represent all significantly enriched GO terms associated with down-regulated genes in response to 6 h and 48 h hypoxia, respectively. The light and dark red bars represent all significantly enriched GO terms associated with up-regulated genes in 6 h and 48 h hypoxia samples, respectively.
Figure 3
Figure 3
Validation of RNA-Seq data using qPCR. Strong positive correlation of 18 differentially regulated genes (expression ratios ≥2 and Padj <0.05, n = 3) between RNA-Seq and qPCR data at (a) 6 h (R2 = 0.90) and (b) 48 h (R2 = 0.90) after hypoxia. Fold-changes represent the expression changes of each gene under hypoxia (6- or 48 h) relative to its respective control, (n = 3).
Figure 4
Figure 4
Hypoxia-induced and repressed carbon flux and amino acid metabolism associated genes. Heat maps display the up-regulated (red bars) or down-regulated (green bars) tomato genes. (a) glycolysis and fermentation; (b) amino acid metabolism in response to 6 h and 48 h hypoxia and their Arabidopsis thaliana homologs. Genes with expression ratios ≥2 and Padj <0.05 (n = 3) are depicted.
Figure 5
Figure 5
Transcriptional changes of genes related to NO production and primary nitrogen metabolism. Heat map of regulated genes involved in NO production (NR) and scavenging (PGBs) as well as early steps of primary nitrogen metabolism (NR, NIR and NRTs). The heat maps display the up-regulated (red bars) or down-regulated (green bars) tomato genes in response to 6 h and 48 h hypoxia and their Arabidopsis thaliana homologs. Genes with expression ratios ≥2 and Padj <0.05 (n = 3) are depicted. NO, nitric oxide; PGB, phytoglobin; NR, nitrate reductase; NIR, nitrite reductase; NRT, nitrate transporter.
Figure 6
Figure 6
Expression pattern of genes encoding members of different antioxidant classes. (a) Ascorbate-glutathion cycle, modified from. (b) Heat maps represent the up-regulated (red bars) or down-regulated (green bars) tomato genes in response to 6 h and 48 h hypoxia and their Arabidopsis thaliana homologs. Genes with expression ratios ≥2 and Padj <0.05 (n = 3) are depicted.
Figure 7
Figure 7
Hypoxia responsive TF encoding genes. Number of differentially regulated genes belonging to different TF families in response to 6 h and 48 h hypoxia. Genes with expression ratios ≥2 and Padj <0.05 (n = 3) are depicted.
Figure 8
Figure 8
A proposed model of the biological processes and genes potentially involved in hypoxia inducible aerenchyma formation in tomato roots under short- and long-term hypoxia, modified from former studies on rice. Low oxygen conditions result in the induction of genes encoding ethylene biosynthesis enzymes ACS9 and ACO1. Moreover, expression of RBOHB, which is involved in the production of O2 radicals from oxygen in the apoplast; increases under low oxygen. On the other hand, hypoxia may stimulate Ca2+ influx from the apoplast to the cytosol resulting in direct stimulation of RBOHB via its EF-hand motif and higher activity of group I CDPK encoding genes such as CPK9, CPK7 and CPK21. RBOHB phosphorylation may enhance its activity and may increase the level of ROS in the apoplast as well as cytosol. Moreover, the expression of the genes encoding ROS scavengers such as MT2B decreases, potentially leading to ROS accumulation and PCD induction for lysigenous aerenchyma formation in root cortical cells. Heat maps display the up-regulated (red bars) or down-regulated (green bars) tomato genes in response to 6 h and 48 h hypoxia and their Arabidopsis thaliana homologs. Genes with expression ratios ≥2 and Padj <0.05 (n = 3) are depicted. Red and green boxes with arrows refer to the formerly reported categories of aerenchyma formation genes related to ethylene biosynthesis, RBOH, metallothionein, protein kinase and cell wall, based on,,–. SAM, S-adenosyl-l-methionine; ACS, 1-aminocyclopropane-1-carboxylic acid (ACC) synthase; ACC, 1-aminocyclopropane-1-carboxylic acid; ACO, and ACC oxidase; SOD, Superoxide dismutase; RBOH, respiratory burst oxidase homolog (RBOH) isoform B; O2, superoxide anion; Ca2+, Calcium; CDPK, Ca2+-dependent protein kinases; MT2B, Metallothionein-like protein 2B; ROS, reactive oxygen species; XTH, xyloglucan endotransglucosylase/hydrolase.
Figure 9
Figure 9
Schematic model illustrating the main transcriptome modulations in tomato root in response to short- and long-term hypoxia. Only enzymes involved in the main pathways are shown. Solid line arrows indicate enzymatic reactions; dashed line arrows indicate induction of a certain process, while flat-headed dashed lines represent inhibition of a certain process. When more than one gene is involved in a category, the length of red and green arrows is in proportion to the number of up- and down-regulated genes, respectively. NR, nitrate reductase; NIR, nitrite reductase; GS, glutamine synthetase; GOGAT, glutamine oxoglutarate aminotransferase; AlaAT, alanine aminotransferase; GAD, glutamate decarboxylase; PEP, Phosphoenolpyruvate; GABA, gamma-Aminobutyric acid; 2OG, 2-oxoglutarate; COX, cytochrome c oxidase; mETC, mitochondrial electron transport chain; AOX, alternative oxidase; ATP, adenosine triphosphate; NO, nitric oxide; PGB, phytoglobin; RBOHB, respiratory burst oxidase homolog protein B; NINOR, nitrite:NO reductase; SOD, superoxide dismutase; ACO, aminocyclopropane carboxylate oxidase; ACS, Acetyl-coenzyme A synthetase; MT2B, metallothionein-like protein 2B; CAT, catalase; PRX, peroxiredoxin; MDAR, monodehydroascorbate reductase; GRX, Glutaredoxin; TRX,Thioredoxin reductases; HRA1, hypoxia response attenuator 1; O2, oxygen; O2, superoxide anion; H2O2, hydrogen peroxidase; ONOO, Peroxynitrite; RAP, related to apetala; Gln, glutamine; Glu, glutamate; Ala, alanine; NO2, nitrite; NO3, nitrate; NH4+, ammonium.
Figure 10
Figure 10
Experimental set-up. A schematic representation of the experimental set-up is provided. Roots of five weeks old tomato (Solanum lycopersicum, cv. Moneymaker) plants were exposed to hypoxia for 6 h or 48 h. N2 gas was applied to induce hypoxia in a hydroponic system. RNA was extracted from the roots of control and hypoxia treated plants for RNA-Seq analysis.

Similar articles

Cited by

References

    1. Antonio C, et al. Regulation of Primary Metabolism in Response to Low Oxygen Availability as Revealed by Carbon and Nitrogen Isotope Redistribution. Plant Physiol. 2016;170(1):43–56. doi: 10.1104/pp.15.00266. - DOI - PMC - PubMed
    1. Arvidsson S, Kwasniewski M, Riano-Pachon DM, Mueller-Roeber B. QuantPrime—a flexible tool for reliable high-throughput primer design for quantitative PCR. BMC Bioinformatics. 2008;9:465. doi: 10.1186/1471-2105-9-465. - DOI - PMC - PubMed
    1. Bailey-Serres J, et al. Making sense of low oxygen sensing. Trends Plant Sci. 2012;17(3):129–138. doi: 10.1016/j.tplants.2011.12.004. - DOI - PubMed
    1. Bailey-Serres J, Voesenek LA. Flooding stress: acclimations and genetic diversity. Annu Rev Plant Biol. 2008;59:313–339. doi: 10.1146/annurev.arplant.59.032607.092752. - DOI - PubMed
    1. Benamar A, et al. Nitrite-nitric oxide control of mitochondrial respiration at the frontier of anoxia. Biochim Biophys Acta. 2008;1777(10):1268–1275. doi: 10.1016/j.bbabio.2008.06.002. - DOI - PubMed

Publication types

MeSH terms