

Standardized phylogenetic and molecular evolutionary analysis applied to species across the microbial tree of life
- PMID: 32015354
- PMCID: PMC6997174
- DOI: 10.1038/s41598-020-58356-1
Standardized phylogenetic and molecular evolutionary analysis applied to species across the microbial tree of life
Abstract
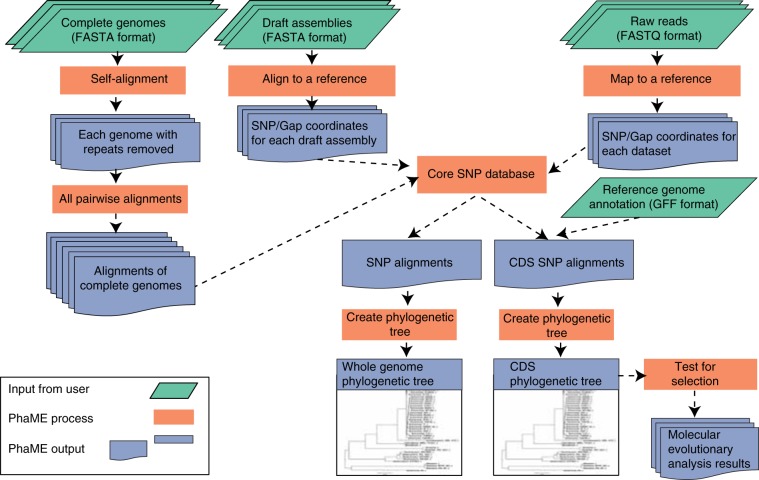
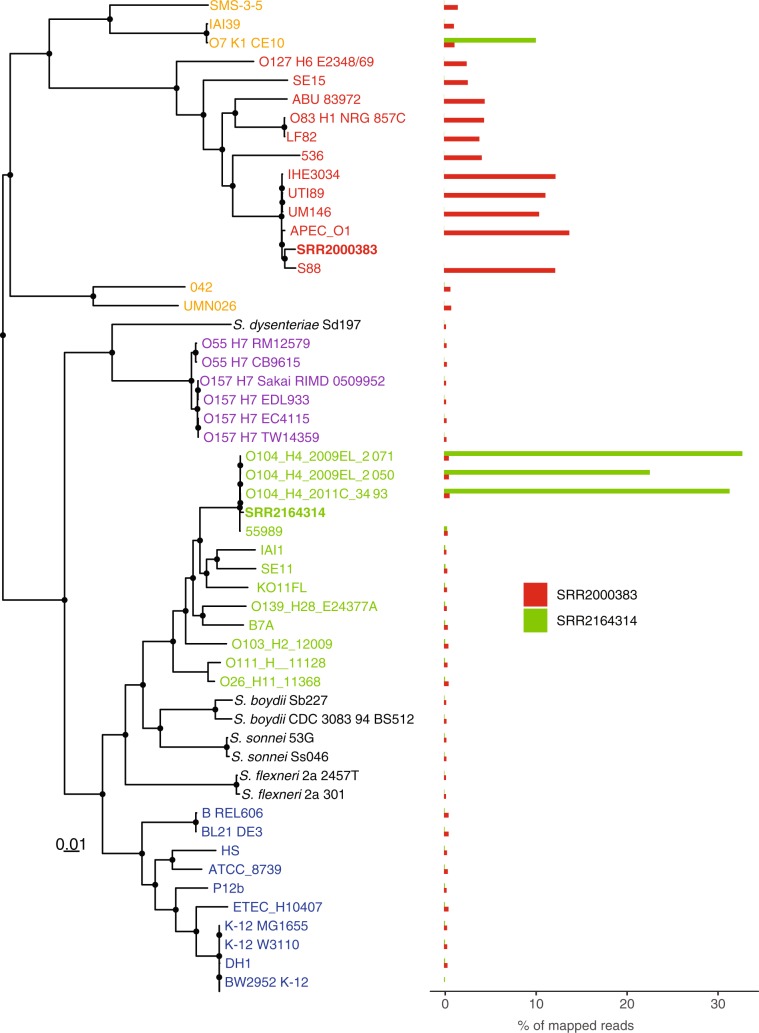
There is growing interest in reconstructing phylogenies from the copious amounts of genome sequencing projects that target related viral, bacterial or eukaryotic organisms. To facilitate the construction of standardized and robust phylogenies for disparate types of projects, we have developed a complete bioinformatic workflow, with a web-based component to perform phylogenetic and molecular evolutionary (PhaME) analysis from sequencing reads, draft assemblies or completed genomes of closely related organisms. Furthermore, the ability to incorporate raw data, including some metagenomic samples containing a target organism (e.g. from clinical samples with suspected infectious agents), shows promise for the rapid phylogenetic characterization of organisms within complex samples without the need for prior assembly.
Conflict of interest statement
The authors declare no competing interests.
Figures
Similar articles
-
Metagenomic Assembly: Reconstructing Genomes from Metagenomes.Methods Mol Biol. 2021;2242:139-152. doi: 10.1007/978-1-0716-1099-2_9. Methods Mol Biol. 2021. PMID: 33961222
-
Co-phylog: an assembly-free phylogenomic approach for closely related organisms.Nucleic Acids Res. 2013 Apr;41(7):e75. doi: 10.1093/nar/gkt003. Epub 2013 Jan 18. Nucleic Acids Res. 2013. PMID: 23335788 Free PMC article.
-
An assembly and alignment-free method of phylogeny reconstruction from next-generation sequencing data.BMC Genomics. 2015 Jul 14;16(1):522. doi: 10.1186/s12864-015-1647-5. BMC Genomics. 2015. PMID: 26169061 Free PMC article.
-
Assessment of metagenomic assemblers based on hybrid reads of real and simulated metagenomic sequences.Brief Bioinform. 2020 May 21;21(3):777-790. doi: 10.1093/bib/bbz025. Brief Bioinform. 2020. PMID: 30860572 Free PMC article. Review.
-
High-throughput sequencing (HTS) for the analysis of viral populations.Infect Genet Evol. 2020 Jun;80:104208. doi: 10.1016/j.meegid.2020.104208. Epub 2020 Jan 27. Infect Genet Evol. 2020. PMID: 32001386 Review.
Cited by
-
Lacrimispora defluvii PI-S10-B5AT sp. nov., an Obligate Anaerobe, Isolated from an Industrial Waste and Reclassification of Hungatella xylanolytica as Lacrimispora xylanolytica and Clostridium indicum as Lacrimispora indica Comb. nov.Curr Microbiol. 2022 Nov 9;79(12):397. doi: 10.1007/s00284-022-03096-w. Curr Microbiol. 2022. PMID: 36352237
-
Metagenome-Assembled Genomes of Komagataeibacter from Kombucha Exposed to Mars-Like Conditions Reveal the Secrets in Tolerating Extraterrestrial Stresses.J Microbiol Biotechnol. 2022 Aug 28;32(8):967-975. doi: 10.4014/jmb.2204.04009. Epub 2022 Jul 7. J Microbiol Biotechnol. 2022. PMID: 35879284 Free PMC article.
-
Antimicrobial Susceptibility of Lactobacillus delbrueckii subsp. lactis from Milk Products and Other Habitats.Foods. 2021 Dec 18;10(12):3145. doi: 10.3390/foods10123145. Foods. 2021. PMID: 34945696 Free PMC article.
-
Gene flow and species boundaries of the genus Salmonella.mSystems. 2023 Aug 31;8(4):e0029223. doi: 10.1128/msystems.00292-23. Epub 2023 Jul 24. mSystems. 2023. PMID: 37486130 Free PMC article.
-
A novel variant in Salmonella genomic island 1 of multidrug-resistant Salmonella enterica serovar Kentucky ST198.Microbiol Spectr. 2024 Jun 4;12(6):e0399423. doi: 10.1128/spectrum.03994-23. Epub 2024 Apr 30. Microbiol Spectr. 2024. PMID: 38687075 Free PMC article.
References
-
- Pamilo P, Nei M. Relationships between gene trees and species trees. Mol. Biol. Evol. 1988;5:568–583. - PubMed
Publication types
MeSH terms
LinkOut - more resources
Full Text Sources
Medical
Molecular Biology Databases
