. 2020 Feb 3;10(1):1688.
doi: 10.1038/s41598-020-58655-7.

The mirtron miR-1010 functions in concert with its host gene SKIP to balance elevation of nAcRβ2

Affiliations

The mirtron miR-1010 functions in concert with its host gene SKIP to balance elevation of nAcRβ2

Christopher Amourda et al. Sci Rep. .

Abstract

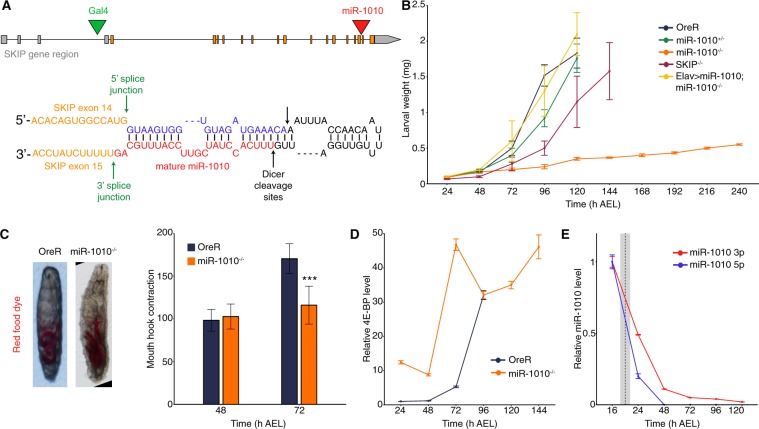
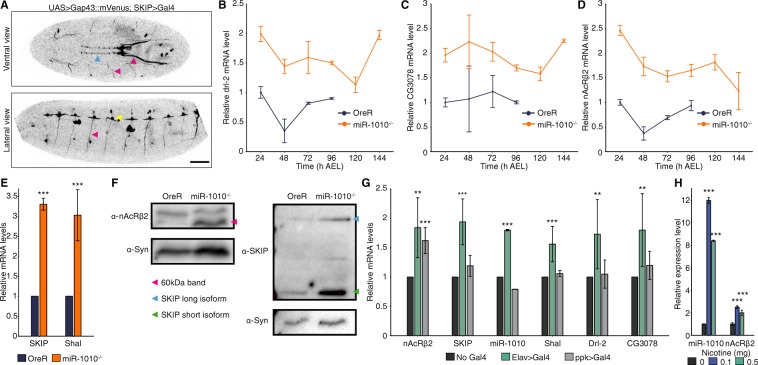
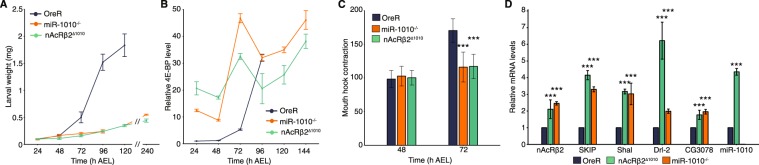
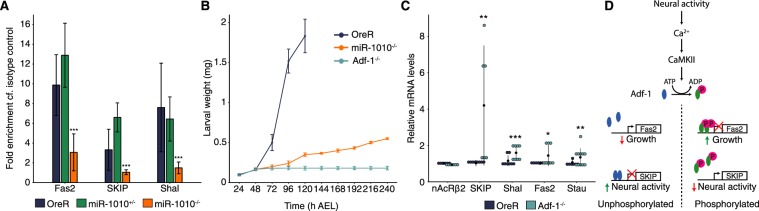
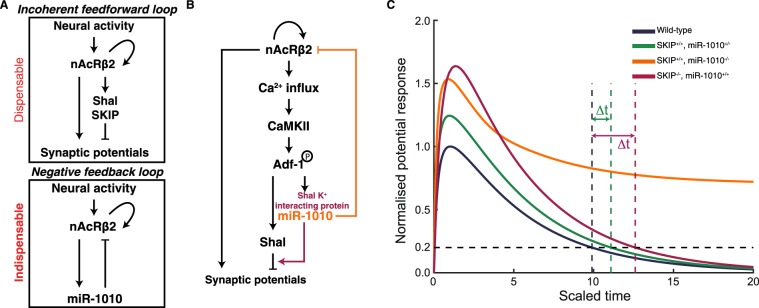
Mirtrons are non-canonical miRNAs arising by splicing and debranching from short introns. A plethora of introns have been inferred by computational analyses as potential mirtrons. Yet, few have been experimentally validated and their functions, particularly in relation to their host genes, remain poorly understood. Here, we found that Drosophila larvae lacking either the mirtron miR-1010 or its binding site in the nicotinic acetylcholine receptor β2 (nAcRβ2) 3'UTR fail to grow properly and pupariate. Increase of cortical nAcRβ2 mediated by neural activity elevates the level of intracellular Ca2+, which in turn activates CaMKII and, further downstream, the transcription factor Adf-1. We show that miR-1010 downregulates nAcRβ2. We reveal that Adf-1 initiates the expression of SKIP, the host gene of miR-1010. Preventing synaptic potentials from overshooting their optimal range requires both SKIP to temper synaptic potentials (incoherent feedforward loop) and miR-1010 to reduce nAcRβ2 mRNA levels (negative feedback loop). Our results demonstrate how a mirtron, in coordination with its host gene, contributes to maintaining appropriate receptor levels, which in turn may play a role in maintaining homeostasis.


Conflict of interest statement

The authors declare no competing interests.

Figures

Figure 1
Figure 1
Larvae fail to grow and pupariate in miR-1010−/−. (A) The mirtron miR-1010 is located in the SKIP gene, between the exons 14 and 15 (red arrowhead, top panel). Green arrowhead shows the insertion point of the Gal4 transposon in the line BL# 62679. MiR-1010 forms a hairpin loop and is debranched from SKIP by the splicing machinery and further matures as a normal miRNA (bottom panel). (B) Larval weight was measured directly after hatching until pupariation. OreR, miR-1010+/−, SKIP−/− and Elav > miR-1010; miR-1010−/− reached ~2 mg before pupariation. MiR-1010−/− weight was recorded for 10 days but did not pupariate. (C) Stereoscope pictures of OreR and miR-1010−/− larvae allowed to eat coloured yeast paste show no feeding behaviour defect (right panel). Mouth hook contraction score in OreR and miR-1010−/−. (D) Larval 4E-BP transcript levels measured by RT-qPCR in OreR and miR-1010−/−. Fold changes are relative to OreR at 24 h AEL. (E) Expression level are relative to the expression at 16 h AEL. The dashed line indicates the average hatching time and the grey rectangle represents the standard deviation in hatching times at 25 °C. All values are means ± SD (***P < 0.001, n = at least 9 for each experiment).
Figure 2
Figure 2
nAcRβ2, Drl-2 and CG3078 levels is elevated in miR-1010−/−. (A) Confocal imaging of a stage 17 embryo expressing a membrane marker (UAS > Gap43::mVenus) driven by SKIP > Gal4. SKIP/miR-1010 are expressed in the CNS (blue arrowhead), in axons (pink arrowheads) emanating from the CNS and at neuromuscular junctions (yellow arrowhead). Scale bar is 50 µm. (BD) Drl-2 (B), CG3078 (C) and nAcRβ2 (D) transcript levels (RT-qPCR) in miR-1010−/− (orange). Fold changes are relative to OreR (dark blue) at 24 h AEL. (E) SKIP and Shal transcript levels (RT-qPCR) in miR-1010−/− relative to OreR larvae at 24 h AEL. (F) Immunoblot analyses for nAcRβ2 (right panel) and SKIP (left panel) in OreR and miR-1010−/−. Syn was used as housekeeping protein. Pink arrowhead indicates the expected size (60 kDa) for nAcRβ2 while the short isoform of SKIP is denoted with a green arrowhead and the full length SKIP protein with a blue arrowhead. nAcRβ2, SKIP and their respective housekeeping protein have different exposure time. Uncropped gel blots are shown in Supplementary Fig. S2F. (H) Transcripts levels (RT-qPCR) in nAcRβ2 overexpressed by Elav > Gal4 (green) or ppk > Gal4 (grey) relative to non-induce UAS > nAcRβ2 (black) at 24 h AEL. (G) miR-1010 levels upon exposure to 0.1 mg (blue) and 0.5 mg (green) of nicotine as compared to 0 mg (black). All values are means ± SD (*P < 0.05, **P < 0.01, ***P < 0.001, n = at least 9 for each experiment).
Figure 3
Figure 3
nAcRβ2∆1010 phenocopies miR-1010−/−. (A) Larval weight in nAcRβ2∆1010 as compared to OreR and miR-1010−/−. (B) Larval 4E-BP transcript levels measured by RT-qPCR in OreR, miR-1010−/− and nAcRβ2∆1010. Fold changes are relative to OreR at 24 h AEL. (C) Mouth hook contraction score in OreR, miR-1010−/−, nAcRβ2∆1010. (D) nAcRβ2, SKIP, Shal, Drl-2, CG3078 and miR-1010 transcript levels (RT-qPCR) in homozygous nAcRβ2∆1010 (green) and miR-1010−/− (orange) relative to OreR (dark blue) at 24 h AEL. All values are means ± SD (*P < 0.05, **P < 0.01, ***P < 0.001, n = at least 9 for each experiment).
Figure 4
Figure 4
Adf-1 controls the expression of SKIP, miR-1010 and Shal. (A) ChIP-qPCR for Adf-1 performed in OreR (dark blue), miR-1010+/− (green) and miR-1010−/− (orange). Fold enrichments are relative to the Rabbit IgG isotype control. (B) Larval weight in Adf-1−/− as compared to OreR and miR-1010−/−. (C) Dot plot representing transcript levels measured in Adf-1−/− (turquoise) relative to OreR (dark blue) at 24 h AEL. Black dots and lines represent, respectively, the mean and the standard deviation for each condition. (D) Model of Adf-1-mediated coupling of neural activity and growth. Adf-1 is represented in blue in its non-phosphorylated form and in green upon phosphorylation. All values are means ± SD (*P < 0.05, **P < 0.01, ***P < 0.001, n = at least 9 for each experiments).
Figure 5
Figure 5
miR-1010 controls synaptic homeostasis by downregulating nAcRβ2 (A) nAcRβ2 is part of incoherent feedforward loop to temper synaptic potentials and a negative feedback loop through which miR-1010 downregulates nAcRβ2 upon receptor activation. (B) Both loops work cooperatively to prevent synaptic potentials from overshooting their optimal range. (C) Long-term average potential response obtained by mass-action kinetic simulation of model outlined in (A). Resting potential defined to 0 (corresponding to ~−70meV). Curves normalised to maximum potential in wild-type simulation (parameters and description in Supplementary Note). Time is scaled relative to the lifetime of nAcRβ2. Δt represents delay in potential in miR-1010+/− and SKIP−/− to return to less than 20% of peak response in wild-type conditions.

Similar articles

Cited by

References

    1. Lee RC, Feinbaum RL, Ambros V. The C. elegans Heterochronic Gene lin-4 Encodes Small RNAs with Antisense Complementarity to lin-14. Cell. 1993;75:843–854. doi: 10.1016/0092-8674(93)90529-Y. - DOI - PubMed
    1. Wightman B, Ha I, Ruvkun G. Posttranscriptional regulation of the heterochronic gene lin-14 by lin-4 mediates temporal pattern formation in C. elegans. Cell. 1993;75:855–862. doi: 10.1016/0092-8674(93)90530-4. - DOI - PubMed
    1. Carthew RW, Agbu P, Giri R. MicroRNA function in Drosophila melanogaster. Semin. Cell Dev. Biol. 2017;65:29–37. doi: 10.1016/j.semcdb.2016.03.015. - DOI - PMC - PubMed
    1. Stefani G, Slack FJ. Small non-coding RNAs in animal development. Nat. Rev. Mol. Cell Biol. 2008;9:219–230. doi: 10.1038/nrm2347. - DOI - PubMed
    1. Vidigal JA, Ventura A. The biological functions of miRNAs: Lessons from in vivo studies. Trends Cell Biol. 2015;25:137–147. doi: 10.1016/j.tcb.2014.11.004. - DOI - PMC - PubMed

Publication types

MeSH terms