. 2020 Mar;4(3):325-334.
doi: 10.1038/s41551-019-0506-0. Epub 2020 Feb 3.

Carbon-coated FeCo nanoparticles as sensitive magnetic-particle-imaging tracers with photothermal and magnetothermal properties

Affiliations

Carbon-coated FeCo nanoparticles as sensitive magnetic-particle-imaging tracers with photothermal and magnetothermal properties

Guosheng Song et al. Nat Biomed Eng. 2020 Mar.

Abstract

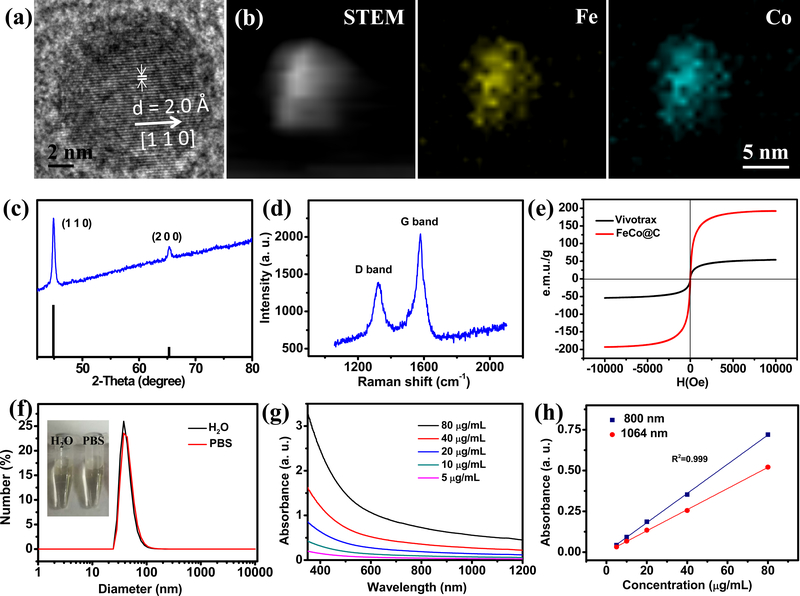
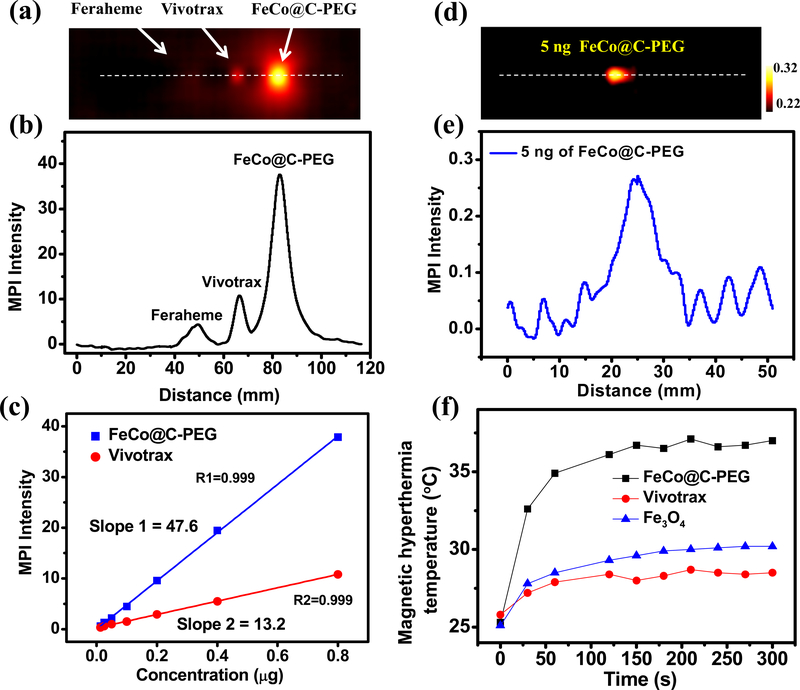
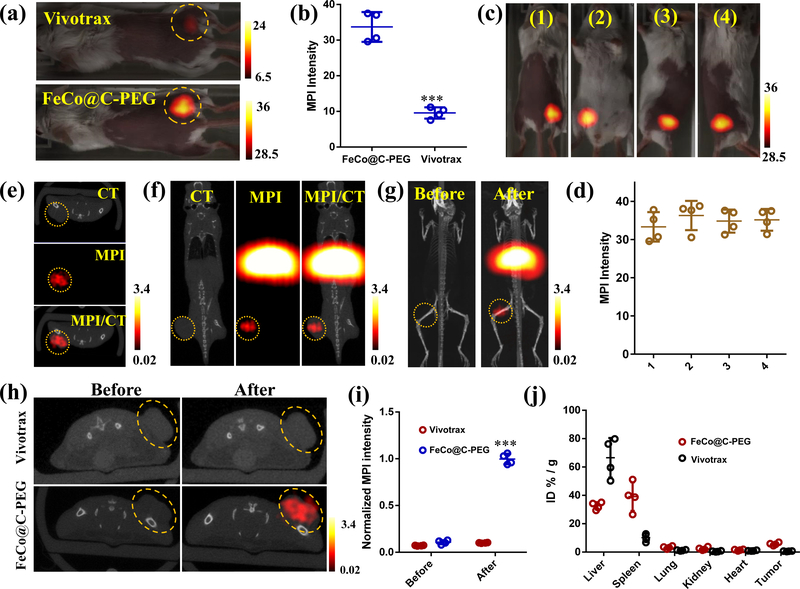
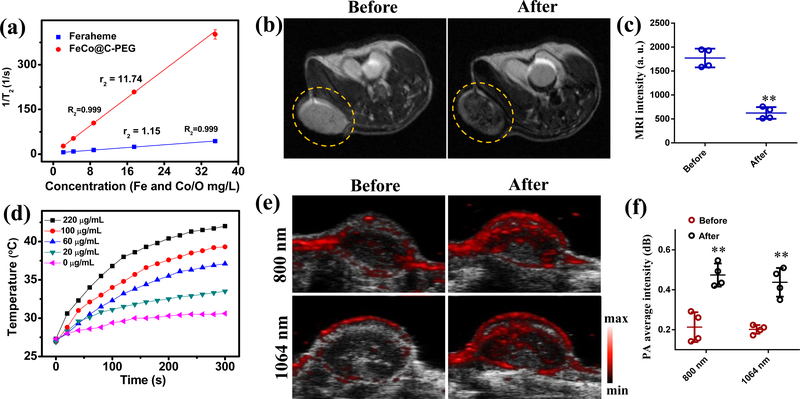
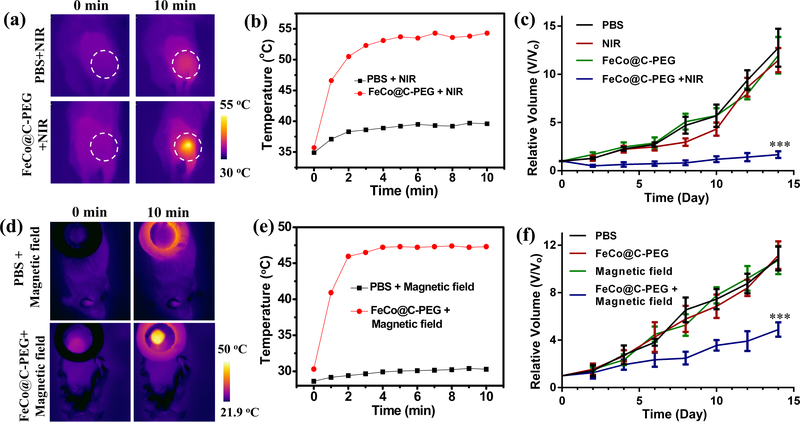
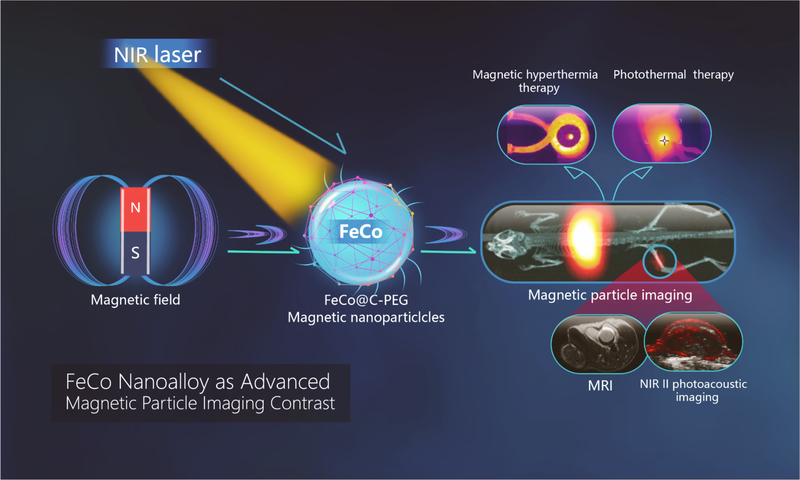
The low magnetic saturation of iron oxide nanoparticles, which are developed primarily as contrast agents for magnetic resonance imaging, limits the sensitivity of their detection using magnetic particle imaging (MPI). Here, we show that FeCo nanoparticles that have a core diameter of 10 nm and bear a graphitic carbon shell decorated with poly(ethylene glycol) provide an MPI signal intensity that is sixfold and fifteenfold higher than the signals from the superparamagnetic iron oxide tracers VivoTrax and Feraheme, respectively, at the same molar concentration of iron. We also show that the nanoparticles have photothermal and magnetothermal properties and can therefore be used for tumour ablation in mice, and that they have high optical absorbance in a broad near-infrared region spectral range (wavelength, 700-1,200 nm), making them suitable as tracers for photoacoustic imaging. As sensitive multifunctional and multimodal imaging tracers, carbon-coated FeCo nanoparticles may confer advantages in cancer imaging and hyperthermia therapy.


Figures

Fig. 1 |
Fig. 1 |. Characterization of 10 nm FeCo@C-PEG purified by density gradient separation (Fraction #3).
a, High resolution TEM image. b, STEM image and element mapping. c, XRD patterns of FeCo@C-PEG (blue curve) and standard peaks (black) of cubic FeCo (PDF#49–1567). d, Raman spectrum shows G peak (~1,578 cm−1) and D peak (~1,328 cm−1), confirming the presence of a graphitic carbon shell. e, Magnetic hysteresis curve of FeCo@C-PEG (red curve) and Vivotrax (black curve). f, DLS size of FeCo@C-PEG in 1 x PBS and water (inset: photograph of tubes containing FeCo@C-PEG in 1 x PBS and water). g, UV-Vis-NIR absorbance spectra of FeCo@C-PEG at indicated concentrations in water. h, Plots of linear fitting absorbance at 800 nm and 1064 nm for FeCo@C-PEG over concentrations in water.
Fig. 2 |
Fig. 2 |. In vitro magnetic particle imaging and magnetic hyperthermia by FeCo@C-PEG (Fraction #3).
a, 2-D projection MPI image of FeCo@C-PEG (Fraction #3), Vivotrax and Feraheme (800 ng of core) in PCR tubes. b, MPI point-of-spread function (PSF) of image in a. c, Plot of the MPI signals of FeCo@C-PEG (Fraction #3) and Vivotrax versus the mass of nanoparticles’ core. d, 2D Average MPI images (25 times scanning) of PCR tube containing FeCo@C-PEG (5 ng of core) after background subtraction. e, PSF of MPI image in d. f, Magnetic hyperthermia heating curves of FeCo@C-PEG (Fraction #3), Vivotrax and Fe3O4 nanoparticles (4 mg/mL, nanoparticles’ core), measured inside the magnetic hyperthermia coil setup (100 kHz, 15 KVA).
Fig. 3 |
Fig. 3 |. In vitro magnetic particle imaging of FeCo@C-PEG (Fraction #3) in mice.
a, 2-D projection MPI images of mice bearing 4T1 xenograft breast tumours intratumourally injected with 20 μL of FeCo@C-PEG (35 μg/mL) or Vivotrax (35 μg/mL). b, Quantification of total MPI signals of tumour areas in a (Two-tailed Student’s t-test, ***P = 0.00041, error bars represent mean ± s. d., n = 4). c, 2-D projection MPI images of mice from different views, after intratumoural injection of FeCo@C-PEG (20 μL, 35 μg/mL). d, Quantification of total MPI signals of tumour areas in c. e-i, MPI and CT imaging of mice bearing 4T1 xenograft breast tumours received i. v. injection of FeCo@C-PEG or Vivotrax (3 mg/kg). e, f, CT, MPI, and CT/MPI images of mice 24 hours after injection of FeCo@C-PEG: e, axial direction; f, coronal direction. g, 3-D CT/MPI images of mice before and after injection of FeCo@C-PEG nanoparticles. h, Axial CT/MPI images of mice before and after injection of Vivotrax or FeCo@C-PEG. i, Quantification of total MPI signals of tumour areas before and after injection of Vivotrax and FeCo@C-PEG (Two-tailed Student’s t-test, ***P = 0.00012, error bars represent mean ± s. d., n = 4). j, Ex vivo biodistribution of FeCo@C-PEG in main organs after injection of indicated MPI tracer.
Fig. 4 |
Fig. 4 |. Magnetic resonance imaging and photoacoustic imaging with FeCo@C-PEG.
a, T2 relaxation rate (1/T2) of Feraheme and FeCo@C-PEG solutions as the function of core concentrations. b, MRI images of mice bearing 4T1 xenograft breast tumours before and 24 hours after i.v. injection of FeCo@C-PEG (3 mg/kg). c, Quantification of MRI signals of tumour areas before and after injection of FeCo@C-PEG (Two-tailed Student’s t-test, **P = 0.0054, error bars represent mean ± s. d., n = 4). d, Photothermal heating curves of FeCo@C-PEG with different concentrations under a 1064 nm laser irradiation (1.0 W2/cm). e, f, The mice bearing 4T1 tumours were scanned by PA scanner at 800 and 1064 nm laser excitation before and 24 hours after i.v. injection of FeCo@C-PEG (3 mg/kg): e, US/PA images scanned; f, corresponding quantification of average PA signals of tumour areas before and after injection of FeCo@C-PEG at 800 nm and 1064 nm of laser excitation (Two-tailed Student’s t-test, ** P = 0.0092 for 800 nm, ** P = 0.0030 for 1064 nm, error bars represent mean ± s. d., n = 4).
Fig. 5 |
Fig. 5 |. In vivo magneto/photo thermal therapy with FeCo@C-PEG.
a, IR thermal images of 4T1 tumour-bearing mice intratumourally injected with FeCo@C-PEG (100 μg) or 1 x PBS, and then exposed to the 1064 nm laser (1.0 W/cm2) for 10 min. b, Photothermal heating curves of tumours monitored by the IR thermal camera, during laser irradiation. c, The growth curves of 4T1 tumours in mice treated with 1 x PBS injection, NIR II laser (1064 nm) only, FeCo@C-PEG only (i.t. injection, 50 μl, 2 mg/mL), or FeCo@C-PEG (i.t. injection, 50 μL, 2 mg/mL) + NIR II laser (1064 nm) (Two-tailed Student’s t-test, ***P = 0.00027, error bars represent mean ± s. d., n = 5). d-f, In vivo magnetic hyperthermia therapy: d, infrared thermal images of tumour-bearing mice i. t. injected with FeCo@C-PEG (50 μL, 5 mg/mL) or 1 x PBS, and then heated in a magnetic coil setup (100 kHz, 15 KVA); e, corresponding magnetic hyperthermia heating curves of tumours monitored by the infrared thermal camera; f, the growth curves of 4T1 tumours in mice treated with 1 x PBS, Magnetic field (100 kHz, 15 KVA) only, FeCo@C-PEG only (i.t. injection, 50 μL, 5 mg/mL), and FeCo@C-PEG (i.t. injection, 50 μL, 5 mg/mL) + Magnetic field (100 kHz, 15 KVA) (Two-tailed Student’s t-test, ***P = 0.00049, error bars represent mean ± s. d., n = 5).
Scheme 1.
Scheme 1.
FeCo@C-PEG nanoparticles enable multiple modality imaging-MPI, MRI, near infrared II-photoacoustic imaging, and effective NIR-II photothermal and magnetic hyperthermia ablation of solid tumor.

Comment in

References

    1. Smith BR & Gambhir SS Nanomaterials for in vivo imaging. Chem. Rev 117, 901–986 (2017). - PubMed
    1. Kunjachan S, Ehling J, Storm G, Kiessling F. & Lammers T. Noninvasive imaging of nanomedicines and nanotheranostics: principles, progress, and prospects. Chem. Rev 115, 10907–10937 (2015). - PMC - PubMed
    1. Signore A, Mather SJ, Piaggio G, Malviya G. & Dierckx RA Molecular imaging of inflammation/infection: nuclear medicine and optical imaging agents and methods. Chem. Rev 110, 3112–3145 (2010). - PubMed
    1. Louie A. Multimodality imaging probes: design and challenges. Chem. Rev 110, 3146–3195 (2010). - PMC - PubMed
    1. Wu L, Mendoza-Garcia A, Li Q. & Sun S. Organic phase syntheses of magnetic nanoparticles and their applications. Chem. Rev 116, 10473–10512 (2016). - PubMed

Publication types