. 2020 Feb;52(2):238-252.
doi: 10.1038/s12276-020-0379-z. Epub 2020 Feb 3.

Isocitrate dehydrogenase 2 protects mice from high-fat diet-induced metabolic stress by limiting oxidative damage to the mitochondria from brown adipose tissue

Affiliations

Isocitrate dehydrogenase 2 protects mice from high-fat diet-induced metabolic stress by limiting oxidative damage to the mitochondria from brown adipose tissue

Jae-Ho Lee et al. Exp Mol Med. 2020 Feb.

Erratum in

Abstract

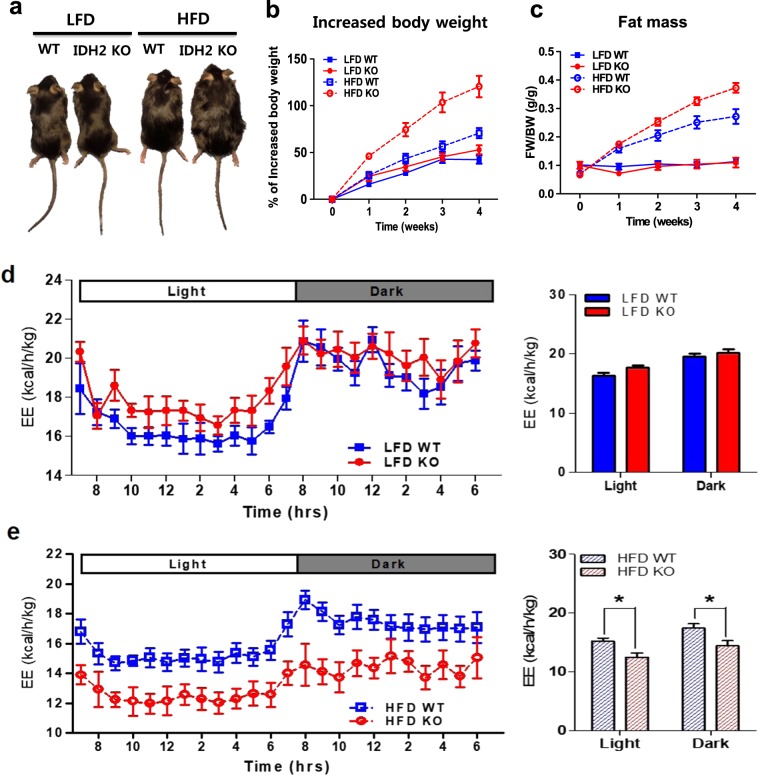
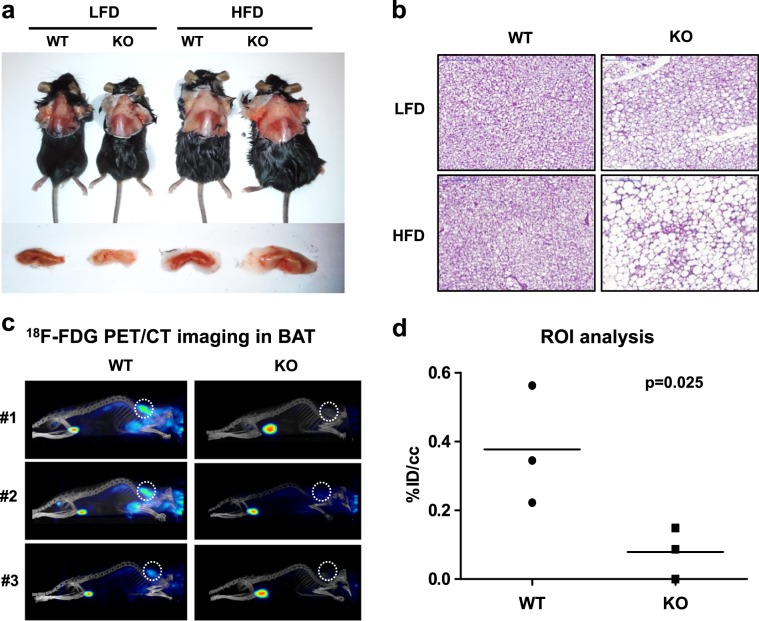
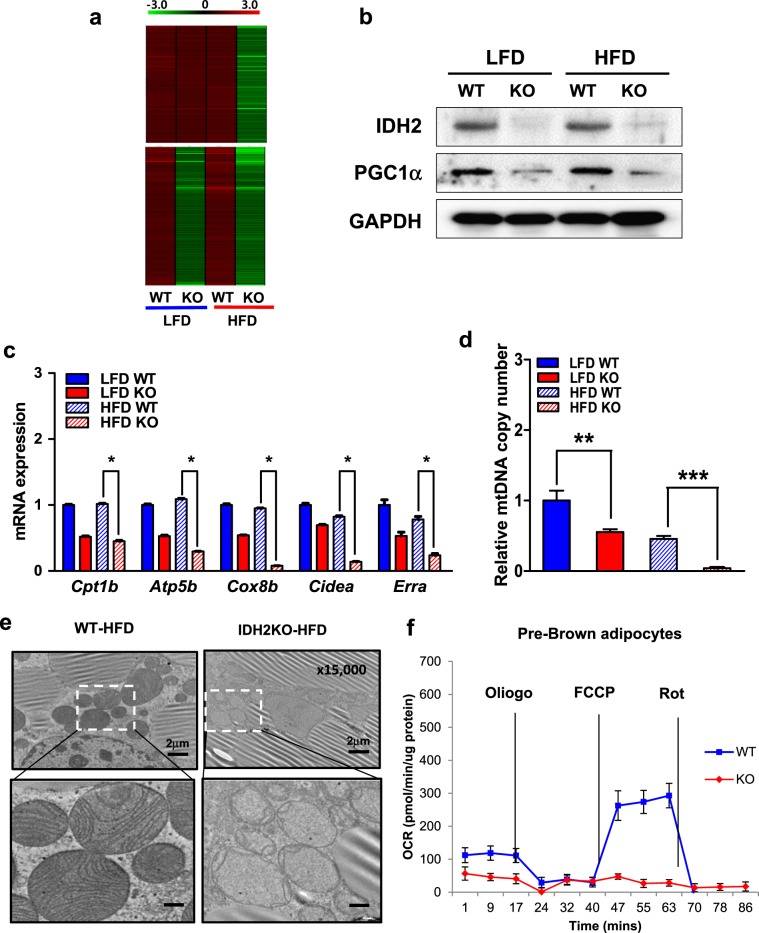
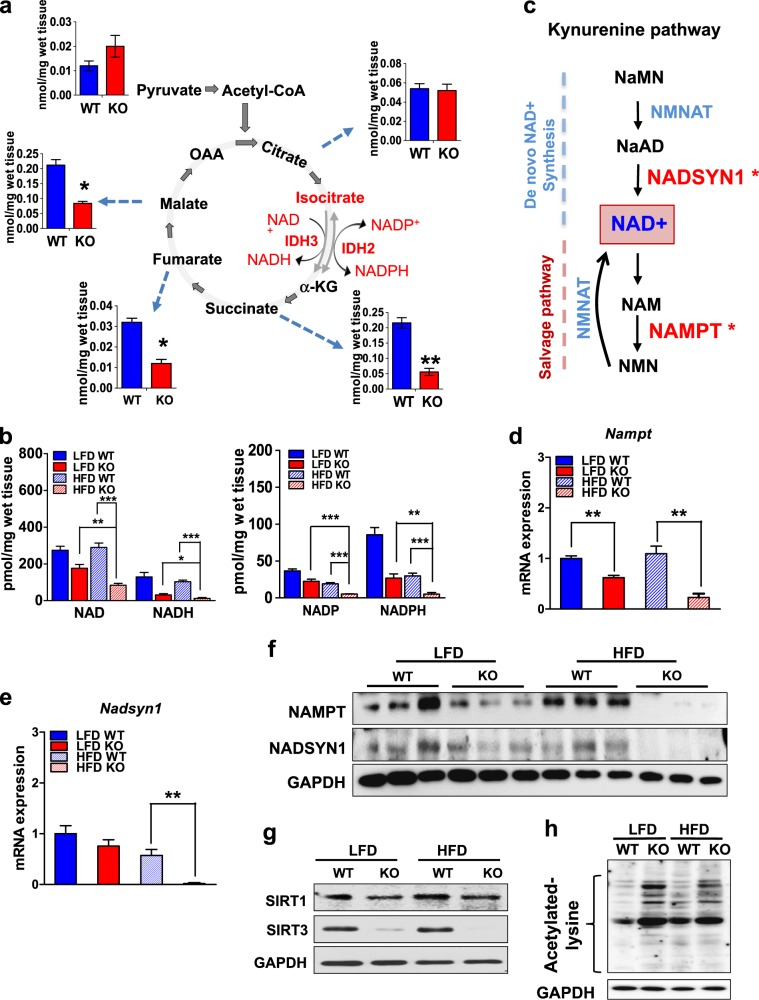
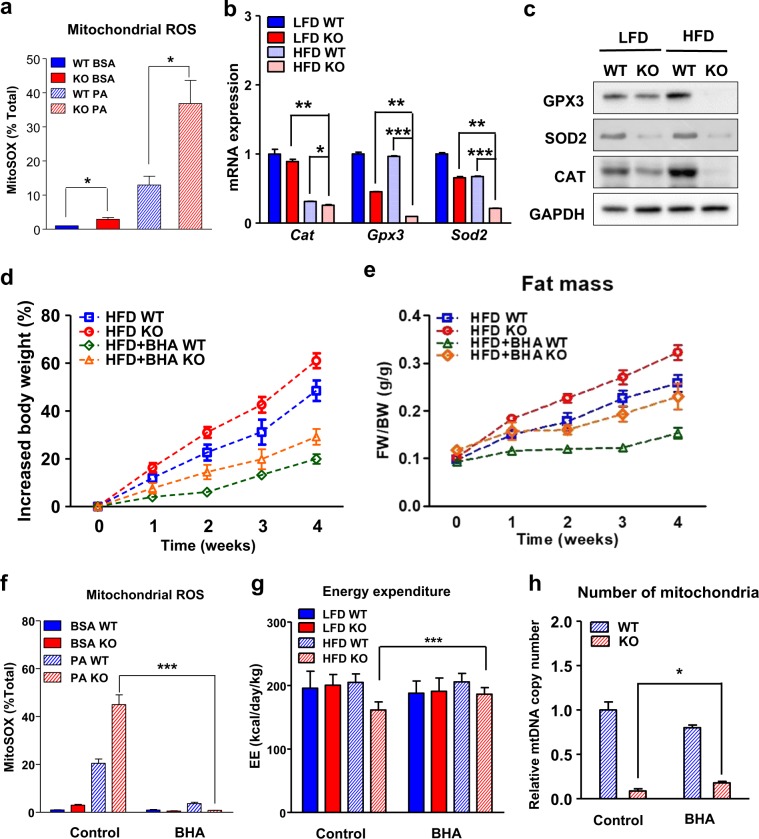
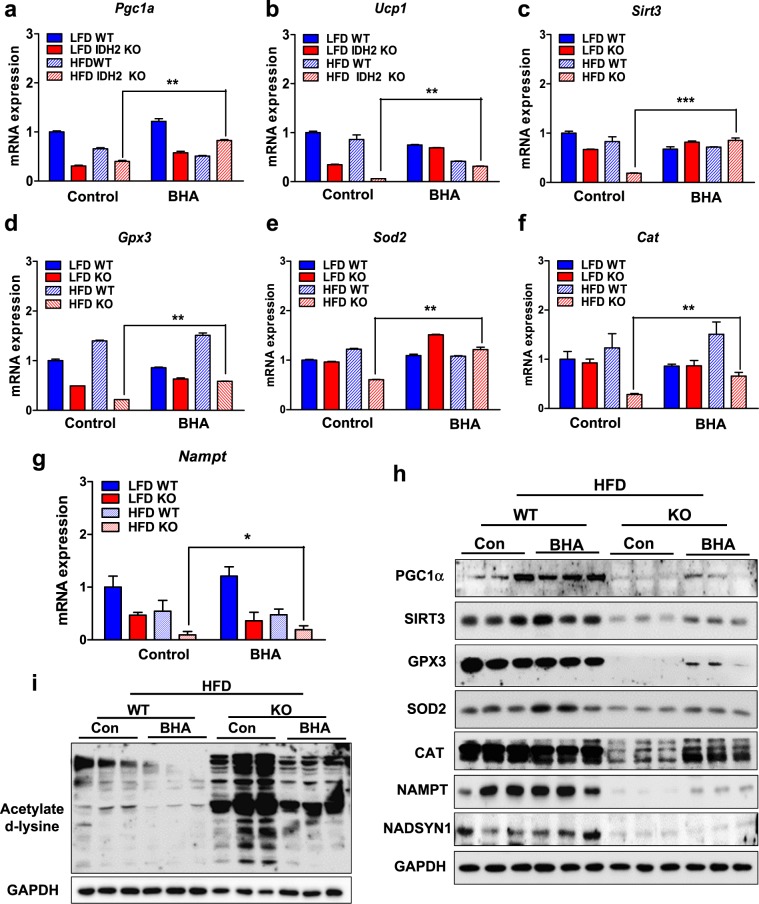
Isocitrate dehydrogenase 2 (IDH2) is an NADP+-dependent enzyme that catalyzes the oxidative decarboxylation of isocitrate to α-ketoglutarate in the mitochondrial matrix, and is critical for the production of NADPH to limit the accumulation of mitochondrial reactive oxygen species (ROS). Here, we showed that high-fat diet (HFD) feeding resulted in accelerated weight gain in the IDH2KO mice due to a reduction in whole-body energy expenditure. Moreover, the levels of NADP+, NADPH, NAD+, and NADH were significantly decreased in the brown adipose tissue (BAT) of the HFD-fed IDH2KO animals, accompanied by decreased mitochondrial function and reduced expression of key genes involved in mitochondrial biogenesis, energy expenditure, and ROS resolution. Interestingly, these changes were partially reversed when the antioxidant butylated hydroxyanisole was added to the HFD. These observations reveal a crucial role for IDH2 in limiting ROS-dependent mitochondrial damage when BAT metabolism is normally enhanced to limit weight gain in response to dietary caloric overload.


Conflict of interest statement

The authors declare that they have no conflict of interest.

Figures

Fig. 1
Fig. 1. Impaired energy expenditure by a HFD in the IDH2KO mice compared with the WT mice.
a Photographs of representative WT or IDH2KO mice after 4 weeks of HFD feeding. b Body weights in each group over a period of 4 weeks (n = 6 per group). c Time course of changes in fat mass. d, e Energy expenditure over a 24-h period of the WT and IDH2KO mice fed a LFD and HFD. *p < 0.05 vs. the HFD–WT mice. LFD low-fat diet, HFD high-fat diet, WT wild type, KO knockout, EE energy expenditure.
Fig. 2
Fig. 2. IDH2 deficiency leads to BAT whitening.
a Representative images showing interscapular brown adipose tissue (iBAT) deposits (n = 6 per group). b Hematoxylin and eosin (H&E) staining of the iBAT section (5 μm) from the WT or IDH2KO mice exposed to a high-fat diet for 4 weeks. c PET/CT images showing the 18F-FDG uptake in the iBAT of the WT and IDH2KO groups as described in the “Materials and methods” (n = 5 per group). d Quantitative positron emission tomography–computed tomography (PET/CT) region of interest (ROI) analysis of the 18F-FDG uptake in the iBAT; 18F-FDG: 2-deoxy-2-[18F]-fluoro-d-glucose.
Fig. 3
Fig. 3. Depletion of IDH2 decreases the expression of mitochondrial-related genes and mitochondrial function in the BAT.
Four-week-old WT and IDH2KO mice were fed a HFD for 4 weeks (n = 9 per group). a Heat map of the RNA-seq data representing genes downregulated in the IDH2KO group of HFD samples (top) or downregulated in both LFD and HFD (bottom). b Western blot analysis of IDH2 and PGC-1α from the iBAT. GAPDH was used as a loading control. c Expression of mitochondrial biogenesis genes in the iBAT of the WT and IDH2KO groups. d Relative mtDNA content expressed as a function of total genomic DNA (nDNA) in the WT and IDH2KO groups. e Transmission electron microscopy (TEM) showed multiple sphere-shaped mitochondria, which are characteristic of iBAT (n = 5). f Representative time course of the oxygen consumption rates (OCR) of primary brown adipocytes from the WT and IDH2KO mice. *p < 0.05, **p < 0.01, and ***p < 0.001 vs. HFD–WT or LFD–WT. TEM transmission electron microscopy.
Fig. 4
Fig. 4. Nicotinamide levels are decreased in the iBAT of the IDH2KO mice.
a Schematic model of the TCA cycle highlighting the IDH reaction in the TCA cycle. b The levels of total NAD+, NADH, NADP+, and NADPH were measured as described in the “Materials and methods” (n = 6 per group). c Scheme of the pathways highlighting NAD synthesis and recycling. d–f mRNA expression levels of Nampt and Nads1 in the iBAT from the WT and IDH2KO mice, and proteins for NAMPT and NADSYN1 (proteins from nine mice from each group were prepared, and extracts from three individuals were pooled and treated as a separate sample for the gel). g Protein levels of SIRT1 and SIRT3 in the iBAT from the WT and IDH2KO mice. h Acetyl-lysine level of the whole proteins in the iBAT of the LFD and HFD–WT and KO mice. The proteins from six mice in each group were pooled and analyzed as individual samples in g and h (n = 6 per panel). *p < 0.05, **p < 0.01, and ***p < 0.001 vs. the LFD–WT mice, LFD–DH2KO mice, or HFD–WT mice. αKG α-ketoglutarate, OAA oxaloacetate, NaMN nicotinic acid mononucleotide, NaAD nicotinic acid adenine dinucleotide, NAD nicotinamide adenine dinucleotide, NAM nicotinamide, NMN nicotinamide mononucleotide, NMNAT NMN adenylyltransferase, NADSYN1 NAD synthetase 1, NAMPT nicotinamide phosphoribosyltransferase.
Fig. 5
Fig. 5. The effects of HFD on ROS production in the iBAT from the WT and IDH2KO mice, and the protective effect of an antioxidant against diet-induced obesity.
a Primary brown adipocytes were cultured from the WT and IDH2KO mice (n = 3 per group) and treated with BSA or BSA plus palmitate, and the stained area was quantified with MitoSOX Red followed by FACS analysis. This experiment was repeated three times. b, c The mRNA and protein levels of key antioxidant genes/proteins in the iBAT from the WT and IDH2KO mice. d, e Growth curves and fat mass for control or butylated hydroxyanisole (BHA)-treated mice fed a LFD or HFD (n = 6 per group). f Primary brown adipocytes cultured from the WT and IDH2KO mice and treated with BSA or BSA plus palmitate, and the percentage of MitoSOX-positive cells stained with MitoSOX Red followed by FACS analysis (n = 3 per group). g Energy expenditure over a 24-h period of the WT and IDH2KO mice in the control or BHA-treated LFD and HFD groups. h Relative mitochondrial DNA content expressed as a function of total genomic DNA (mtDNA) in the iBAT from the control or BHA-treated HFD–IDH2KO mice. *p < 0.05, **p < 0.01, and ***p < 0.001 vs. the LFD–IDH2KO mice or HFD–WT mice.
Fig. 6
Fig. 6. An antioxidant recovers mitochondrial function in the IDH2KO mice.
Four-week-old WT and IDH2KO mice were fed a HFD, and were supplemented with BHA for 4 weeks (n = 6 per group). a–g qPCR analysis of the expression of the indicated genes. h, i The proteins from the BAT of the WT and IDH2KO mice were pooled from individuals and analyzed for the indicated proteins or for total acetylated lysine by immunoblotting. *p < 0.05, **p < 0.01, and ***p < 0.001 vs. the HFD–WT mice. PA palmitate, mtDNA mitochondrial DNA, EE energy expenditure.

References

    1. Villarroya F, Cereijo R, Villarroya J, Giralt M. Brown adipose tissue as a secretory organ. Nat. Rev. Endocrinol. 2017;13:26–35. doi: 10.1038/nrendo.2016.136. - DOI - PubMed
    1. Whittle AJ, Lopez M, Vidal-Puig A. Using brown adipose tissue to treat obesity - the central issue. Trends Mol. Med. 2011;17:405–411. doi: 10.1016/j.molmed.2011.04.001. - DOI - PubMed
    1. Mailloux RJ, Adjeitey CN, Xuan JY, Harper ME. Crucial yet divergent roles of mitochondrial redox state in skeletal muscle vs. brown adipose tissue energetics. FASEB J. 2012;26:363–375. doi: 10.1096/fj.11-189639. - DOI - PubMed
    1. Schonfeld P, Wojtczak L. Brown adipose tissue mitochondria oxidizing fatty acids generate high levels of reactive oxygen species irrespective of the uncoupling protein-1 activity state. Biochim Biophys. Acta. 2012;1817:410–418. doi: 10.1016/j.bbabio.2011.12.009. - DOI - PubMed
    1. Smolkova K, Jezek P. The role of mitochondrial NADPH-dependent isocitrate dehydrogenase in cancer cells. Int. J. Cell Biol. 2012;2012:273947. doi: 10.1155/2012/273947. - DOI - PMC - PubMed

Publication types