. 2020 Feb 3;10(1):1699.
doi: 10.1038/s41598-020-58562-x.

Obeticholic acid and INT-767 modulate collagen deposition in a NASH in vitro model

Affiliations

Obeticholic acid and INT-767 modulate collagen deposition in a NASH in vitro model

Beatrice Anfuso et al. Sci Rep. .

Abstract

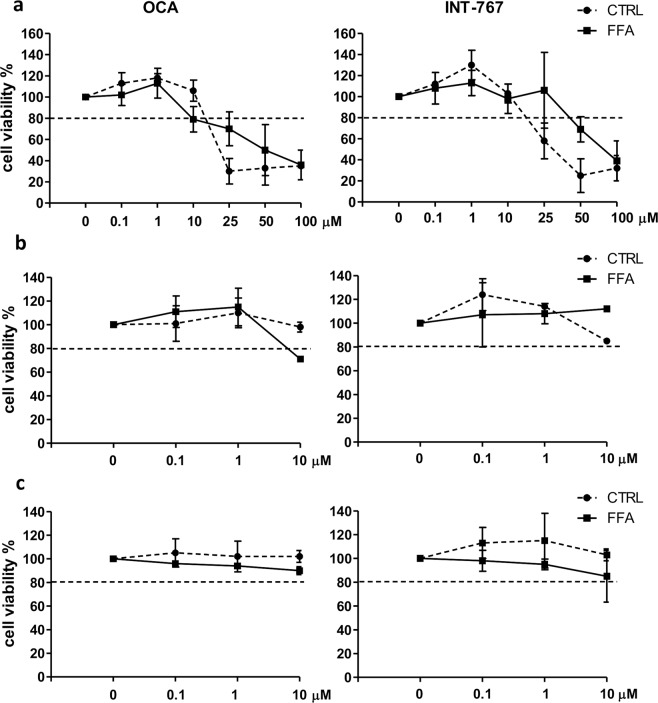
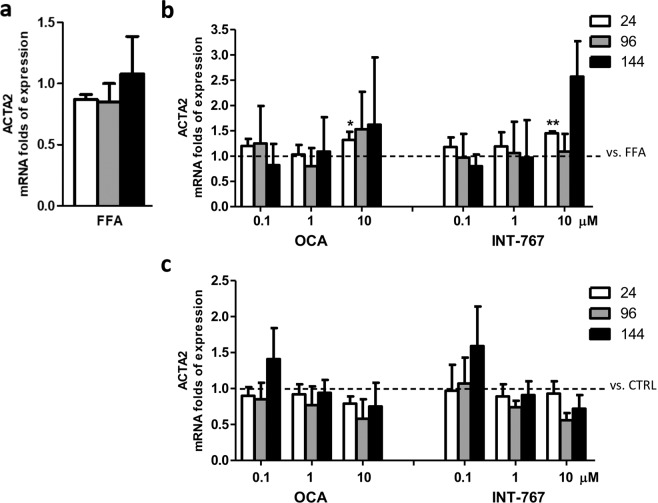
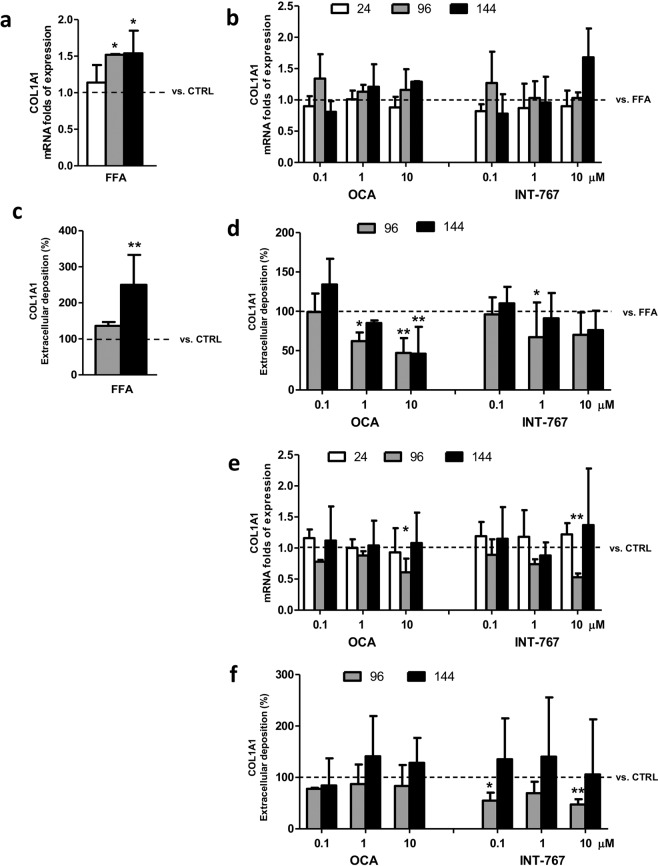
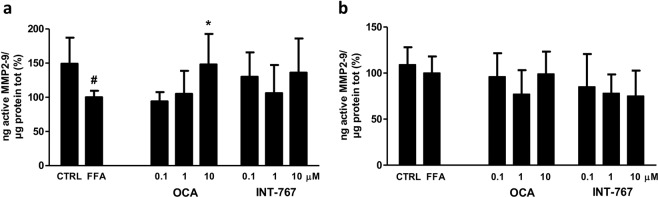
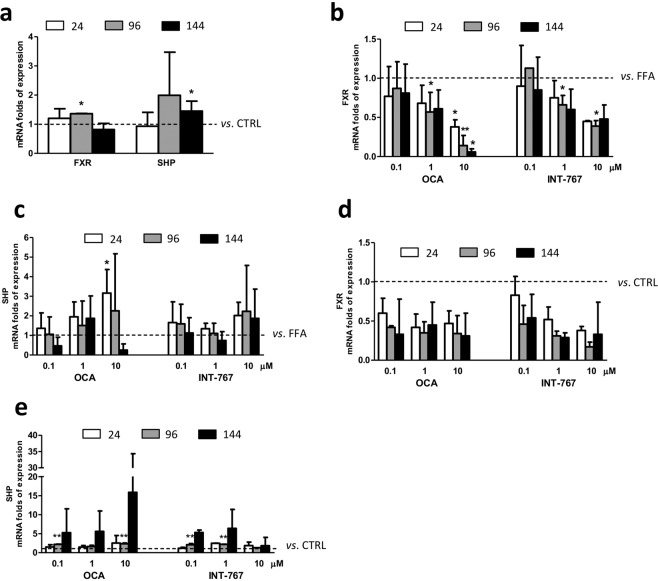
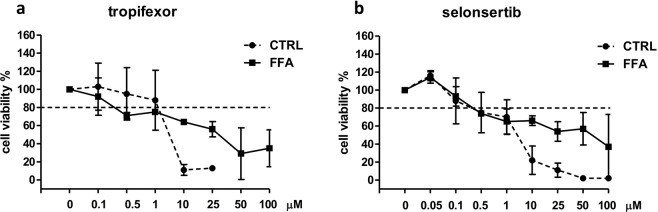
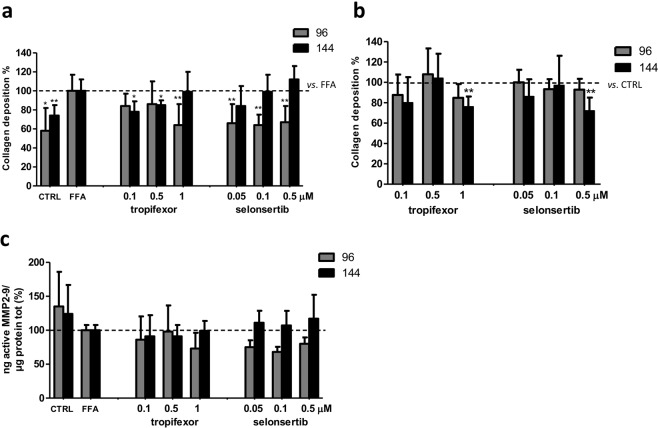
Pharmacological treatments for non-alcoholic steatohepatitis (NASH) are still unsatisfactory. Fibrosis is the most significant predictor of mortality and many anti-fibrotic agents are under evaluation. Herein, we assessed in vitro the effects of the FXR agonist obeticholic acid (OCA) and the dual FXR/TGR5 agonist INT-767 in a well-established co-culture NASH model. Co-cultures of human hepatoma and hepatic stellate (HSCs) cells were exposed to free fatty acids (FFAs) alone or in combination with OCA or INT-767. mRNA expression of HSCs activation markers and FXR engagement were evaluated at 24, 96 and 144 hours. Collagen deposition and metalloproteinase 2 and 9 (MMP2-9) activity were compared to tropifexor and selonsertib. FFAs induced collagen deposition and MMP2-9 activity reduction. Co-treatment with OCA or INT-767 did not affect ACTA2 and COL1A1 expression, but significantly reduced FXR and induced SHP expression, as expected. OCA induced a dose-dependent reduction of collagen and induced MMP2-9 activity. Similarly, INT-767 induced collagen reduction at 96 h and a slight increase in MMP2-9. Tropifexor and Selonsertib were also effective in collagen reduction but showed no modulation of MMP2-9. All tested compounds reduced collagen deposition. OCA exerted a more potent and long-lasting effect, mainly related to modulation of collagen turn-over and MMP2-9 activity.


Conflict of interest statement

This research was funded by Intercept Pharmaceuticals, Inc. The funders had no role in the design of the study; in the collection, analyses, or interpretation of data; in the writing of the manuscript, or in the decision to publish the results. L.A. is an Intercept Pharmaceutical consultant. B.A., C.T., N.R. have no conflict of interest to declare.

Figures

Figure 1
Figure 1
Dose-response curves for OCA and INT-767. (a) Simultaneous co-cultures (SCC) were treated with increasing concentrations of OCA (left panel) or INT-767 (right panel) with (full line) or without (dashed line) FFAs for 144 hours. Monocultures of hepatocytes (b) and HSCs (c) were treated with the selected concentrations of OCA (left panel) or INT-767 (right panel) with (full line) or without (dashed line) FFAs for 144 hours. Horizontal dashed bars indicate the cutoff. Data is represented as mean ± SD of at least three independent biological replicates.
Figure 2
Figure 2
Activation of HSCs. (a) ACTA2 mRNA expression upon FFAs exposure vs. CTRL. (b) ACTA2 expression following treatment with FFAs and FXR agonists vs. FFAs (dashed bar). (c) ACTA2 expression following OCA and INT-767 treatment vs. CTRL (dashed line). Data is represented as mean ± SD of at least three independent biological replicates. *p < 0.05; **p < 0.01 vs. FFAs (b) or CTRL (c).
Figure 3
Figure 3
Collagen biosynthesis. (a) Col1A1 gene expression upon FFAs exposure vs. CTRL (dashed bar). (b) Col1A1 mRNA expression following treatment with FFAs and FXR agonists vs. FFAs (dashed bar). (c) Quantification of extracellular COL1A1 deposition upon FFAs exposure vs. CTRL (dashed bar). (d) Quantification of extracellular COL1A1 deposition following treatment with FFAs and FXR agonists vs. FFAs (dashed line). (e) Col1A1 gene expression upon FXR agonists treatment vs. CTRL (dashed line). (f) Quantification extracellular COL1A1 deposition upon FXR agonists treatment vs. CTRL (dashed line). Data is represented as mean ± SD of at least three independent biological replicates. *p < 0.05; **p < 0.01 vs. FFAs (bd) or CTRL (A-C-E-F).
Figure 4
Figure 4
MMP2-9 activity. Enzymatic activity of active MMP2-9 was analyzed in the supernatant of SCC treated with FFAs and FXR agonist compounds after (a) 96 and (b) 144 hours of treatment. Activity was normalized to the total proteins in the cell lysate and reported as percentage vs. FFAs treated sample. Data is represented as mean ± SD of at least three independent biological replicates. *p < 0.05 vs. FFAs; #p < 0.05 vs. CTRL.
Figure 5
Figure 5
FXR pathway gene analysis. (a) FXR and SHP gene expression upon FFAs exposure vs. CTRL. (b) FXR gene expression upon FFAs and FXR agonists treatment vs. FFAs (dashed bar). (c) SHP gene expression upon FFAs and FXR agonists treatment vs. FFAs (dashed line). (d) FXR gene expression upon OCA and INT-767 treatment vs. CTRL (dashed line) (e) SHP gene expression upon OCA and INT-767 treatment vs. CTRL (dashed line). Data is represented as mean ± SD of at least three independent biological replicates. *p < 0.05; **p < 0.01 vs. FFAs (b,c) or CTRL (A-C-D).
Figure 6
Figure 6
Dose-response curves for tropifexor and selonsertib. Simultaneous co-cultures were treated with increasing concentrations of tropifexor (a) or selonsertib (b) with (full line) or without (dashed line) FFAs for 144 hours. Horizontal dashed bars indicate the cutoff. Data is represented as mean ± SD of at least three independent biological replicates.
Figure 7
Figure 7
Collagen turnover upon tropifexor or selonsertib treatment. (a) Extracellular quantification of the total collagen upon FFAs and FXR agonists treatment vs. FFAs (dashed line). (b) or upon FXR agonists treatment vs. CTRL (dashed line). (c) Active MMP2-9 was quantified in the supernatant of SCC treated with FFAs and FXR agonists after 96 and 144 hours. Activity was normalized to the total proteins in the cell lysate and reported as percentage vs. FFAs treated sample. Data is represented as mean ± SD of at least three independent biological replicates. *p < 0.05; **p < 0.01 vs. FFAs (a) or CTRL (b).

Similar articles

Cited by

References

    1. Younossi Z, et al. Global burden of NAFLD and NASH: trends, predictions, risk factors and prevention. Nat. Rev. Gastroenterol. Hepatol. 2017;15:11–20. doi: 10.1038/nrgastro.2017.109. - DOI - PubMed
    1. Araújo AR, Rosso N, Bedogni G, Tiribelli C, Bellentani S. Global epidemiology of non-alcoholic fatty liver disease/non-alcoholic steatohepatitis: What we need in the future. Liver Int. Off. J. Int. Assoc. Study Liver. 2018;38(Suppl 1):47–51. - PubMed
    1. Angulo P, et al. Liver Fibrosis, but No Other Histologic Features, Is Associated With Long-term Outcomes of Patients With Nonalcoholic Fatty Liver Disease. Gastroenterology. 2015;149:389–397.e10. doi: 10.1053/j.gastro.2015.04.043. - DOI - PMC - PubMed
    1. Friedman SL. Hepatic stellate cells: protean, multifunctional, and enigmatic cells of the liver. Physiol. Rev. 2008;88:125–172. doi: 10.1152/physrev.00013.2007. - DOI - PMC - PubMed
    1. Adorini L, Pruzanski M, Shapiro D. Farnesoid X receptor targeting to treat nonalcoholic steatohepatitis. Drug Discov. Today. 2012;17:988–997. doi: 10.1016/j.drudis.2012.05.012. - DOI - PubMed

Publication types

MeSH terms

Substances