. 2020 May;4(5):517-530.
doi: 10.1038/s41562-020-0819-8. Epub 2020 Feb 3.

Neural and sociocultural mediators of ethnic differences in pain

Affiliations

Neural and sociocultural mediators of ethnic differences in pain

Elizabeth A Reynolds Losin et al. Nat Hum Behav. 2020 May.

Erratum in

Abstract

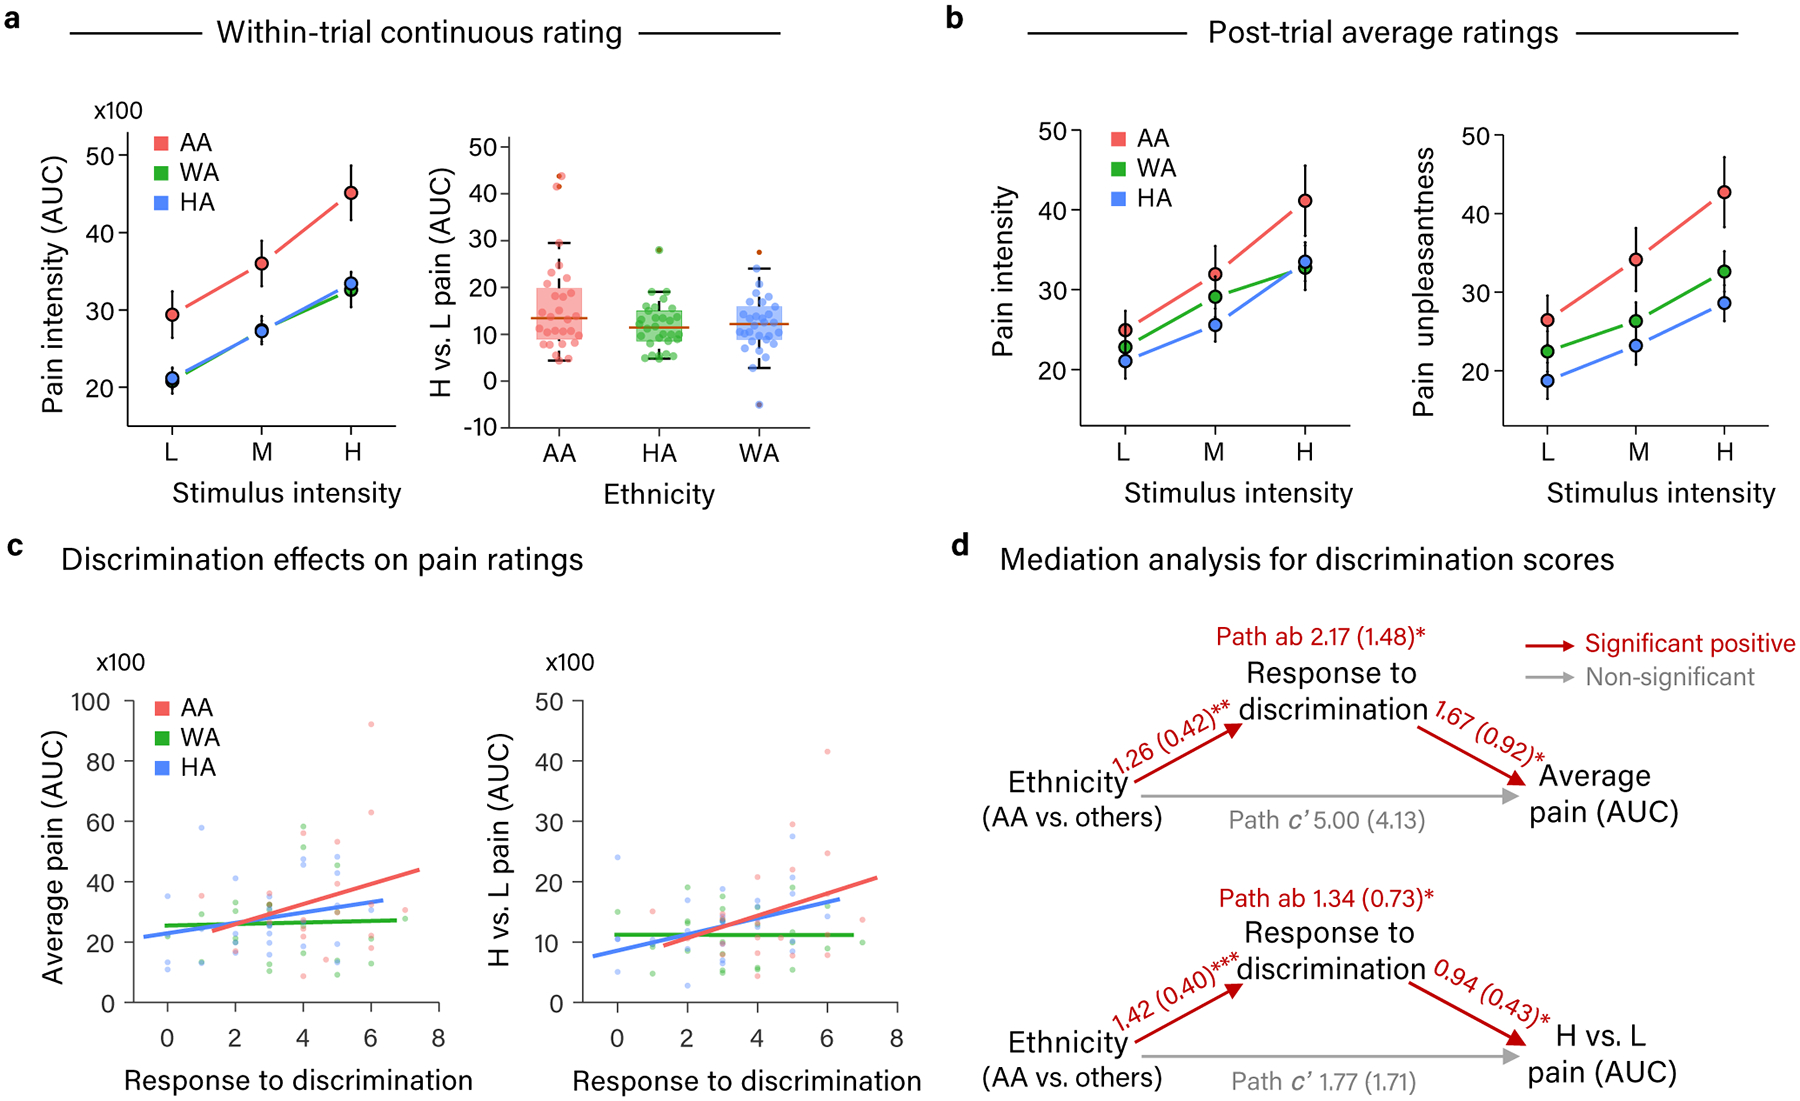
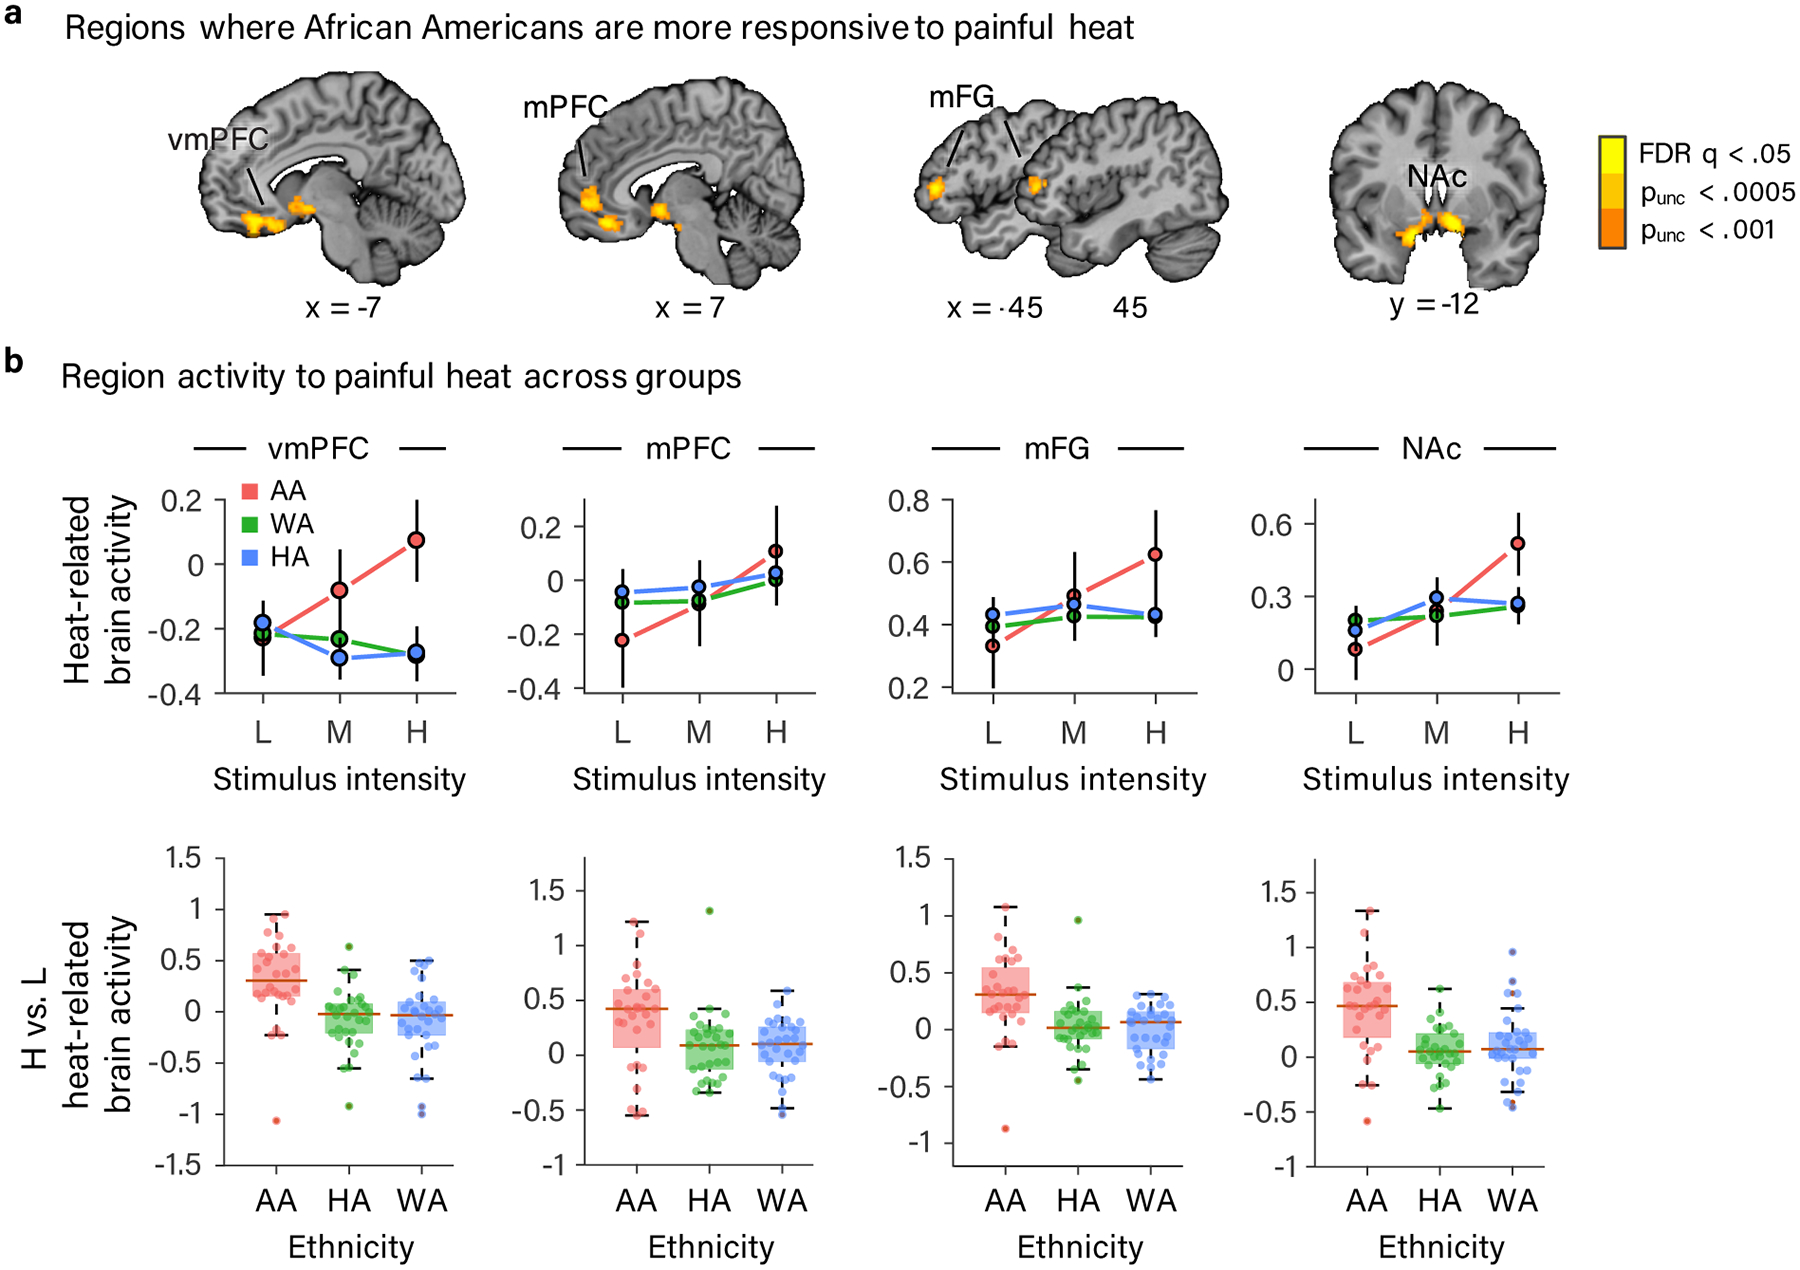
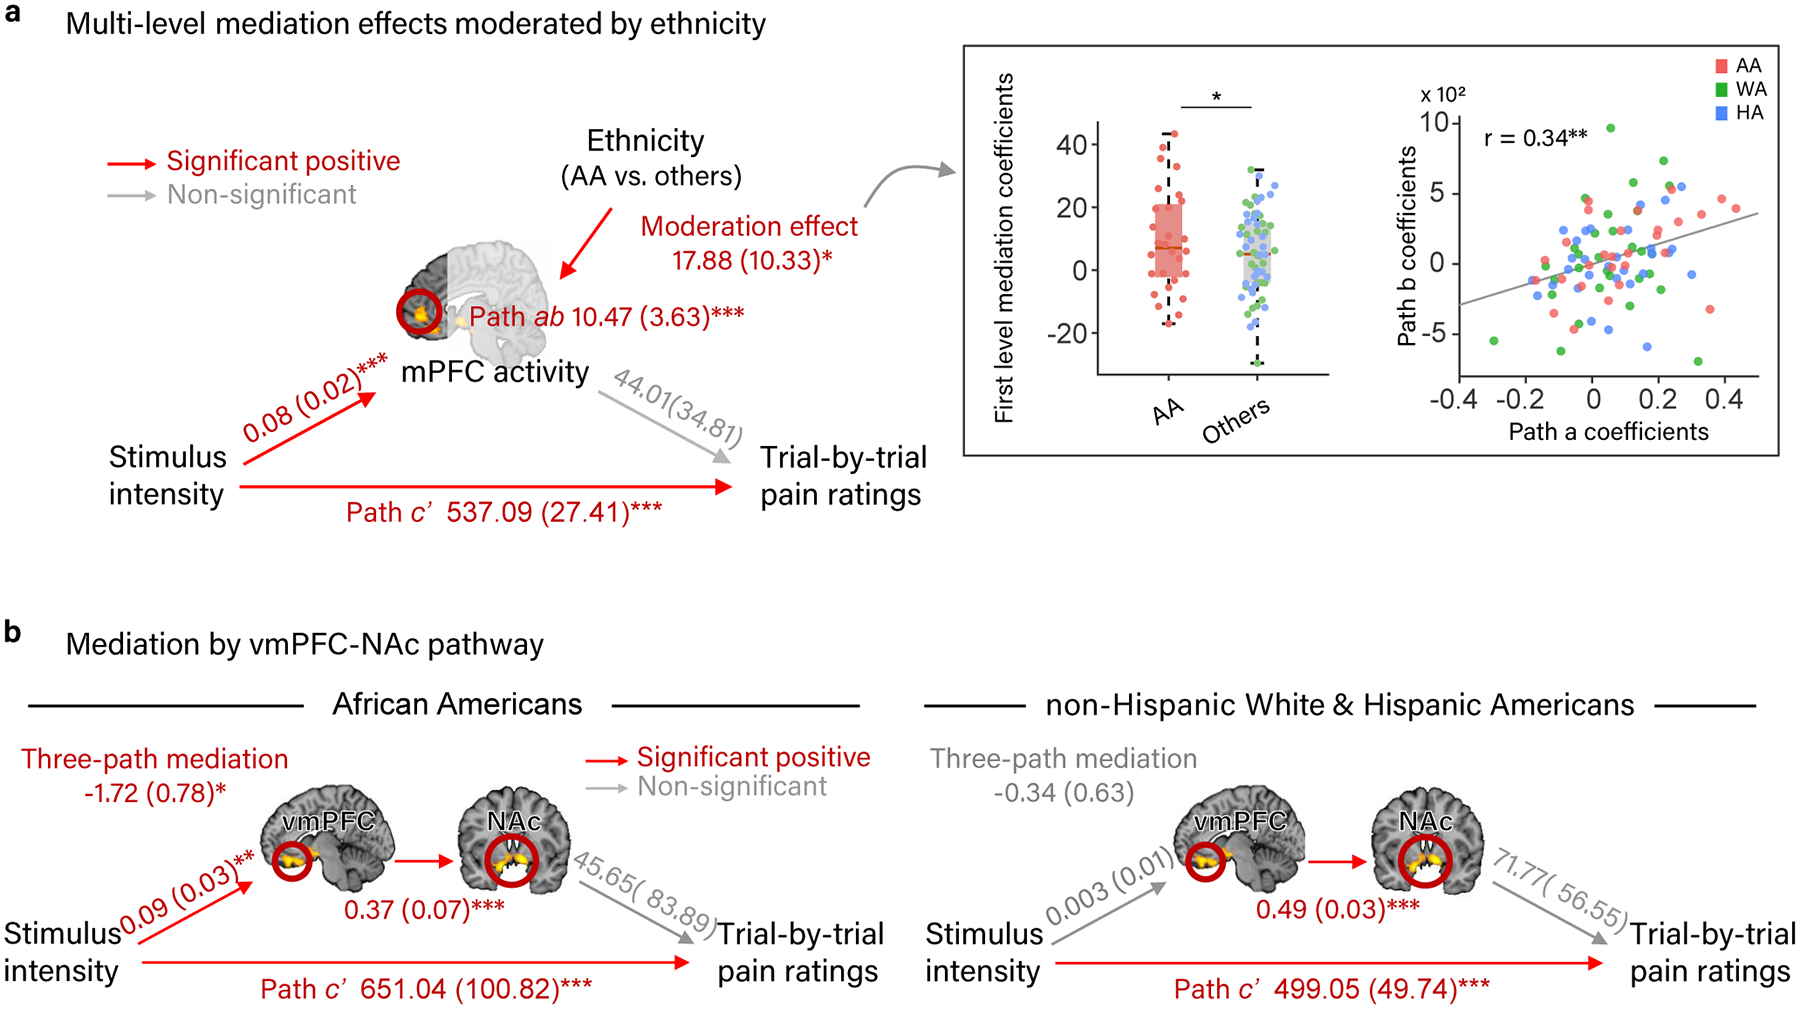
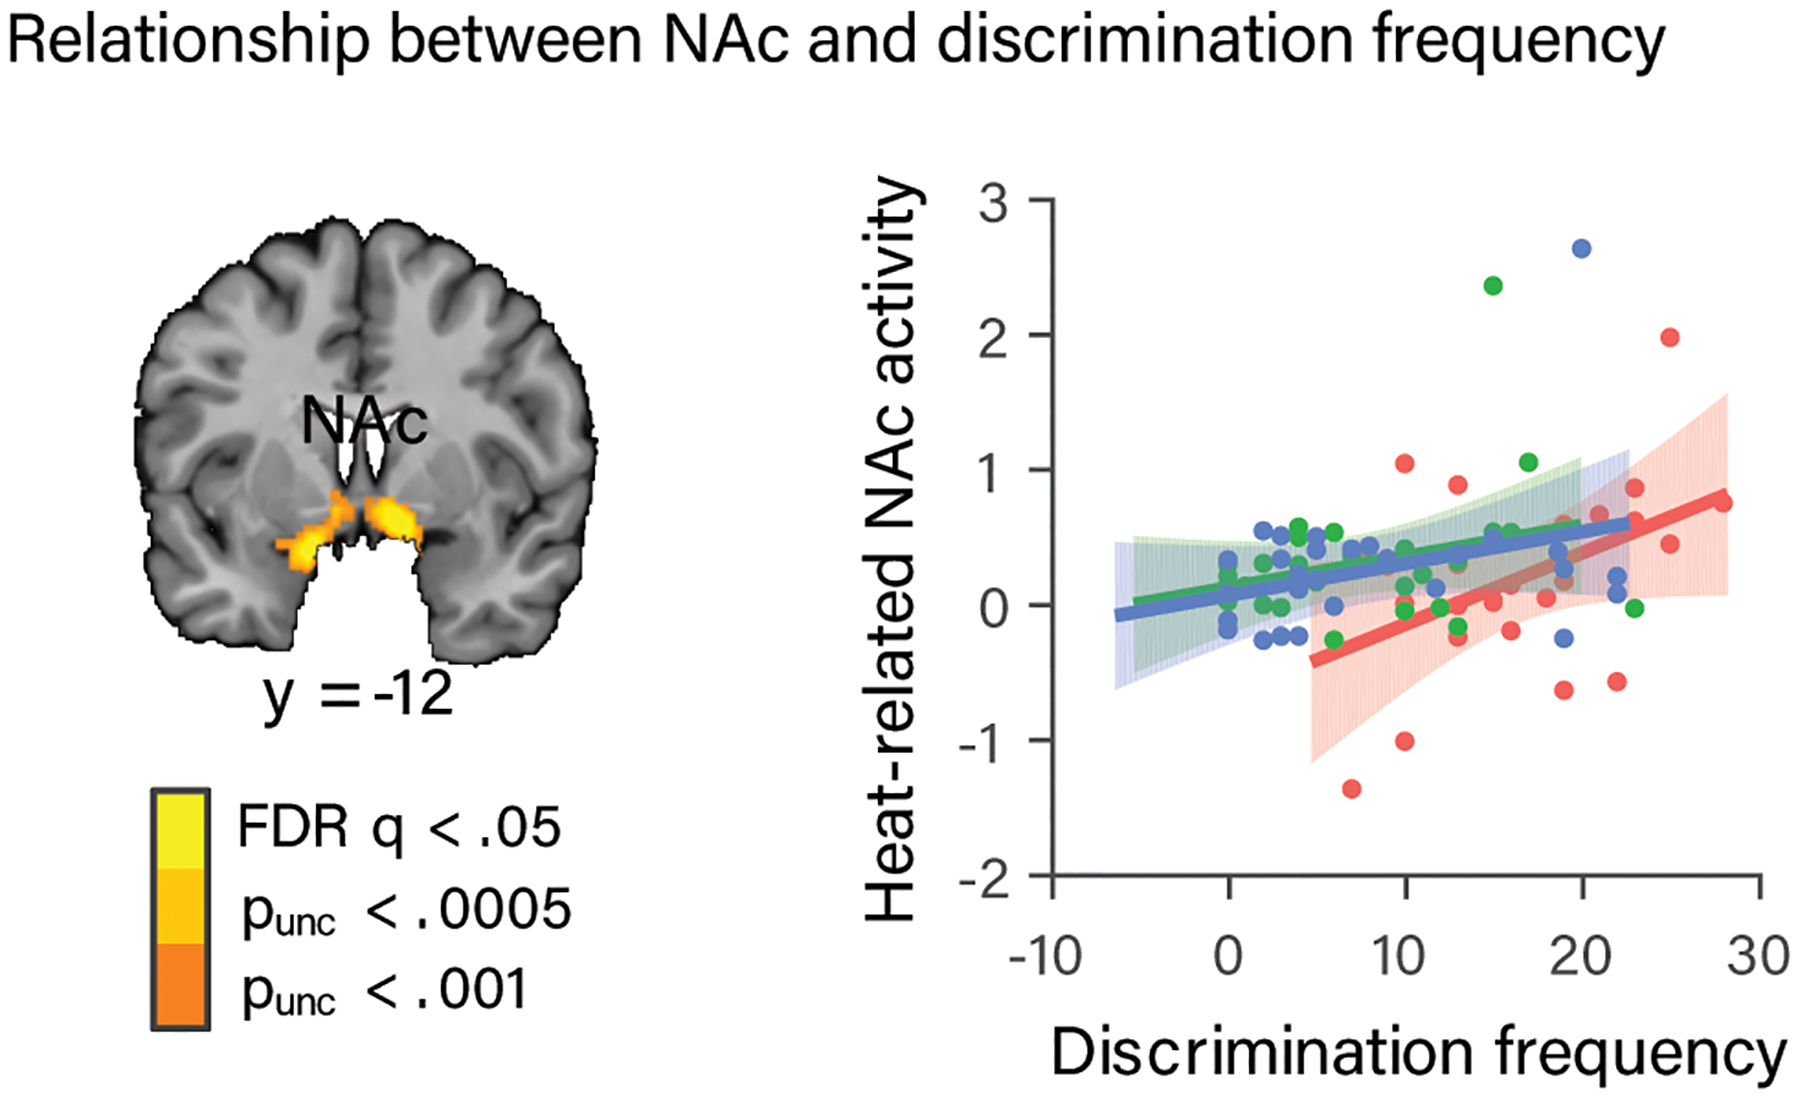
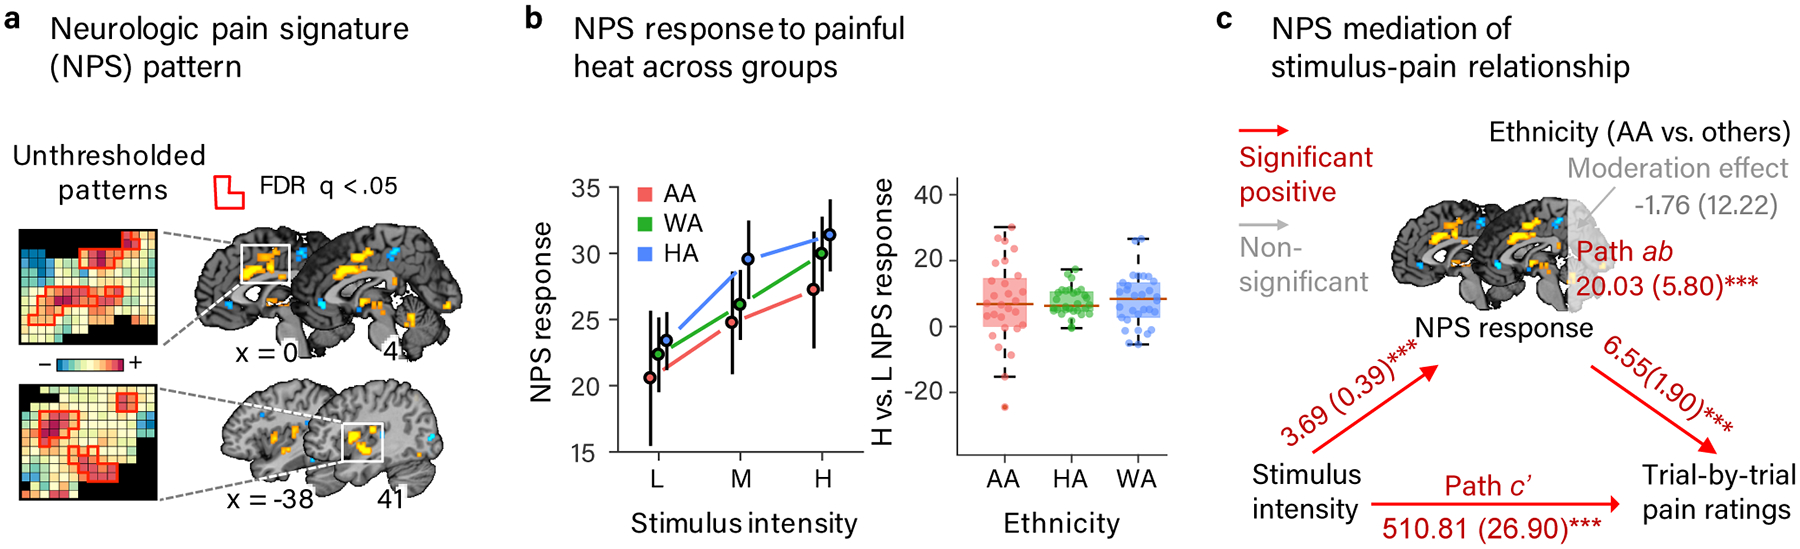
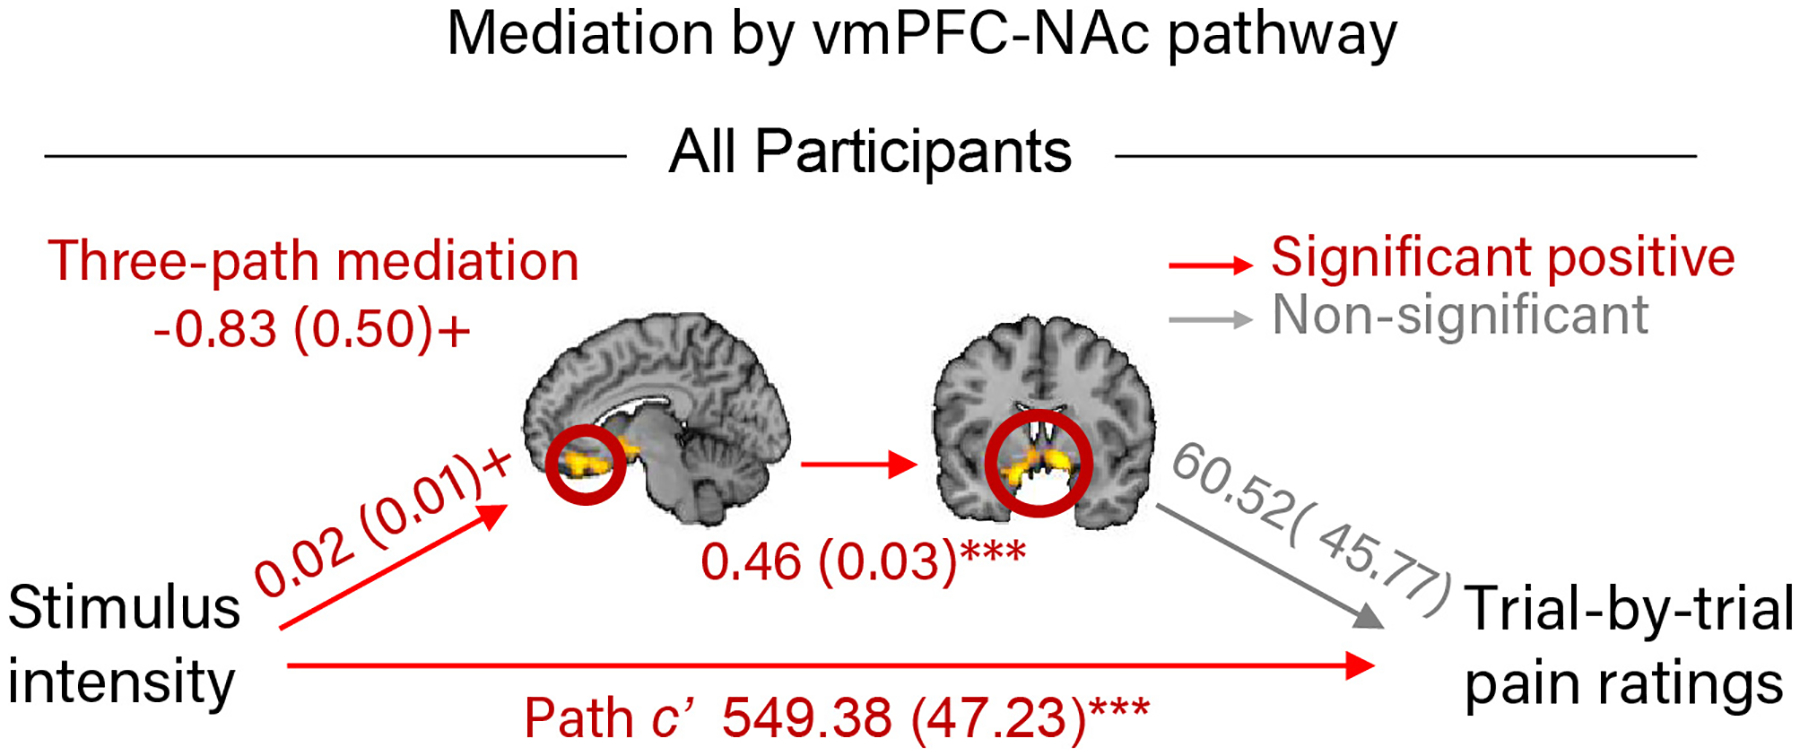
Understanding ethnic differences in pain is important for addressing disparities in pain care. A common belief is that African Americans are hyposensitive to pain compared to Whites, but African Americans show increased pain sensitivity in clinical and laboratory settings. The neurobiological mechanisms underlying these differences are unknown. We studied an ethnicity- and gender-balanced sample of African Americans, Hispanics and non-Hispanic Whites using functional magnetic resonance imaging during thermal pain. Higher pain report in African Americans was mediated by discrimination and increased frontostriatal circuit activations associated with pain rating, discrimination, experimenter trust and extranociceptive aspects of pain elsewhere. In contrast, the neurologic pain signature, a neuromarker sensitive and specific to nociceptive pain, mediated painful heat effects on pain report largely similarly in African American and other groups. Findings identify a brain basis for higher pain in African Americans related to interpersonal context and extranociceptive central pain mechanisms and suggest that nociceptive pain processing may be similar across ethnicities.


Conflict of interest statement

Competing Interest Statement

The authors declare no competing interests.

Figures

Figure 1.
Figure 1.
fMRI thermal stimulation task design.
Figure 2.
Figure 2.
Differences in pain rating across ethnic groups and mediation by discrimination. (a) Graphs of mean area under the curve of within-trial pain intensity rating (present on all trials) at each temperature of heat stimulation (left: line plot) and the difference between high and low heat stimulation (right: box plot) in each ethnic group. Box plot elements: red center line, median; box limits, upper and lower quartiles; whiskers, limits of non-outlier data; points matched to box shading, subject means; dark red points, outliers. (b) Graphs of mean post-trial pain intensity (left graph) and pain unpleasantness (right graph) rating (present on 1/4 of trials) at each temperature of heat stimulation in each ethnic group. (a-b) AA participants rated pain as more intense and unpleasant than HA and WA participants and exhibited a steeper dose-response relationship with painful stimulus intensity. Error bars represent within-subject standard error of the mean (SEM). Data are from 88 participants. (c) Relationship between participants’ frequency of responding to discrimination (e.g., by filing a complaint) and the area under the curve of their within-trial pain intensity rating. Average pain rating across three stimulation temperatures is depicted in the left panel, and average pain rating for high minus low temperatures is depicted on the right panel. (a-c) Values for area under the curve of continuous within-trial pain intensity rating depicted on Y axes have been divided by 100. (d) Path diagrams and statistics for mediation analyses of participant ethnicity effects [AA vs (HA +WA)] on pain rating by participants’ frequency of responding to discrimination. Participants’ frequency of responding to discrimination significantly mediated higher pain reports and a steeper dose-response relationship with painful stimulus intensity in AA compared to HA and WA participants. Path coefficients are listed for each path with standard errors in parentheses. * = p < .05, ** = p < .01, *** = p < .001. (c-d) Data are from the 81 participants who completed the response to discrimination measure.
Figure 3.
Figure 3.
Results of whole-brain voxel-wise GLM analysis showing brain regions exhibiting a stronger dose-response effect of painful heat in AA participants. (a) vmPFC, mPFC, bilateral mFG and bilateral NAc exhibited a steeper dose-response effect of painful stimulus intensity in AA compared to HA and WA participants (FDR corrected q < .05 (p < .000047)). For the purposes of display, we included voxels meeting two additional, more liberal, uncorrected voxel-wise thresholds (p < .0005 and p < .001) that were in contact with voxels meeting the more stringent FDR corrected threshold. (b) Data from the four regions (defined at p < .001, uncorrected and combining across hemispheres for bilaterally activated NAc and mFG). Top row: line plots depicting the mean parameter estimate for each level of stimulus intensity in each ethnic group plotted with error bars representing the within-subject SEM. In bottom row are box plots of the mean parameter estimate difference between high and low stimulus intensity in each ethnic group. Box plot elements: red center line, median; box limits, upper and lower quartiles; whiskers, limits of non-outlier data; points matched to box shading, subject means; dark red points, outliers. (a-b) Data are from 88 participants.
Figure 4.
Figure 4.
Mediation analyses showing that brain regions exhibiting a stronger dose-response effect of painful heat in AA participants in the whole-brain analysis mediate the relationship between painful stimulus intensity and pain rating differently in the AA group compared to the HA and WA groups. (a) Path diagram and statistics for moderated, multi-level mediation analysis between painful stimulus intensity, the mPFC region from the whole-brain analysis, and trial-by-trial pain rating, moderated by participant ethnicity [AA - (HA +WA)]. The mPFC mediated the relationship between painful stimulus intensity and pain rating to a greater degree in the AA groups than in the HA and WA groups. (b) Path diagrams and statistics for three-path, multi-level mediation analyses between painful stimulus intensity, connectivity between the vmPFC and NAc regions from the whole-brain analysis, and trial-by-trial pain rating in the AA and the non-AA (WA + HA) groups separately. Connectivity between the vmPFC and NAc mediated the relationship between painful stimulus intensity and pain rating in the AA group only. Path coefficients are listed for each path with standard errors in parentheses. Data are from 88 participants.
Figure 5.
Figure 5.
Relationship between NAc activity and discrimination frequency. (a) NAc region from the whole-brain analysis identified as exhibiting a steeper dose-response effect of stimulus intensity on brain activity in AA participants. (b) Painful heat-related activity (parameter estimates) from this NAc region plotted as a function of discrimination frequency, with regression lines and standard error bands for each ethnic group. Average activity during painful heat within this NAc region increased with increasing discrimination frequency, and this relationship was stronger for the AA than non-AA (HA + WA) group. Dots indicate individual participants. Data are from the 83 participants who completed the discrimination frequency measure.
Figure 6.
Figure 6.
Neurologic pain signature (NPS) responses to painful heat and relationship with pain rating across ethnic groups. (a) The NPS pattern, an a priori multivariate pattern of fMRI signal that is sensitive and specific to nociceptive physical pain. (b) Mean NPS respopnse to each temperature of heat stimulation (left: line plot) and the difference between high and low heat stimulation (right: box plot) in each ethnic group. Error bars represent within-subject SEM. Box plot elements: red center line, median; box limits, upper and lower quartiles; whiskers, limits of non-outlier data; points matched to box shading, subject means; dark red points, outliers. NPS response values indicate the strength of the signature response pattern expression and are calculated by taking a dot-product of the NPS pattern weights and activation maps for each single heat trial. NPS responses increased with painful stimulus intensity across ethnic groups and neither the average NPS response nor the dose-response relationship with painful stimulus intensity statistically significantly differed between ethnic groups and we found substantial-strong evidence for their equivalence. (c) Path diagram from multi-level mediation analysis between painful stimulus intensity, NPS pattern expression during painful heat, and trial-by-trial pain rating moderated by participants’ ethnic group ([AA – (HA+ WA)]. The NPS mediated the relationship between painful stimulus intensity and pain rating and this effect did not statistically significantly differ between AA and non-AA (HA & WA) participants and we found substantial-strong evidence of its equivalence. Path coefficients are listed for each path with standard errors in parentheses. Data are from 88 participants.
None
None

Similar articles

Cited by

References

    1. Trawalter S & Hoffman KM Got pain? Racial bias in perceptions of pain. Social and Personality Psychology Compass 9, 146–157, doi:10.1111/spc3.12161 (2015). - DOI
    1. Hoffman KM, Trawalter S, Axt JR & Oliver MN Racial bias in pain assessment and treatment recommendations, and false beliefs about biological differences between blacks and whites. Proceedings of the National Academy of Sciences 113, 4296–4301, doi:10.1073/pnas.1516047113 (2016). - DOI - PMC - PubMed
    1. National Center for Health Statistics (US). Health, United States, 2015: with special feature on racial and ethnic health disparities. (National Center for Health Statistics (US), Hyattsville, MD, 2016). - PubMed
    1. Anderson KO, Green CR & Payne R Racial and ethnic disparities in pain: causes and consequences of unequal care. The Journal of Pain 10, 1187–1204, doi:10.1016/j.jpain.2009.10.002 (2009). - DOI - PubMed
    1. Rahim‐Williams B, Riley JL, Williams AK & Fillingim RB A quantitative review of ethnic group differences in experimental pain response: Do biology, psychology, and culture matter? Pain Medicine 13, 522–540, doi:10.1111/j.1526-4637.2012.01336.x (2012). - DOI - PMC - PubMed

Publication types