Clinical Trial
. 2020 Jul;34(7):1760-1774.
doi: 10.1038/s41375-020-0723-2. Epub 2020 Feb 3.

Clinical significance of TP53, BIRC3, ATM and MAPK-ERK genes in chronic lymphocytic leukaemia: data from the randomised UK LRF CLL4 trial

Affiliations
Clinical Trial

Clinical significance of TP53, BIRC3, ATM and MAPK-ERK genes in chronic lymphocytic leukaemia: data from the randomised UK LRF CLL4 trial

Stuart J Blakemore et al. Leukemia. 2020 Jul.

Abstract

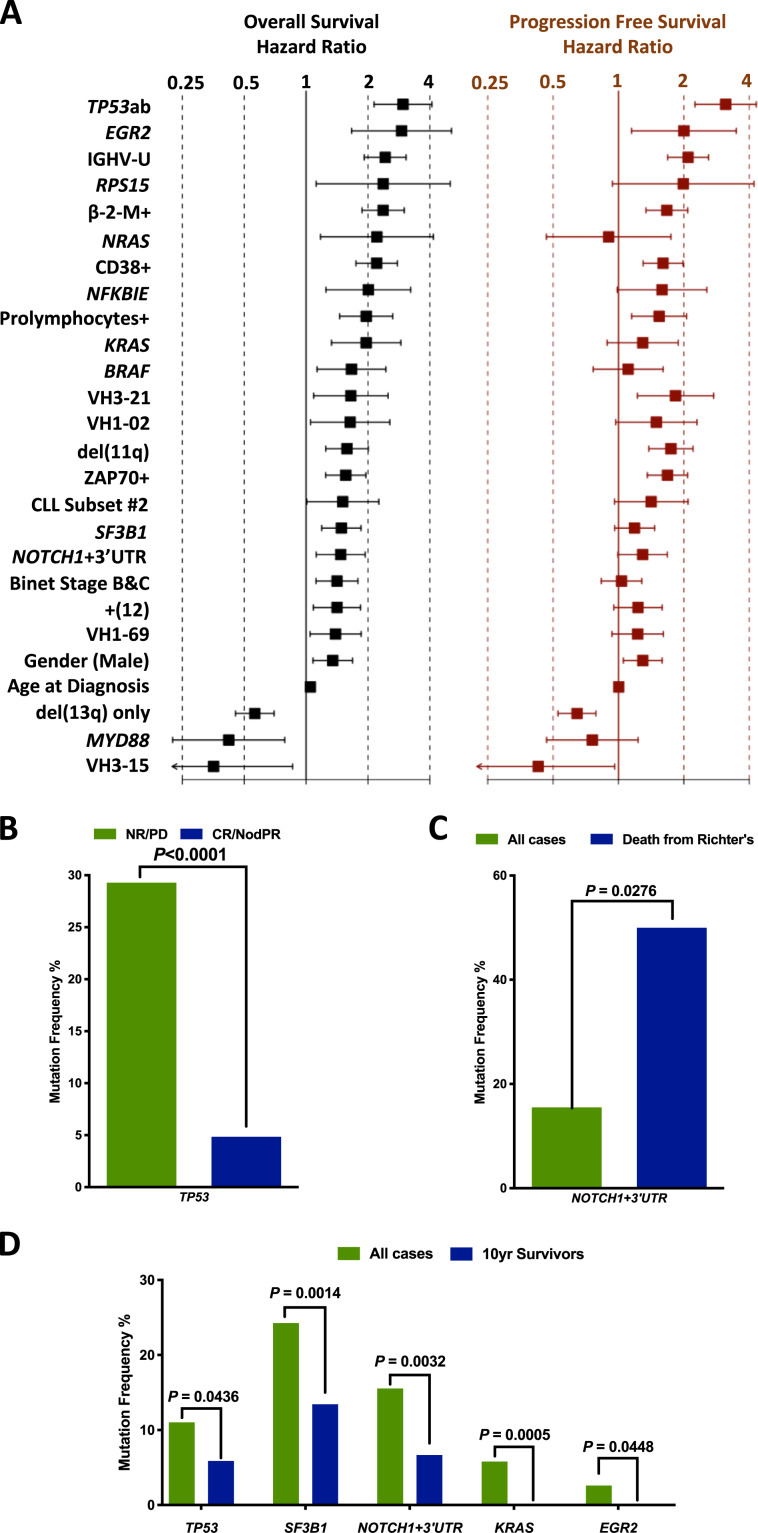
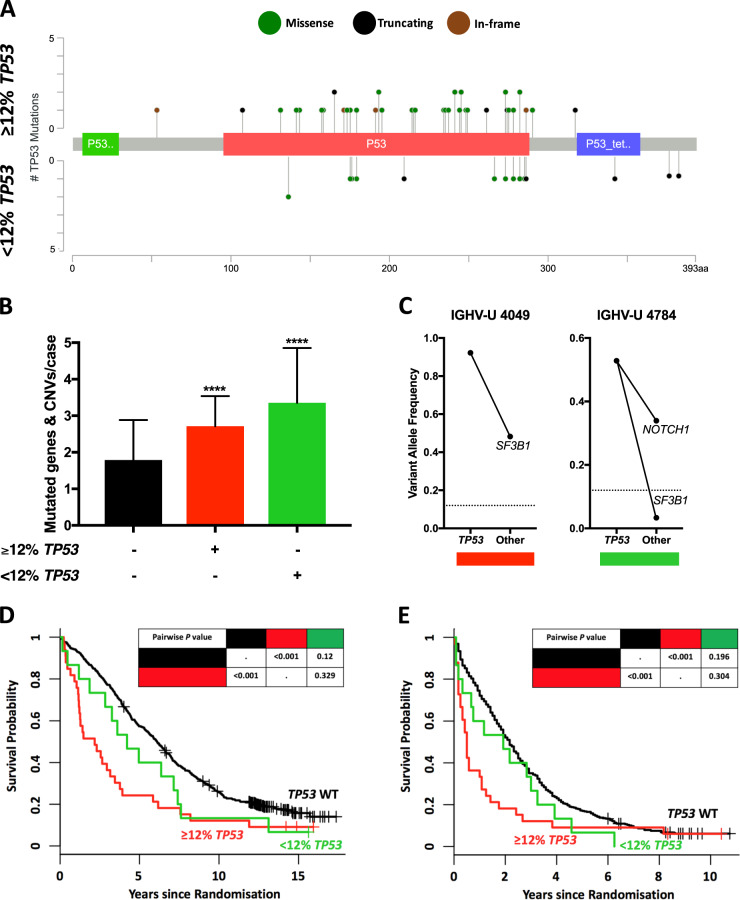
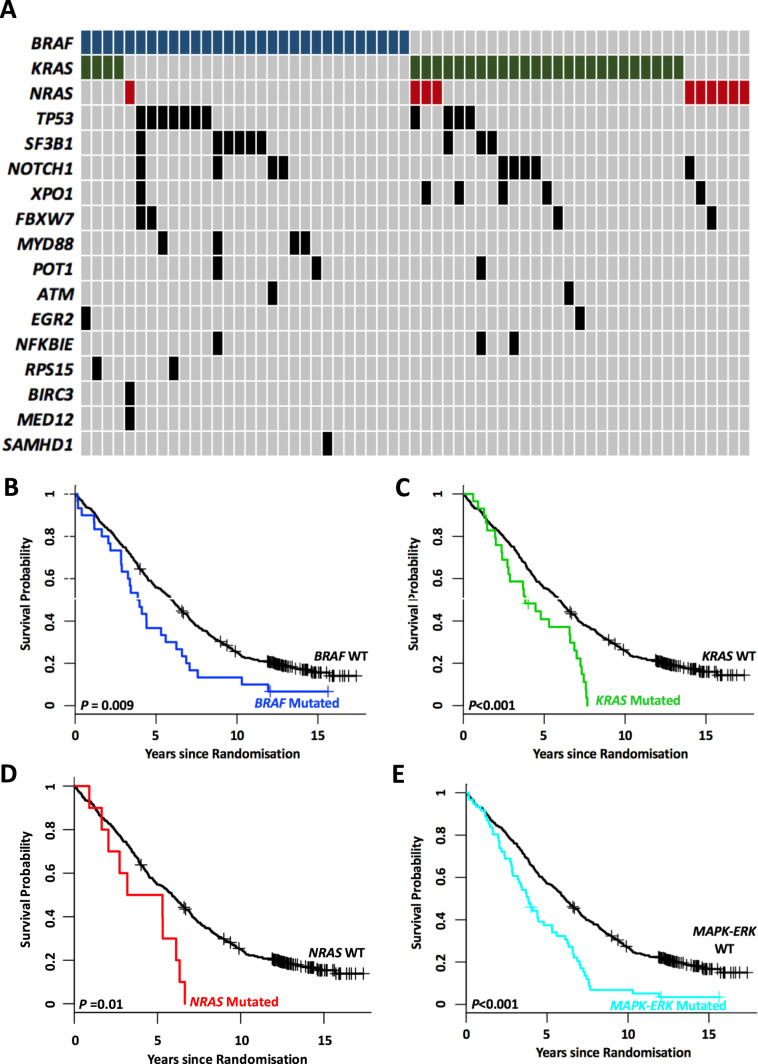
Despite advances in chronic lymphocytic leukaemia (CLL) treatment, globally chemotherapy remains a central treatment modality, with chemotherapy trials representing an invaluable resource to explore disease-related/genetic features contributing to long-term outcomes. In 499 LRF CLL4 cases, a trial with >12 years follow-up, we employed targeted resequencing of 22 genes, identifying 623 mutations. After background mutation rate correction, 11/22 genes were recurrently mutated at frequencies between 3.6% (NFKBIE) and 24% (SF3B1). Mutations beyond Sanger resolution (<12% VAF) were observed in all genes, with KRAS mutations principally composed of these low VAF variants. Firstly, employing orthogonal approaches to confirm <12% VAF TP53 mutations, we assessed the clinical impact of TP53 clonal architecture. Whilst ≥ 12% VAF TP53mut cases were associated with reduced PFS and OS, we could not demonstrate a difference between <12% VAF TP53 mutations and either wild type or ≥12% VAF TP53mut cases. Secondly, we identified biallelic BIRC3 lesions (mutation and deletion) as an independent marker of inferior PFS and OS. Finally, we observed that mutated MAPK-ERK genes were independent markers of poor OS in multivariate survival analysis. In conclusion, our study supports using targeted resequencing of expanded gene panels to elucidate the prognostic impact of gene mutations.


Conflict of interest statement

The authors declare that they have no conflict of interest.

Figures

Fig. 1
Fig. 1. Mutation landscape and co-occurrence associations of the CLL4 cohort.
a Mutational landscape of CLL4. In the Waterfall plot, known recurrently mutated genes and copy number alterations are shown, hierarchically clustered by mutation frequency (vertical bar chart, right). The mutation burden captured by the study is shown in the bar chart above the heat map. Mutation types are depicted in the above key. The inset vertical bar chart represents the distribution of the number of mutated genes/CNAs per case. b Co-occurrence of all available clinico-biological features from the CLL4 clinical trial. The co-occurrence (red) or mutual exclusivity (green) is plotted per interaction in the graph based on the level of significance (from light to dark: P < 0.05, P < 0.01, Q > P [P < 0.05], Q > P [P < 0.01]).
Fig. 2
Fig. 2. CLL4 mutation architecture.
a Distribution of mutation variant allele frequency. Scatter plot of all variants by read depth and VAF (red dots = < 12% VAF [left of dotted line], blue dots = > 12% VAF). b Distribution of ≥12% and <12% variants. Top: Proportion of ≥12% and <12% variants ranked by highest proportion of ≥12% VAF variants. Two-way binomial distribution used to test whether genes contained significantly more ≥12% VAF or <12% VAF mutations, with asterisks representing genes which retained significance after multiple hypothesis testing (Q > P [P < 0.05]). Bottom: VAF distribution of variants per gene. Variants with loss of the other allele (identified by FISH), shown in red for biallelic TP53, turquoise for biallelic ATM and pink for biallelic BIRC3.
Fig. 3
Fig. 3. Clinical outcome of mutated genes, CNAs and clinical features in CLL4.
a Forest plot showing the hazard ratios of 26 significant variables for either overall survival (left; black) or progression-free survival (right; red) in univariate survival analysis. Variables sorted by the hazard ratio values for overall survival. b Bar chart showing the mutation frequency difference between TP53mut cases who achieved CR/NodPR or NR/PD. c Bar chart showing the NOTCH1 + 3′UTR mutation frequency in relation to Death from Richter’s syndrome. d Bar chart showing the mutation frequency in relation to patients termed ‘long-term survivors’ for TP53, SF3B1, NOTCH +3′UTR, KRAS and EGR2.
Fig. 4
Fig. 4. Clinical relevance of <12% VAF TP53 mutations in CLL4.
a Mutation Lolliplot displaying the TP53 mutations observed in CLL4, stratified by Sanger sequencing threshold. b Mutated genes/CNVs per TP53mut subgroup. One-way ANOVA conducted vs. TP53wt cases. c Examples of In-going and out-going edges drawn from each TP53mut subgroup, with patient ID number and IGHV status defined above each graph. d OS pairwise KM plot comparing ≥ 12% VAF TP53mut cases (red), <12% VAF TP53mut cases(green), and TP53wt cases (black). e PFS pairwise KM plot comparing ≥ 12% VAF TP53mut cases (red), <12% VAF TP53mut cases(green), and TP53wt cases (black). Inset table in D&E displays pairwise log rank P values between each variable vs. wild type.
Fig. 5
Fig. 5. Importance of 11q deletion in the context of ATM and BIRC3 mutations in CLL4.
a Mutation Lolliplot of ATM (upper) and BIRC3 (lower) mutations observed in CLL4. b Heat map of ATM and BIRC3 mutated cases stratified by 11q deletion status. c OS pairwise KM plot comparing mutated ATM (left) and BIRC3 (right) in the context of 11q deletion. d PFS pairwise KM plot comparing mutated ATM (left) and BIRC3 (right) in the context of 11q deletion. Inset table in C&D displays pairwise log rank P values between each variable vs. wild type for combined pairwise KM analysis of ATM and BIRC3 in the context of 11q deletion.
Fig. 6
Fig. 6. MAPK-ERK genes predict poor OS in CLL4.
a Heat map of BRAF (blue), KRAS (green), NRAS (red) and co-mutated genes of MAPK-ERK mutated cases (black). Cases wild type for each gene represented by grey bars. Overall survival univariate KM plots for BRAF (b), KRAS (c), NRAS (d), and a combined variable of APK-ERK (e). Coloured line represents mutated cases, black line represents wild-type cases.

References

    1. Puente XS, Beà S, Valdés-Mas R, Villamor N, Gutiérrez-Abril J, Martín-Subero JI, et al. Non-coding recurrent mutations in chronic lymphocytic leukaemia. Nature. 2015;526:519–24. - PubMed
    1. Landau DA, Tausch E, Taylor-weiner AN, Stewart C, Reiter JG, Bahlo J, et al. Mutations driving CLL and their evolution in progression and relapse. Nature. 2015;526:525–30. - PMC - PubMed
    1. Nadeu F, Martín-García D, López-Guillermo A, Navarro A, Colado E, Campo E, et al. Clinical impact of the subclonal architecture and mutational complexity in chronic lymphocytic leukemia. Leukemia. 2017;32:645–53. - PMC - PubMed
    1. Minervini CF, Cumbo C, Orsini P, Brunetti C, Anelli L, Zagaria A, et al. TP53 gene mutation analysis in chronic lymphocytic leukemia by nanopore MinION sequencing. Diagn Pathol. 2016;11:96. - PMC - PubMed
    1. Rossi D, Khiabanian H, Spina V, Ciardullo C, Bruscaggin A, Famà R, et al. Clinical impact of small TP53 mutated subclones in chronic lymphocytic leukemia. Blood. 2014;123:2139–48. - PMC - PubMed

Publication types

MeSH terms