. 2020 Mar;23(3):375-385.
doi: 10.1038/s41593-019-0578-x. Epub 2020 Feb 3.

A myelin-related transcriptomic profile is shared by Pitt-Hopkins syndrome models and human autism spectrum disorder

Affiliations

A myelin-related transcriptomic profile is shared by Pitt-Hopkins syndrome models and human autism spectrum disorder

BaDoi N Phan et al. Nat Neurosci. 2020 Mar.

Abstract

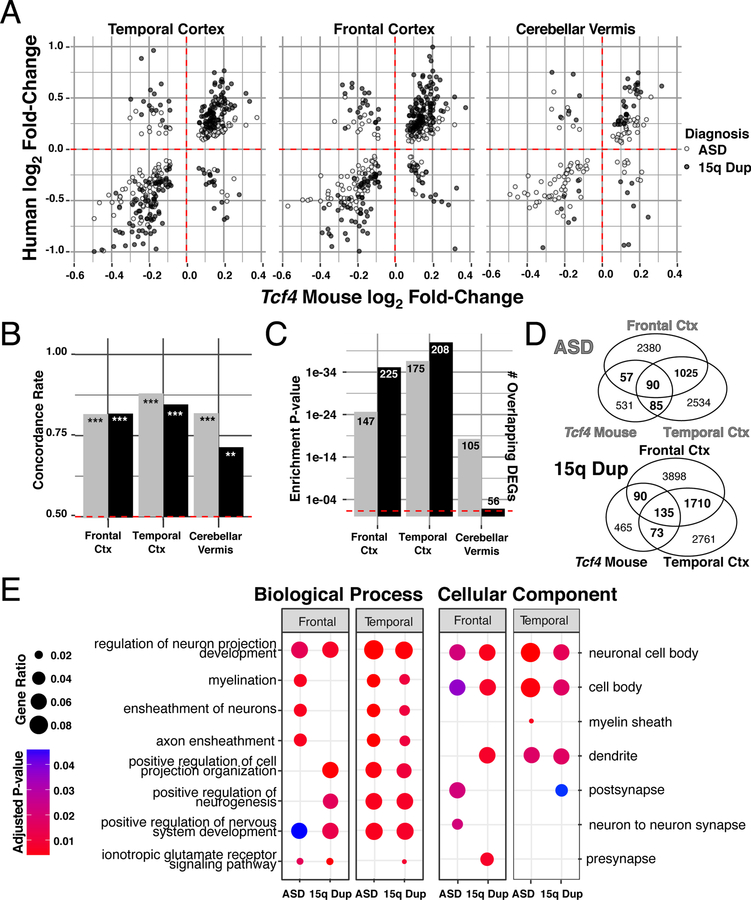
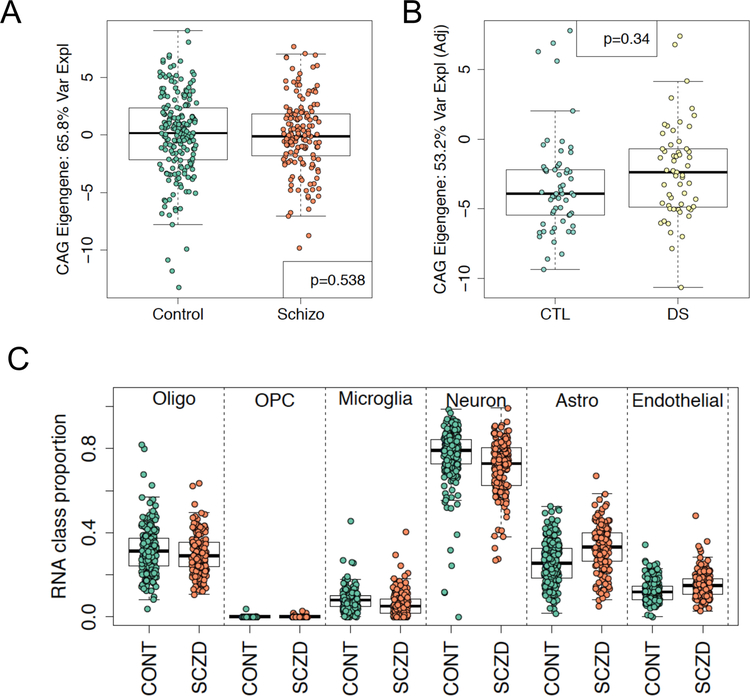
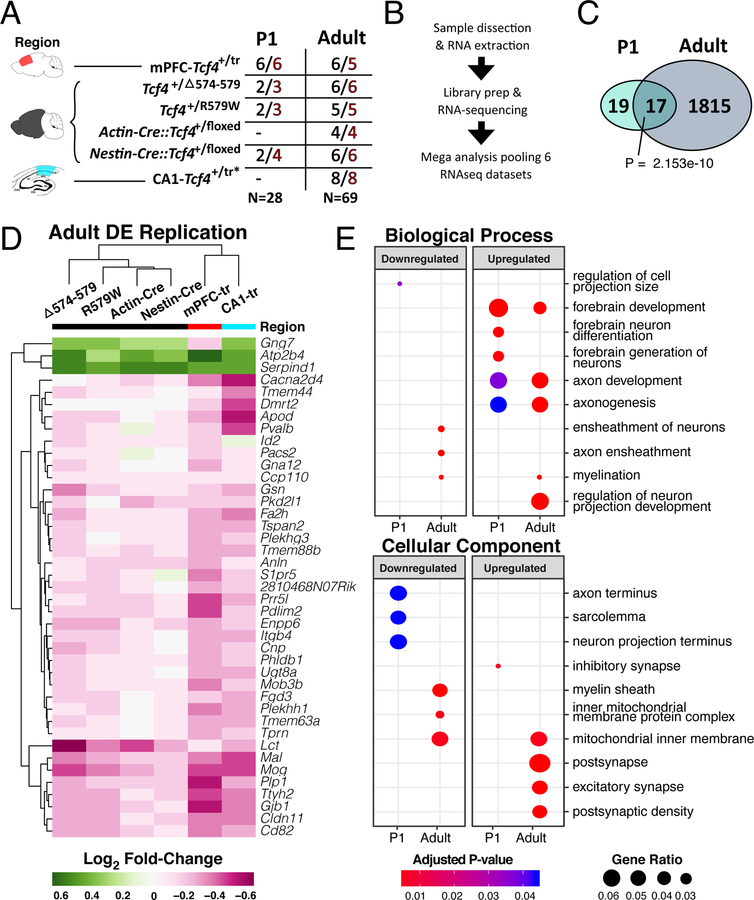
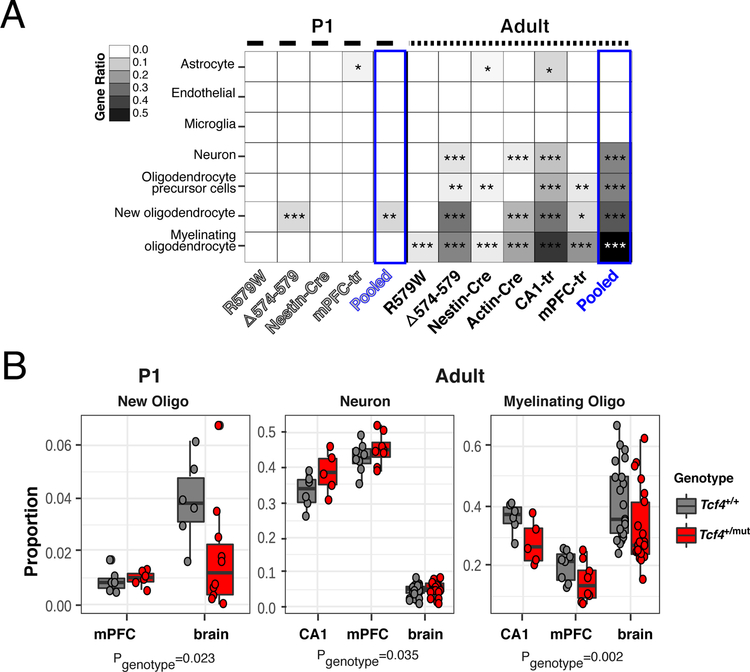
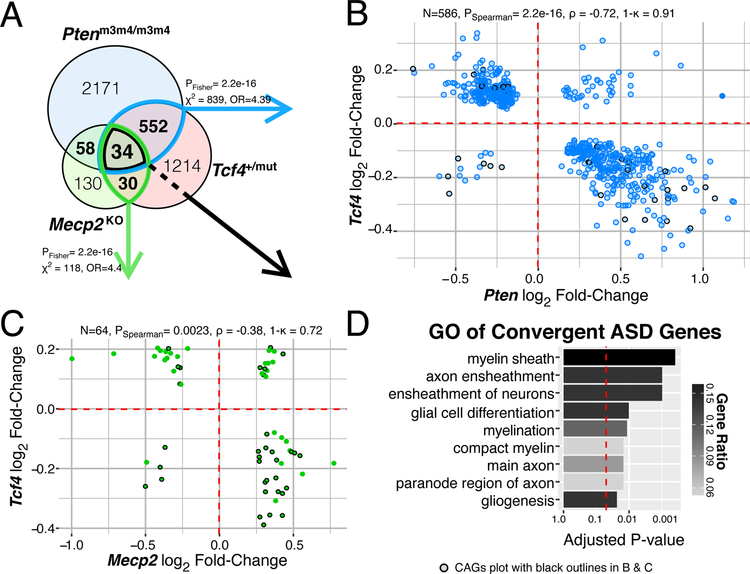
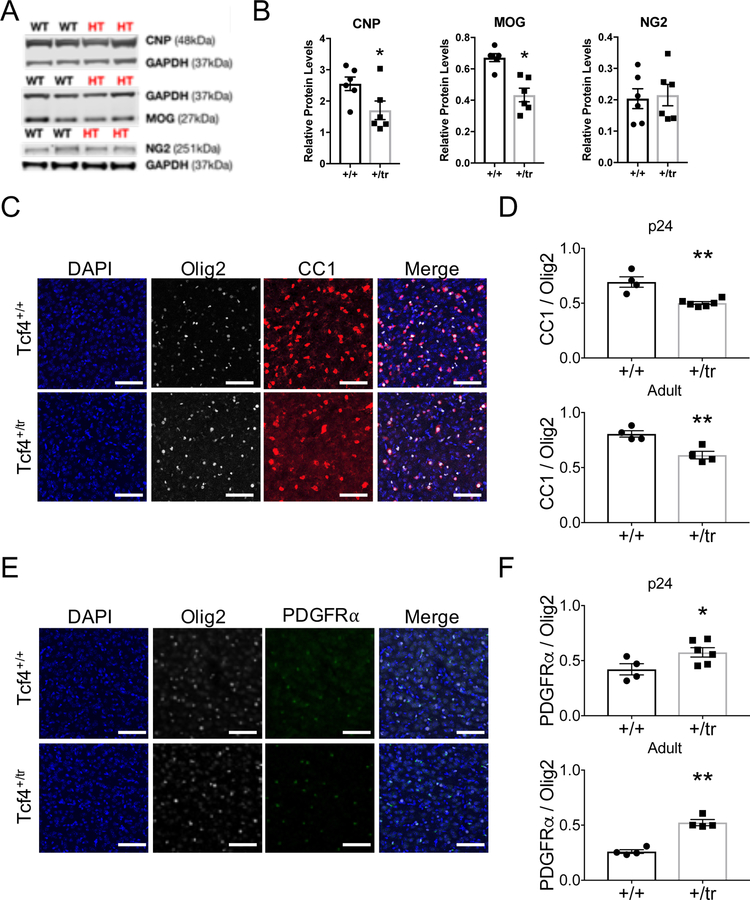
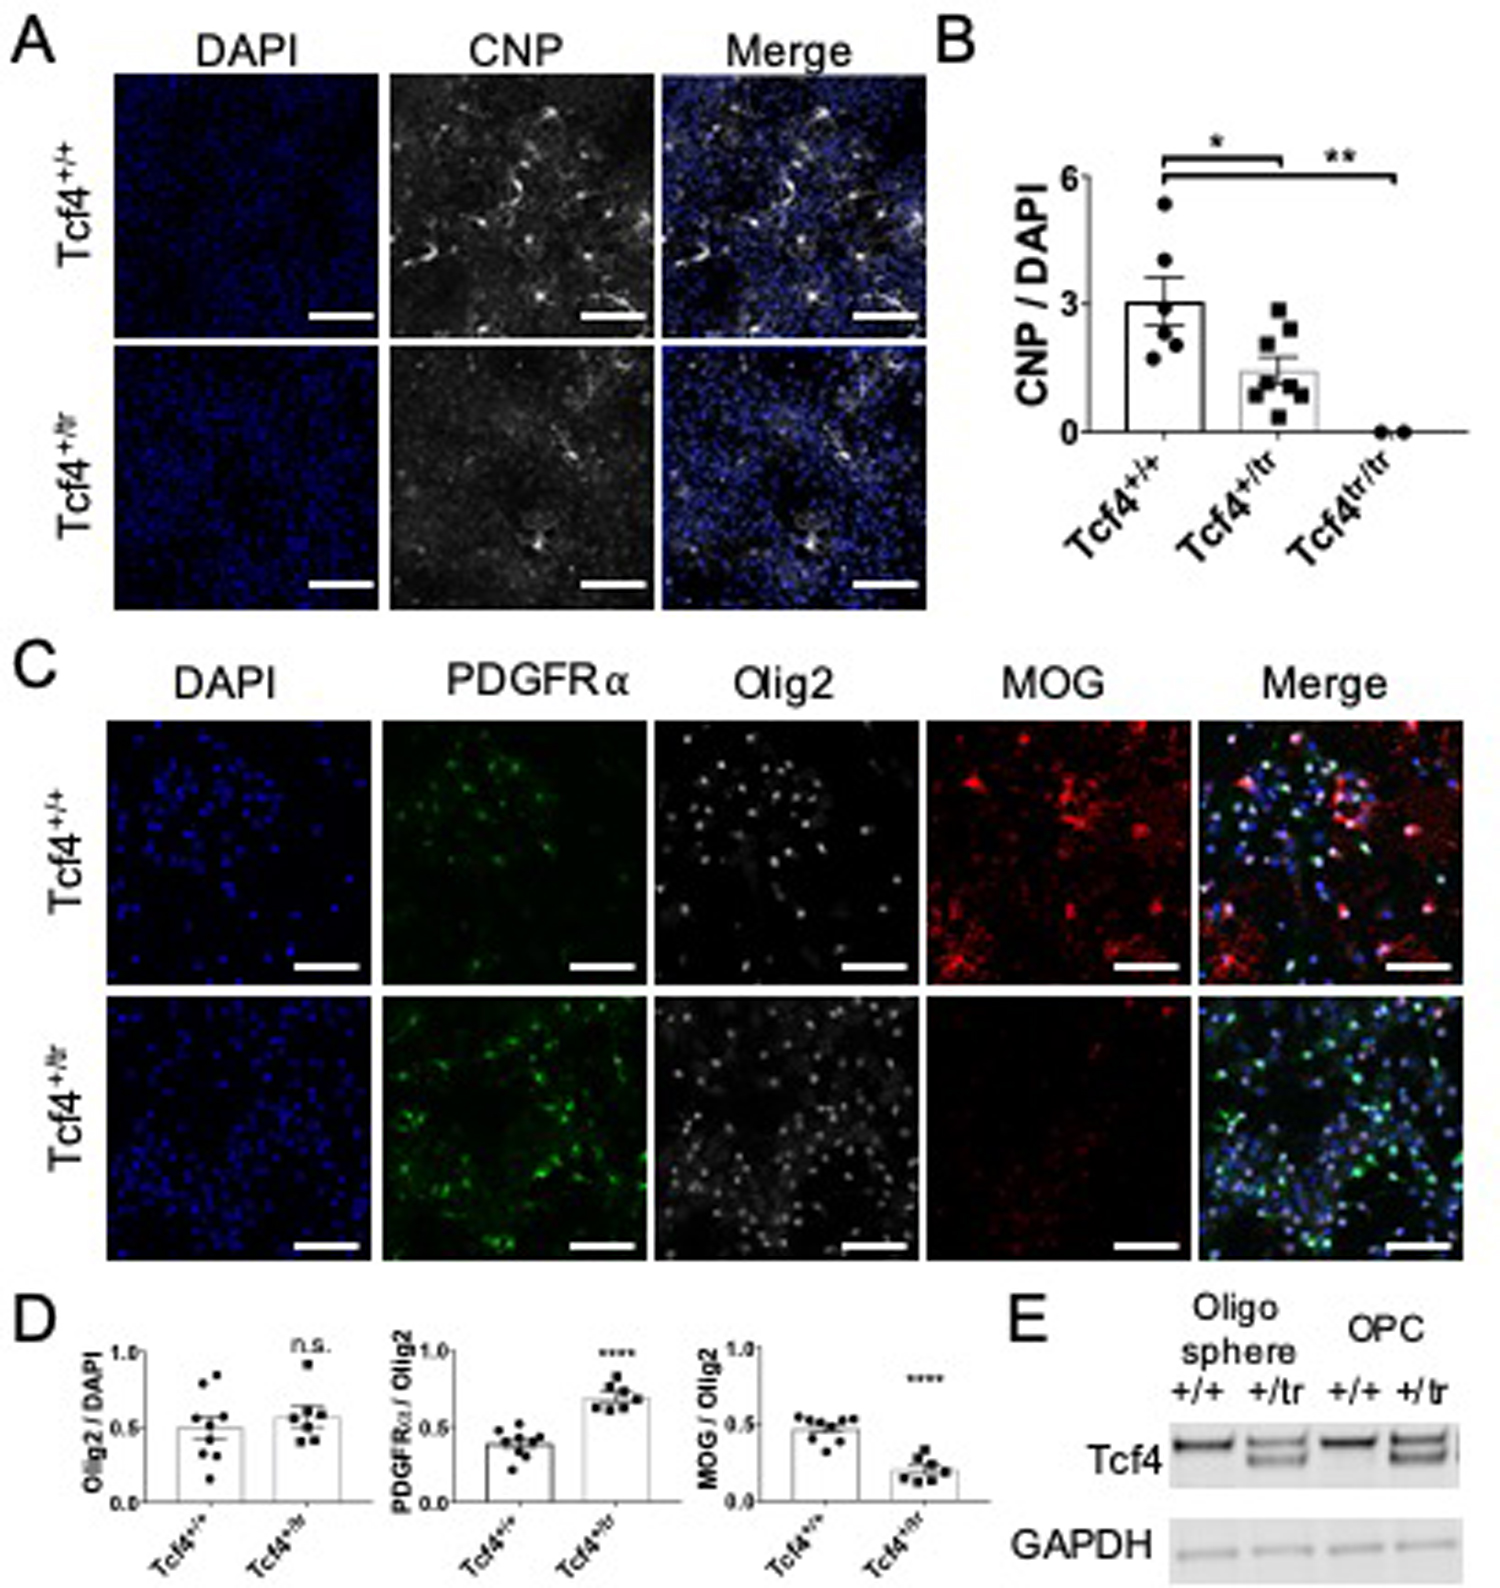
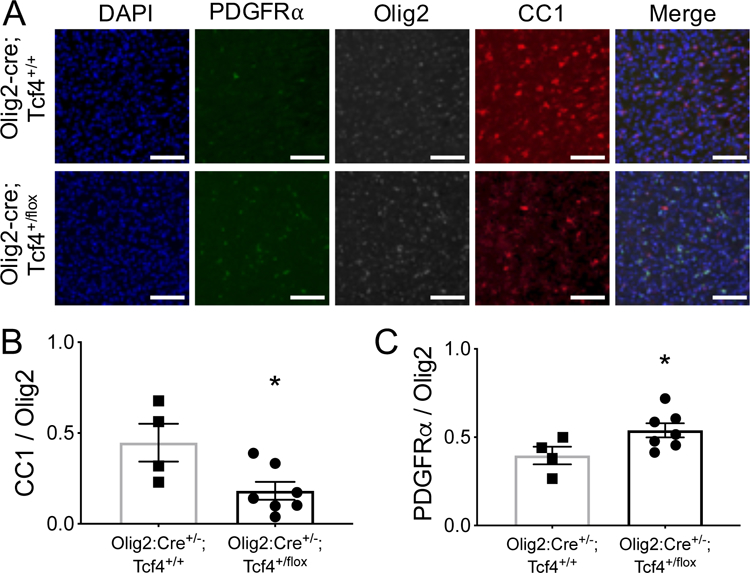
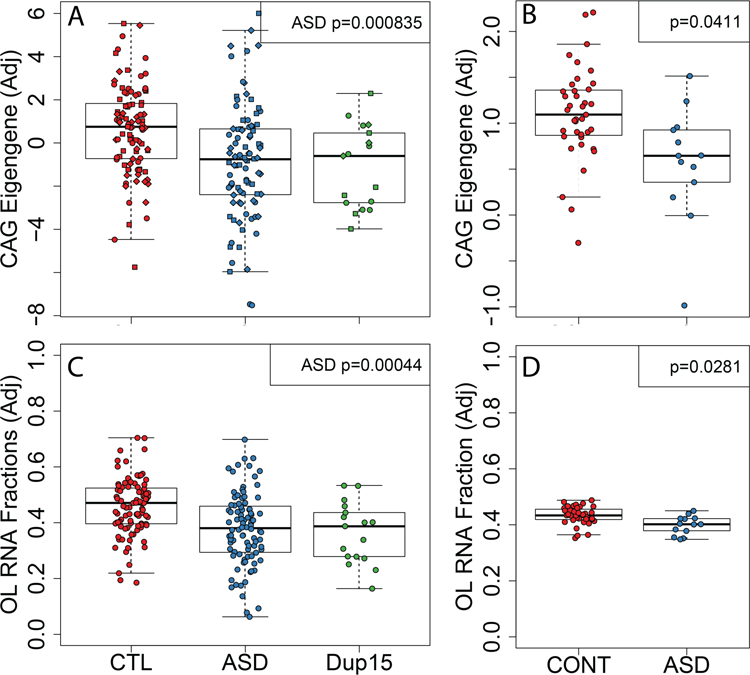
Autism spectrum disorder (ASD) is genetically heterogeneous with convergent symptomatology, suggesting common dysregulated pathways. In this study, we analyzed brain transcriptional changes in five mouse models of Pitt-Hopkins syndrome (PTHS), a syndromic form of ASD caused by mutations in the TCF4 gene, but not the TCF7L2 gene. Analyses of differentially expressed genes (DEGs) highlighted oligodendrocyte (OL) dysregulation, which we confirmed in two additional mouse models of syndromic ASD (Ptenm3m4/m3m4 and Mecp2tm1.1Bird). The PTHS mouse models showed cell-autonomous reductions in OL numbers and myelination, functionally confirming OL transcriptional signatures. We also integrated PTHS mouse model DEGs with human idiopathic ASD postmortem brain RNA-sequencing data and found significant enrichment of overlapping DEGs and common myelination-associated pathways. Notably, DEGs from syndromic ASD mouse models and reduced deconvoluted OL numbers distinguished human idiopathic ASD cases from controls across three postmortem brain data sets. These results implicate disruptions in OL biology as a cellular mechanism in ASD pathology.


Conflict of interest statement

Competing Interest Statement

The authors declare that they have no competing financial interests.

Figures

Extended Data Fig. 1
Extended Data Fig. 1. Heterozygous truncation of Tcf4 decreases levels of Tcf4 mRNA and protein.
Comparison of lifespan expression patterns of TCF4 in heterozygous (Tcf4+/tr) mice and wild-type (Tcf4+/+) littermates in qRT-PCR and RNA-sequencing analyses. mRNA and protein were extracted from frontal cortex of mice across developmental ages. (A) qRT-PCR analysis of full-length Tcf4 transcripts from mouse frontal cortex. Tcf4+/tr mice show overall reduced expression compared to Tcf4+/+ mice (n=66 mice, ANOVA p=0.02) with the greatest decrease inTcf4 expression around postnatal days 1–4 (P1–4, n=18 mice, Posthoc p<0.05). Center values represent mean and errors bars are S.E.M. (B) RNA-seq analysis also shows TCF4 expression decreased in the Tcf4+/tr mouse in the exon after the truncation (n=35 mice). Tcf4+/tr mice had significant decrease of Tcf4 exons (differentially expressed exon by genotype FDR = 3.35 x 10⁻³⁵). The boxplot shows the quartile breaks of residualized variance stablilized count of a Tcf4 exon after the truncation (see methods on residualization for visual interpretation). (C) Western blot of endogenous mouse TCF4 at three ages (E12, P1, and P42). A single full-length (TCF4 fl; 80kDa) protein is observed in lysates from Tcf4+/+mouse brain and Tcf4+/tr mouse brain expresses a truncated (TCF4 tr) and full-length TCF4 protein. These representative gel images are compiled across several different gel images and stitched together. (D) Full-length TCF4 protein is decreased in the Tcf4+/tr mouse brain (n=3 mice per genotype per timepoint, pAnova =0.0009) with the largest effect occuring at P1 in the TCF4+/tr mice (n= 3 mice per condition, two-sided unpaired t-test, p<0.01). Center values indicate mean and errors bars are the S.E.M., *<0.05, **<0.01, ***< 0.001.
Extended Data Fig. 2
Extended Data Fig. 2. Replicated differential expression across PTHS models.
(A) Table of DEGs (NP1 = 28, NAdult = 69, using the two-sided differential expression cutoff of FDR<0.05) and percent of differential expression replication across different forms of Tcf4 mutation P1 and adult mice. Most DEGs and replication occur in adult mice. The replication rate was defined as the proportion/percentage of DE genes that were p < 0.01 in at least one other mouse model of the same age group divided by those DEGs in the reference mouse model. (B) Differential expression log2 fold-change heatmap comparing replicated DEGs across various models of Tcf4 mutations in P1 (replication defined the same gene having differential expression with two-sided p<0.05).
Extended Data Fig. 3
Extended Data Fig. 3. Cell type-specific expression analysis in PTHS mice.
Bulls-eye plots from CSEA analysis of DEGs in (A) P1 and (B) adult Tcf4+/tr mice. The bulls-eye plot size is scaled to the number of genes specific to a cell type at increasing levels of specificity as published by Xu et al., 2014. The FDR-adjusted hypergeometric test p-value is plot for each level of specificity, with unenriched groups colored gray. Cell type bulls-eye plots are arranged by hierarchical distance of their specific gene expression levels. (A) P1 DEGs (N = 36 DEG at Padj < 0.05) enriched for D1+, D2+, and cholinergic neurons (Padj<0.05). (B) Adult DEGs (N = 1832 DEG at Padj < 0.05) strongly enrich for OLs among other neuronal cell types.
Extended Data Fig. 4
Extended Data Fig. 4. Analysis of TEM images.
(A) Plot of gRatio and corresponding radius for all axons assessed. Axon radius is significantly correlated with gRatio (p=2.86e-34), and this correlation is different by genotype (p=0.03). (B-F) No significant differences were observed between genotypes for gRatio (p=0.796), axon area (p=0.844), myelin area (p=0.852), myelin + axon radius (p=0.615), or axon radius (p=0.873).
Extended Data Fig. 5
Extended Data Fig. 5. Conduction velocity does not differ between TCF4 genotypes.
The peak time of N1 and N2 waveform (y-axis) is the amount of time between stimulation artifact and the amplitude peak of the compound action potential. The peak time is plotted against distance (x-axis) which is the distance between the stimulating electrode and recording electrode. The slope of the line generated from both N1(A) and N2 (B) does not differ between genotypes (N1 slope p=0.96, N2 slope p=0.36, N=30 slices from 4 Tcf4+/+ and 5 Tcf4+/tr mice) Center values indicate mean and errors bars are the S.E.M.
Extended Data Fig. 6
Extended Data Fig. 6. Tcf4 is abundantly expressed at all stages of oligodendrocyte development.
(A) Example images of fluorescent in situ hybridization showing Tcf4 transcript co-localizes with both Pdgfrα and Mbp. (B) Summary plots of single-cell RNA-seq data across oligodendrocyte development showing expression levels for Pdgfrα, Tcf4, Olig2, and Mbp. This data was adapted from Marques et al., 2016.
Extended Data Fig. 7
Extended Data Fig. 7. Primary OL cultures are devoid of neurons and astrocytes.
(A) Primary neuronal culture stained with CNP and GFAP as a positive control for antibody staining. (B1) Primary OL culture stained with CNP and GFAP. (B2) Cell counts showing primary OL cultures have very few neurons (Tuj1+) or astrocytes (GFAP+). Numbers indicate number of cells counted for that condition. (C) Primary neuronal cultures stained with OLIG2, NeuN, and GFAP as a positive control for antibody staining. (D) Primary OL culture stained with OLIG2, NeuN, and GFAP. (D1) Cell counts showing primary OL cultures have very few neurons (NeuN+) or astrocytes (GFAP+).
Extended Data Fig. 8
Extended Data Fig. 8. OPCs derived from Tcf4+/tr mice show inefficient maturation into oligodendrocytes.
(A) Representative images of OPCs (PDGFRα) and mature OLs (MBP, CNP) derived from Tcf4+/+ and Tcf4+/tr mice. To control for cell numbers all cell counts are normalized by the pan-OL marker Olig2 that labels both OPC and mature OLs. Tcf4+/tr produce significantly more OPCs (n=23 mice, two-tailed unpaired t-test, p<0.0001) and fewer MBP positive OLs (Tcf4+/+ 0.19±0.02 vs. Tcf4+/tr 0.05±0.01, n=23 mice, two-tailed unpaired t-test, p<0.0001). (B) Representative images of OPCs (PDGFRα) and mature OLs (CNP). Tcf4+/tr produce significantly more OPCs (two-tailed unpaired t-test, n=17 mice, two-tailed unpaired t-test, p<0.0001) and fewer CNP positive OLs (Tcf4+/+ 0.56±0.04 vs. Tcf4+/tr 0.22±0.02, n=17 mice, two-tailed unpaired t-test, p<0.0001). All scale bars equal 100µm. For all bar graphs, center values represent the mean and error bars are S.E.M.,***p<0.001, ****p<0.0001.
Extended Data Fig. 9
Extended Data Fig. 9. Concordant gene regulation between PTHS mice and human ASD.
Comparison of differential expression in adult PTHS mice with human ASD and 15q duplication (15q Dup) in postmortem frontal, temporal, and cerebellum. (NTemp =68, NFrontal = 73, NVermis =63, Human two-sided differential expression p<0.05, mouse DEGs, FDR<0.01). (A) Log2 fold-change comparison of adult PTHS mouse DEGs replicated in human ASD and 15q Dup in each tissue region (p<0.05). Gene regulation in PTHS mice cluster closest with ASD differential expression in cortex. (B) More than 50% of replicated PTHS DEGs had concordant fold-change directionality. Null permutation for empirical p-value significance of human-mouse gene fold-change concordance from 1000 permutations are reported (Two-sided Fisher’s exact test, *, padj<0.05; **, padj<0.01; *** padj<0.001). (C) Replicated DEGs in ASD and 15q Dup are significantly enriched in all tissues, mostly in the cortex (FDR-adjusted Fisher Exact test for overlap of Tcf4 mouse DEG with ASD DEG, padj<0.05). (D) Venn diagram showing overlap of PTHS mouse DEGs with human ASD or 15q Dup in cortical tissues. (E) Gene ontology analysis shows tissue-specific biological processes and cellular components between overlap of PTHS mouse and human ASD or 15q Dup (NASD = 10896 and N15qDup = 13149 DEGs at p < 0.01,s q-adjusted two-sided hypergeometric test). The gene sets are largely brain region specific and concordant between human ASD and 15q Dup. The color of the dot plots shows the q-adjusted hypergeometric test p-value for gene set enrichment of the DEG of each diagnosis group.
Extended Data Fig. 10
Extended Data Fig. 10. Mouse concordant ASD genes (CAGs) are not convergent with Schizophrenia or Down Syndrome.
(A) The eigengene of the CAGs found across the three models of syndromic ASD explains 65.8% of the gene expression variance and is not associated with Schizophrenia diagnosis (linear regression two-sided p-value=0.538). (B) The eigengene of the CAGs found across the three models of syndromic ASD explains 53.2% of the gene expression variance and is not associated with Down Syndrome diagnosis (linear regression two-sided p-value=0.34). (C)Estimated cellular composition differences between patients with schizophrenia and controls using reference-based deconvolution. There were significant increases of astrocytes (p=0.0002) and endothelial cells (p=0.0118) and decreases in microglia (p=0.0076) in patients with schizophrenia compared to controls using linear regression analysis.
Figure 1:
Figure 1:. RNA-seq of multiple Tcf4 mutations reveal age-specific differential gene expression.
(A) Summary table of the 5 mouse lines of Tcf4 mutation sequenced in this analysis. Samples come from 3 regions, medial prefrontal cortex, hemibrain, and hippocampal CA1 (colored red, black, and teal, respectively). Two age groups, P0–2 (P1) and >P42 (adult), were assessed in this study. N’s of wild-type and PTHS mice are colored black and red, respectively. (B) General sample-to-analysis RNA-seq pipeline. (C) Venn diagram of DEGs in P1 and adult mice by Tcf4+/mut genotype across all mouse lines and tissue regions (FDR<0.05). There are 36 DEGs in P1 group, and 1832 DEGs in adult group. A significant group of 17 genes are differentially expressed in both P1 and adult age groups (Fisher’s exact test, p=2.153 e-10). (D) Log2 fold-change heatmap of DEGs from the mega-analysis shows high concordance of differential expression across other mouse lines (replication defined as the same gene also differentially expressed in another model with two-sided p<0.05). (E) Dot plot of gene ontology (GO) enrichment analysis of DEGs split by up- or down-regulated genes to determine functional pathways affected in PTHS mice brain (q-adjusted two-sided hypergeometric test, padj < 0.05). Gene ratio dot size represent % of genes for each GO term differentially expressed.
Figure 2:
Figure 2:. Oligodendrocyte-specific deficits in PTHS model mice.
(A) Heatmap plotting the ratio of cell type-specific genes that are DEGs. Differential expression in all adult mouse lines were highly specific to myelinating OL signature genes (n=21,196–25,848 expressed genes in within an age/mouse line, FDR-adjusted two-sided Fisher’s exact test for gene set enrichment, padj<0.05). New OLs, their precursors, neurons, and astrocytes are enriched in DEGs across all Tcf4 mutant mouse models, but most present in the adult brain (padj<0.05). (B) CIBERSORT cell proportions analysis of PTHS mice stratified by sample tissue source. New OL proportions are down in P1 brains, neuron proportions are up in adult brain, and myelinating OL proportions are down in adult brain (two-sided linear regression of related proportions for Tcf4 effect, NP1= 28, New OL p = 0.023; NAdult = 69, Neuron p= 0.035, Myelinating OL p = 0.00155). Boxplot display the quartiles and median of cell type proportions. (Abbreviations: R579W = Tcf4+/R579W; D574–579 = Tcf4+/D574−579; Nest-Cre = Nestin-Cre::Tcf4+/floxed; Actin-Cre = Actin-Cre::Tcf4+/floxed; mPFC-tr = Tcf4+/tr medial prefrontal cortex; CA1-tr = Tcf4+/tr hippocampal CA1 neurons; FPKM = fragments per kilobase per million reads mapped, * Padj <0.05, ** Padj <0.01, *** Padj < 0.001)
Figure 3:
Figure 3:. Shared myelination gene regulation between mouse models of syndromic ASD.
(A) Venn diagram of DEGs in each mouse model of ASD (FDR < 0.05). There is significant overlap of DEGs from Tcf4 mutation vs. Mecp2 or Pten homozygous mutation (Two-sided Fisher’s Exact test, p=2.2e-16). (B-C) Log2 fold-change comparison of the genes differentially expressed both in Tcf4 heterozygous mutation and Mecp2 knockout or Pten homozygous mutation, respectively. DEG fold-change directionality in TCF4 mutant mice is inversely correlated (ρ < 0) to that in MeCP2 and Pten mutation suggesting TCF4 plays an opposite role in regulating these genes. 34 genes differentially expressed in all three mutations, referred to as the convergent ASD genes (CAG) are plot with black outlines. (B) The 586 DEGs in the Tcf4 vs. Pten comparison had 91% opposite fold-change directions and displayed strong negative correlation (Spearman correlation p=2.2e-16, ρ = −0.71). (C) The 64 overlapping DEGs in the Tcf4 vs. Mecp2 group had 72% opposite fold-change directions with significant negative correlation (Spearman correlation p=0.0023, ρ = −0.38). (D) Top GO terms of the CAGs enrich for myelination processes (q-value adjusted hypergeometric test Padj=0.0149). (ρ, Spearman’s correlation coefficient, κ, concordance rate).
Figure 4:
Figure 4:. Validation of myelination defects due to Tcf4 mutation.
(A) Western blot for myelinating OL proteins, CNP and MOG, and an OL precursor cell protein, NG2, normalized to GAPDH in mPFC-Tcf4+/tr. (B) Relative protein levels of MOG and CNP are significantly decreased in Tcf4+/tr brain (two-sided unpaired t-test, n=12 mice, pMOG=0.0008, pCNP=0.0436). Relative levels of NG2 do not differ between genotypes (two-sided unpaired t-test, n=12 mice, p=0.815). (C) Representative immunostaining for the mature OL marker CC1 and pan-OL marker Olig2 in the cortex of p24 Tcf4+/+ and Tcf4+/tr mice. (D) The proportion of Olig2-positive cells that are CC1-positive is significantly reduced in p24 Tcf4+/tr mice (Tcf4+/tr 0.69±0.05 vs. Tcf4+/+ 0.50±0.01, two-sided unpaired t-test, n=10 mice, p=0.0016) and adult Tcf4+/tr mice (Tcf4+/tr 0.61±0.04 vs. Tcf4+/+ 0.81±0.03, two-sided unpaired t-test, n=8 mice, p=0.0055). (E) Representative immunostaining for the OPC marker PDGFRɑ and pan-OL marker Olig2 in the cortex of p24 Tcf4+/+ and Tcf4+/tr mice. (F) The proportion of Olig2-positive cells that are PDGFRɑ-positive is significantly increased in p24 Tcf4+/tr mice (Tcf4+/tr 0.58±0.04 vs. Tcf4+/+ 0.42±0.05, two-sided unpaired t-test, n=10 mice, p=0.0495) and adult Tcf4+/tr mice (Tcf4+/tr 0.52±0.03 vs. Tcf4+/+, two-sided unpaired t-test 0.26±0.02, n=8 mice, p=0.0002). All scale bars equal 100µm. Center values represent the mean and error bars are S.E.M., *p<0.05, **p<0.01.
Figure 5:
Figure 5:. The proportion of myelinated axons in the corpus callosum is reduced in TCF4 mutant mice
(A) Representative electron micrographs of the CC from Tcf4+/+ and Tcf4+/tr mice. TEM images were quantified from 4 Tcf4+/+ and 5 Tcf4+/tr mice. (B) The proportion of axons myelinated across images was significantly reduced in Tcf4+/tr mice (logistic mixed effects model, OR=0.65, n=9 mice, p=0.046). The size of circles is proportional to the number of axons per image and the colors indicate the animal each slice was obtained from. (C) Representative electrophysiology traces of evoked compound action potentials recorded in the CC from Tcf4+/+ and Tcf4+/tr mice. N1 represents action potentials traveling down myelinated axons and N2 represents action potentials traveling down unmyelinated axons. (D) The proportion of action potentials traveling down myelinated axons was consistently reduced in Tcf4+/tr mice compared to Tcf4+/+ mice (n=30 brain slices from 4 Tcf4+/+ and 5 Tcf4+/tr mice, ANOVA p=0.0012). Center values represent the mean and error bars are S.E.M., *p<0.05, **p<0.01, ***p<0.001.
Figure 6.
Figure 6.. In vitro biological validation of myelination defects due to Tcf4 mutation.
(A) Representative images of CNP-positive OLs in primary neuronal cultures derived from Tcf4+/+ and Tcf4+/tr mice. (B) The proportion of CNP-positive cells in significantly reduced in cultures derived from Tcf4+/tr mice (Tcf4+/+ 3.07%±0.57% vs. Tcf4+/tr 1.46%±0.31%, n=16 mice, ANOVA p=0.0074, Posthoc p=0.031). Tcf4tr/tr mice failed to produce any CNP-positive OLs. (C) Representative images of OPCs (PDGFRα) and mature OLs (MBP) derived from Tcf4+/+ and Tcf4+/tr mice. To control for cell numbers all cell counts are normalized by the pan-OL marker Olig2 that labels both OPC and mature OLs. (D) Cultures derived from Tcf4+/tr mice produce significantly more OPCs (Tcf4+/+ 0.39±0.03, n=9 vs. Tcf4+/tr 0.69±0.03, two-sided unpaired t-test, n=16 mice; p<0.0001) and fewer MOG-positive OLs (Tcf4+/+ 0.47±0.03, n=9 vs. Tcf4+/tr 0.21±0.03, two-sided unpaired t-test, n=16 mice; p<0.0001). (E) Example Western blot showing TCF4 protein is expressed in these OL cultures (repeated from independent cultures derived from 3 Tcf4+/+ and 4 Tcf4+/tr mice). All scale bars equal 100µm. For all bar graphs, center values represent the mean and error bars are S.E.M.; *p<0.05, **p<0.01, ***p<0.001, ****p<0.0001.
Figure 7:
Figure 7:. TCF4 regulation of oligodendrocytes is cell autonomous.
(A) Representative immunostaining for the OPC marker PDGFRα, mature OL marker CC1 and pan-OL marker Olig2 in the cortex of p24 Olig2-Cre; Tcf4+/+ and Olig2-Cre; Tcf4+/flox mice. (B) The proportion of Olig2-positive cells that are CC1-positive is significantly reduced in Olig2-cre; Tcf4+/flox mice compared to Olig2-Cre+/−;Tcf4+/+ cultures (Olig2-Cre+/−;Tcf4+/flox 0.19±0.05 vs. Olig2-Cre+/−;Tcf4+/+ 0.45±0.10, n=11 mice, one-tailed unpaired t-test p=0.015). (C) The proportion of Olig2-positive cells that are PDGFRα-positive significantly increased in Olig2-cre; Tcf4+/flox mice (Olig2-Cre+/−;Tcf4+/flox 0.52±0.04 vs. Olig2-Cre+/−;Tcf4+/+ 0.40±0.05, one-tailed unpaired t-test, n=11 mice, p=0.028). All scale bars equal 100µm. For all bar graphs, center values represent the mean and error bars are S.E.M.,*p<0.05.
Figure 8:
Figure 8:. Human-mouse convergence of gene expression in idiopathic and syndromic ASD.
(A) The eigengene of the CAGs found across the three models of syndromic ASD in Parikshak et al is significantly associated with ASD but not 15q duplication diagnoses (via linear mixed effects modeling). (B). The CAG eigengene is also different between patients with ASD from controls in Wright et al. as replication (linear regression for ASD p=0.0411). Estimated cellular composition differences between patients with ASD and controls using reference-based deconvolution show decreased OL RNA fractions in (C) Parikshak et al (linear mixed effects regression for ASD p=0.0004) and (D) Wright et al (linear regression for ASD p=0.0281). The y-axis in each panel are residualized values when accounting for observed and latent confounders for improved visual interpretation (see Methods).

References

    1. Iossifov I et al. The contribution of de novo coding mutations to autism spectrum disorder. Nature 515, 216–221 (2014). - PMC - PubMed
    1. O’Roak BJ et al. Multiplex targeted sequencing identifies recurrently mutated genes in autism spectrum disorders. Science 338, 1619–1622 (2012). - PMC - PubMed
    1. Gaugler T et al. Most genetic risk for autism resides with common variation. Nat. Genet 46, 881–885 (2014). - PMC - PubMed
    1. Silverman JL, Yang M, Lord C & Crawley JN Behavioural phenotyping assays for mouse models of autism. Nat. Rev. Neurosci 11, 490–502 (2010). - PMC - PubMed
    1. Sweatt JD Pitt-Hopkins Syndrome: intellectual disability due to loss of TCF4-regulated gene transcription. Exp Mol Med 45, e21 (2013). - PMC - PubMed

Publication types

MeSH terms

Supplementary concepts