. 2020 Mar;17(3):311-318.
doi: 10.1038/s41592-019-0726-y. Epub 2020 Feb 3.

An optimized chemical-genetic method for cell-specific metabolic labeling of RNA

Affiliations

An optimized chemical-genetic method for cell-specific metabolic labeling of RNA

Sarah Nainar et al. Nat Methods. 2020 Mar.

Abstract

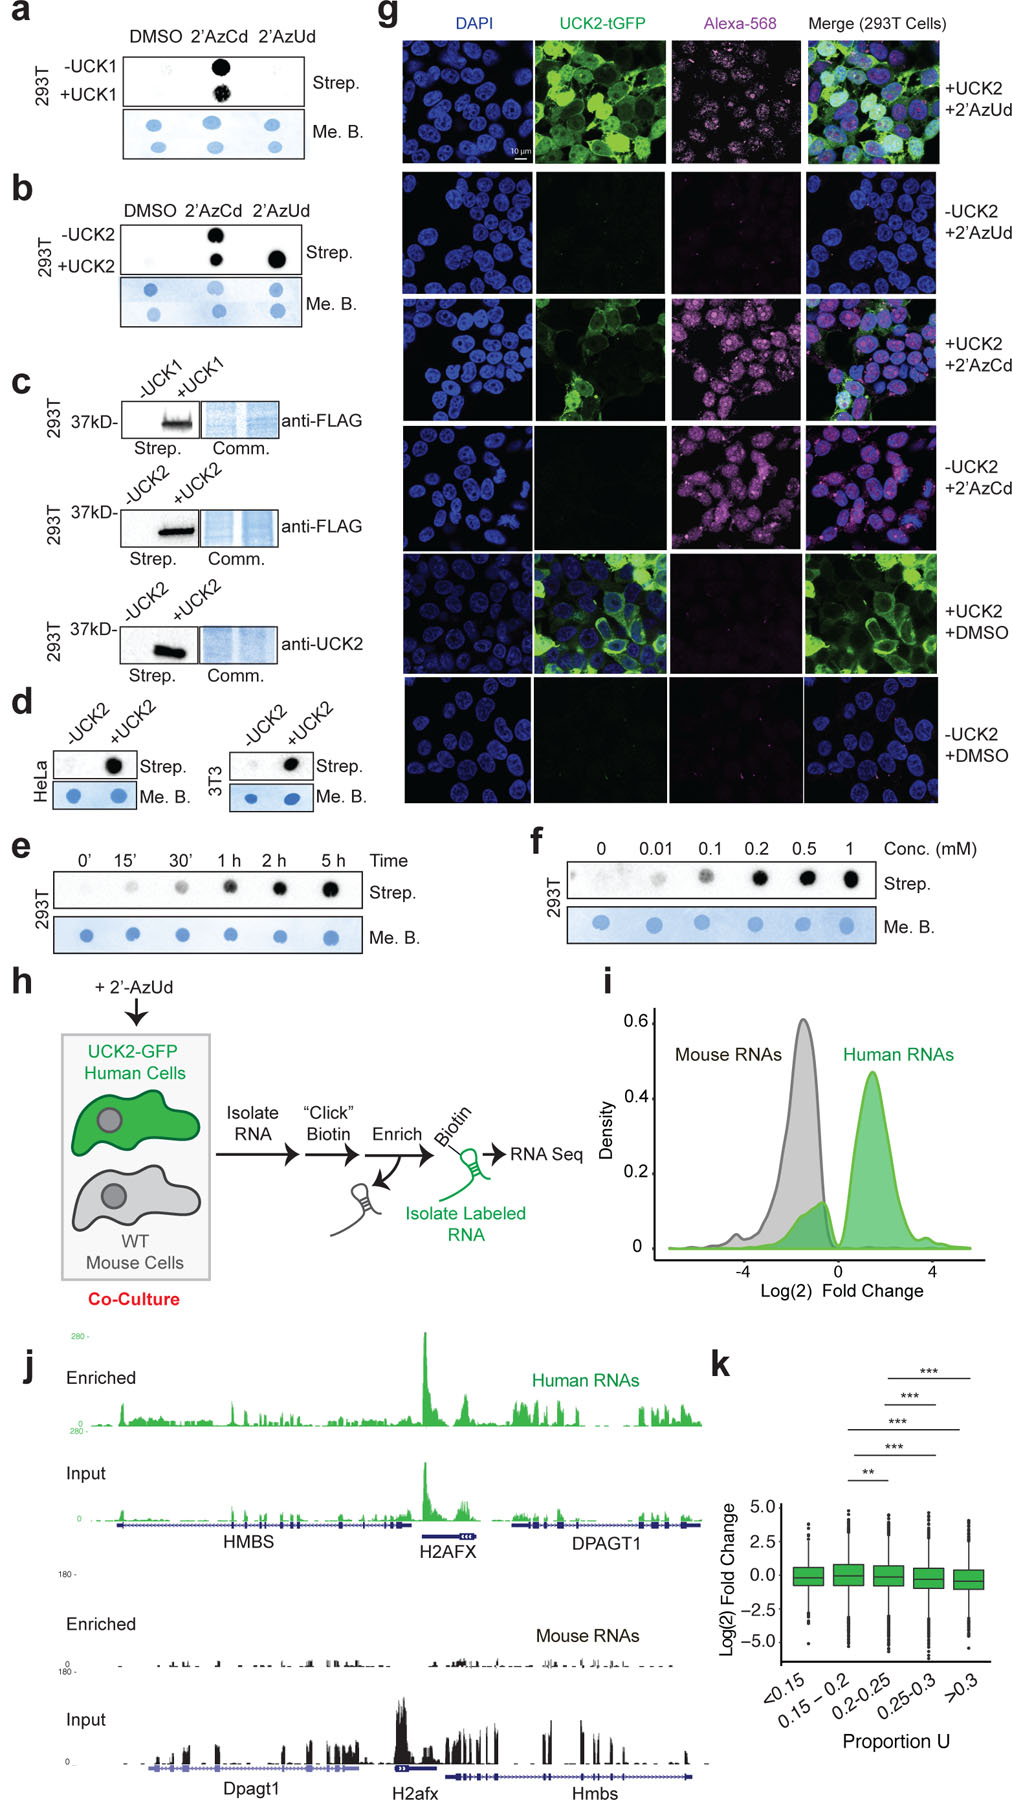
Tissues and organs are composed of diverse cell types, which poses a major challenge for cell-type-specific profiling of gene expression. Current metabolic labeling methods rely on exogenous pyrimidine analogs that are only incorporated into RNA in cells expressing an exogenous enzyme. This approach assumes that off-target cells cannot incorporate these analogs. We disprove this assumption and identify and characterize the enzymatic pathways responsible for high background incorporation. We demonstrate that mammalian cells can incorporate uracil analogs and characterize the enzymatic pathways responsible for high background incorporation. To overcome these limitations, we developed a new small molecule-enzyme pair consisting of uridine/cytidine kinase 2 and 2'-azidouridine. We demonstrate that 2'-azidouridine is only incorporated in cells expressing uridine/cytidine kinase 2 and characterize selectivity mechanisms using molecular dynamics and X-ray crystallography. Furthermore, this pair can be used to purify and track RNA from specific cellular populations, making it ideal for high-resolution cell-specific RNA labeling. Overall, these results reveal new aspects of mammalian salvage pathways and serve as a new benchmark for designing, characterizing and evaluating methodologies for cell-specific labeling of biomolecules.


Figures

Figure 1:
Figure 1:. Schematic of cell-specific metabolic labeling of RNA.
For cell-specific metabolic labeling of RNA, an “inert intermediate” (nucleobase or nucleoside), which cannot be processed by wildtype cells, is introduced. Only cells ectopically expressing an enzyme, which can convert an “inert intermediate” to an “active intermediate,” can yield metabolic labeling of RNA. H = chemical handle for functionalization.
Figure 2:
Figure 2:. Mammalian cells are capable of salvaging exogenous uracil analogs for eventual incorporation into cellular RNA.
a. Schematic of screening experiments for assaying exogenous uracil analog incorporation into cellular RNA. b. Structure of 5-ethynyluracil (for screening; 5EU) and 5-ethynyluridine (analog that is incorporated by wildtype cells; 5EUd) c. Time course dot-blot results. Cells were cultured with 5EU for 5 h at indicated concentrations. Total RNA was isolated and biotinylated via azide-alkyne click chemistry and analyzed by streptavidin-HRP dot blot. Strep. = streptavidin-HRP. Me.B. = methylene blue. PCN = primary cortical neurons. d. Known enzymatic pathways that could result in salvage of uracil or uracil analogs for subsequent RNA metabolic labeling. e. RNA sequencing results from mouse and human body map tissue analysis demonstrate that both UPRT and UMPS are highly expressed in a variety of tissues. f. Dot blot demonstrating that in the presence of overexpressed HsUMPS-FLAG construct, there is a strong increase of 5EU incorporation into HEK293T cellular RNA. Hs = homo sapiens. This was independently repeated three times, with similar results. g. Dot blot demonstrating that in the presence of overexpressed HsUPRT-FLAG construct, there is a modest increase in incorporation of 5EU into HEK293T cellular RNA. This was independently repeated three times, with similar results. h. Bar chart showing the mean integrated chemiluminescence signal of overexpression dot blots, normalized to the WT signal. Analysis was performed from a sample size (n) of 3 independent experiments each for HsUPRT and HsUMPS, with ** p = 0.0015 and ** p = 0.0086 (95% CI), respectively, as determined by a two-tailed Student’s t-test. Error bars represent standard deviation. i. Dot blot demonstrating a reduction in 5EU signal when treated with siRNA against endogenous HsUMPS. This was independently repeated four times, with similar results. j. Dot blot demonstrating no change in 5EU signal when treated with siRNA against endogenous HsUPRT. This was independently repeated four times, with similar results. k. Bar chart showing the mean integrated chemiluminescence signal of siRNA knockdown dot blots, normalized to the scramble (middle) signal. Analysis was performed from a sample size (n) of 4 independent experiments each for HsUPRT and HsUMPS, with ns p = 0.8891 and **** p = 1.61E-08 (95% CI), as determined by a two-tailed Student’s t-test. Error bars represent standard deviation.
Figure 3:
Figure 3:. Cellular screening reveals a UCK2/2’AzUd pair amenable for metabolic labeling of RNA.
a. Schematic of pyrimidine salvage pathway through uridine-cytidine kinase and eventual RNA biosynthesis. b. Structure of 5mAzUd. c. Structure of 2’AzUd. d. Crystal structure of the UCK2•cytidine complex (PDB: 1UEJ) with residues selected for mutation to accommodate 5mAzUd highlighted in red (Y65, F83, Y112, F114). C5-position is highlighted in green. e. Crystal structure of the UCK2•cytidine complex with residues selected for mutation to accommodate 2’AzUd highlighted in red (R166, Q184, Y185, V189). 2’-position is highlighted in green. f. Dot blot results from in-cell screening of UCK2 mutants with 5mAzUd. HEK293T cells WT or mutant UCK2-TurboGFP were treated with 1 mM analog for 5 h. RNA was isolated and biotinylated using azide-alkyne click chemistry, followed by streptavidin-HRP dot blot detection of biotinylated RNA. (−) is the negative control with no UCK2-TurboGFP transfection. (+) is the positive control with 5-ethynyluridine incubation, followed by click chemistry with azide biotin. This was independently repeated twice, with similar results. g. Dot blot results from screening UCK2 mutants with 2’AzUd (as in 2f). This was independently repeated twice, with similar results. h. Representative HEK293T cell imaging highlighting changes to cell morphology, and potential toxicity of 5mAzUd-treated cells (1 mM) expressing WT or UCK2 mutants (top). i. Trypan blue assay of HEK293T cell permeability demonstrates that 5mAzUd has an overall greater effect on cell viability than 2’AzUd, relative to DMSO controls. WT or stable-expression UCK2 cells were treated with 1 mM analog for indicated times. These results are from two independent cell culture experiments. j. Alamar blue assay demonstrates changes to HEK293T cell proliferation in 5mAzUd-treated WT or UCK2-stable expression cells. Percent proliferation was normalized to DMSO control-treated cells (0.5% final) for each respective time point. Data represents independent biological replicates (cell-culture replicates) and error bars represent standard deviation.
Figure 4:
Figure 4:. Structural analysis of the UCK2/2’AzUd pair reveals the mechanism for selectivity.
a. Overlay of simulated 2’AzUd in the canonical binding mode (2’AzUdcanc) and cytidine from PDB: 1UEJ. The ribose oxygen is oriented away from the active site in both the predicted MD conformation and 1UEJ. b. Overlay of simulated 2’AzUd in the flipped binding mode (2’AzUdflip) and cytidine from PDB: 1UEJ. The ribose of 2’AzUdflip in the active site is oriented opposite to that of the canonical binding mode (denoted with a dashed arrow). c. Electron density of 2’AzUd in the pre-catalytic states in subunits D, E and F. Each of the orientations for 2’AzUd are from the same view as in a. and b. d. Electron density of 2’AzUMP in the post-catalytic state, where the substrate is flipped (facing down and out of the active site) in an orientation opposite that of the pre-catalytic structures. e. Superimposition of 2’AzUMP, 2’AzUd and apo-UCK2 structures demonstrating conformational changes in the lid domain and opposing loop containing key residues in the pre- and post-catalytic states. f. Overlay of 2’AzUdflip MD and pre-catalytic 2’AzUd structure. g. Overlay of 2’AzUdcanc MD and post-catalytic 2AzUMP structure.
Figure 5:
Figure 5:. Demonstration of cell-specific metabolic labeling with UCK2/2’AzUd pair.
a. Dot blot demonstrating no incorporation of 2’AzUd in the presence of UCK1-FLAG overexpression. This experiment was independently repeated twice, with similar results. b. Dot blot demonstrating incorporation of 2’AzUd only in the presence of UCK2-FLAG overexpression. This experiment was independently repeated twice, with similar results. c. Western blots detecting overexpression of UCK1-FLAG and UCK2-FLAG constructs. Overexpression was confirmed with anti-FLAG or additionally UCK2 was also detected via anti-UCK2. d. Additional mammalian cells not expressing UCK2 are unable to introduce 2’AzUd into their RNA unless UCK2 is overexpressed. Both HeLa and NIH3T3 experiments were independently repeated twice, with similar results. e. Time course analysis of 2’AzUd incorporation into cellular RNA from cells expressing UCK2-FLAG and treated with 1 mM analog. This experiment was independently repeated twice, with similar results. f. Concentration titration of 2’AzUd incorporation into cellular RNA in cells expressing UCK2-FLAG after 5 h. This experiment was independently repeated twice, with similar results. g. Cellular imaging demonstrates 2’AzUd is exclusively incorporated into RNA of cells expressing UCK2-TurboGFP (green). HEK293T cells transfected with UCK2-TurboGFP (or mock) were incubated with 1 mM 2’AzUd for 5 h. Cells were fixed, permeabilized and clicked with Alexa-568 alkyne followed by imaging of labeled RNA (red). This experiment was repeated twice, with similar results. h. Schematic of co-culture experiment used to test specificity of labeling. i. Distribution plot of RNAs enriched and depleted from the co-culture experiment. j. Genome browser track of human and mouse loci demonstrating enrichment of human RNAs and depletion of mouse RNAs. k. Plot of U-richness in enriched RNAs. Significant comparisons are denoted with a horizontal bar. The sample size is n=3 with ** p = <0.01 and *** p = <0.001, as determined by Type II ANOVA and Tukey’s test.

Similar articles

Cited by

References

References (Main Text)

    1. Jung J & Jung H. Methods to analyze cell type-specific gene expression profiles from heterogeneous cell populations. Anim Cells Syst 20, 113–117, doi:10.1080/19768354.2016.1191544 (2016). - DOI
    1. Feng H, Zhang X & Zhang C. mRIN for direct assessment of genome-wide and gene-specific mRNA integrity from large-scale RNA-sequencing data. Nat Commun 6, 7816, doi:10.1038/ncomms8816 (2015). - DOI - PMC - PubMed
    1. Handley A, Schauer T, Ladurner AG & Margulies CE Designing Cell-Type-Specific Genome-wide Experiments. Mol. Cell 58, 621–631, doi:10.1016/j.molcel.2015.04.024 (2015). - DOI - PubMed
    1. Riley KJ, Yario TA & Steitz JA Association of Argonaute proteins and microRNAs can occur after cell lysis. Rna 18, 1581–1585, doi:10.1261/rna.034934.112 (2012). - DOI - PMC - PubMed
    1. Mili S & Steitz JA Evidence for reassociation of RNA-binding proteins after cell lysis: implications for the interpretation of immunoprecipitation analyses. Rna 10, 1692–1694, doi:10.1261/rna.7151404 (2004). - DOI - PMC - PubMed

References (Methods)

    1. Zajaczkowski EL et al. Bio-orthogonal Metabolic Labeling of Nascent RNA in Neurons Improves the Sensitivity of Transcriptome-Wide Profiling. ACS Chem. Neurosci 9, 1858–1865, doi:10.1021/acschemneuro.8b00197 (2018). - DOI - PMC - PubMed
    1. Nguyen K et al. Cell-Selective Bio-orthogonal Metabolic Labeling of RNA. J. Am. Chem. Soc 139, 2148–2151, doi:10.1021/jacs.6b11401 (2017). - DOI - PubMed
    1. Ratnadiwakara M & Änkö M-L mRNA Stability Assay Using Transcription Inhibition by Actinomycin D in Mouse Pluripotent Stem Cells. Bio-protocol 8, e3072, doi:10.21769/BioProtoc.3072 (2018). - DOI - PMC - PubMed
    1. Tomoike F et al. Indispensable residue for uridine binding in the uridine-cytidine kinase family. Biochem. Biophys. Rep 11, 93–98, doi:10.1016/j.bbrep.2017.07.002 (2017). - DOI - PMC - PubMed
    1. Agarwal KC, Miech RP & Parks RE in Methods Enzymol. Vol. 51 483–490 (Academic Press, 1978). - PubMed

Publication types

MeSH terms