. 2020 Apr;38(4):448-459.
doi: 10.1038/s41587-019-0398-2. Epub 2020 Feb 3.

Interleukin-23 engineering improves CAR T cell function in solid tumors

Affiliations

Interleukin-23 engineering improves CAR T cell function in solid tumors

Xingcong Ma et al. Nat Biotechnol. 2020 Apr.

Abstract

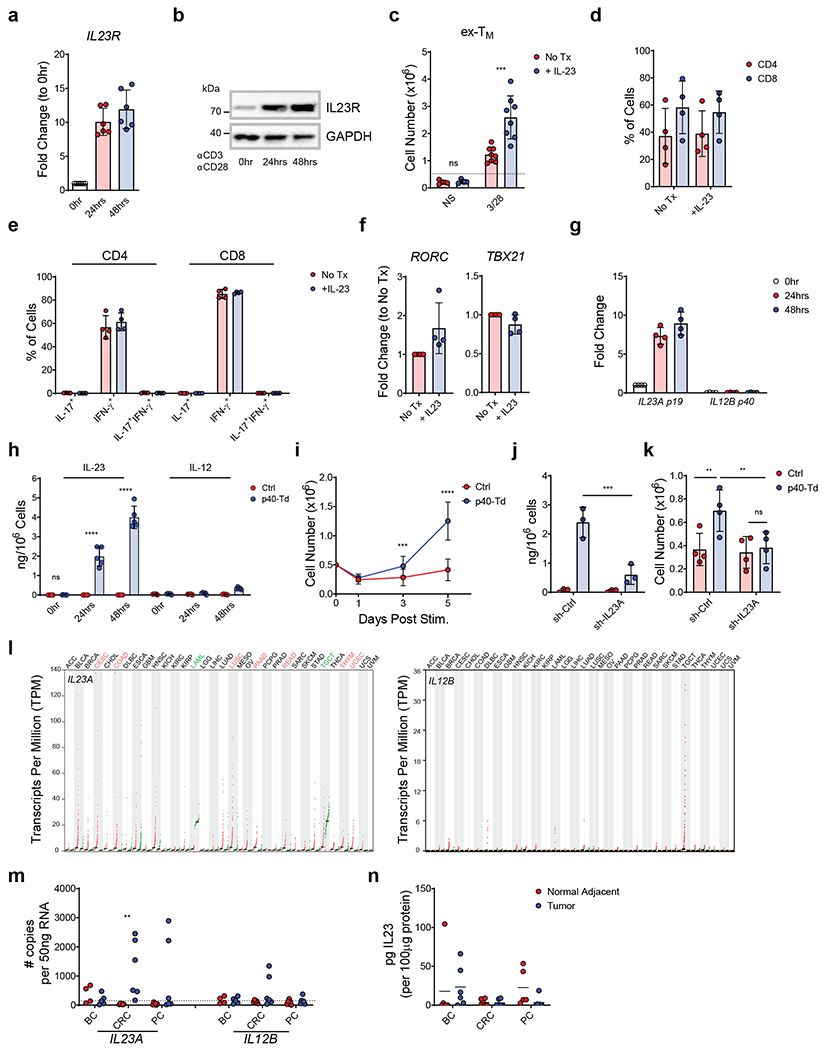
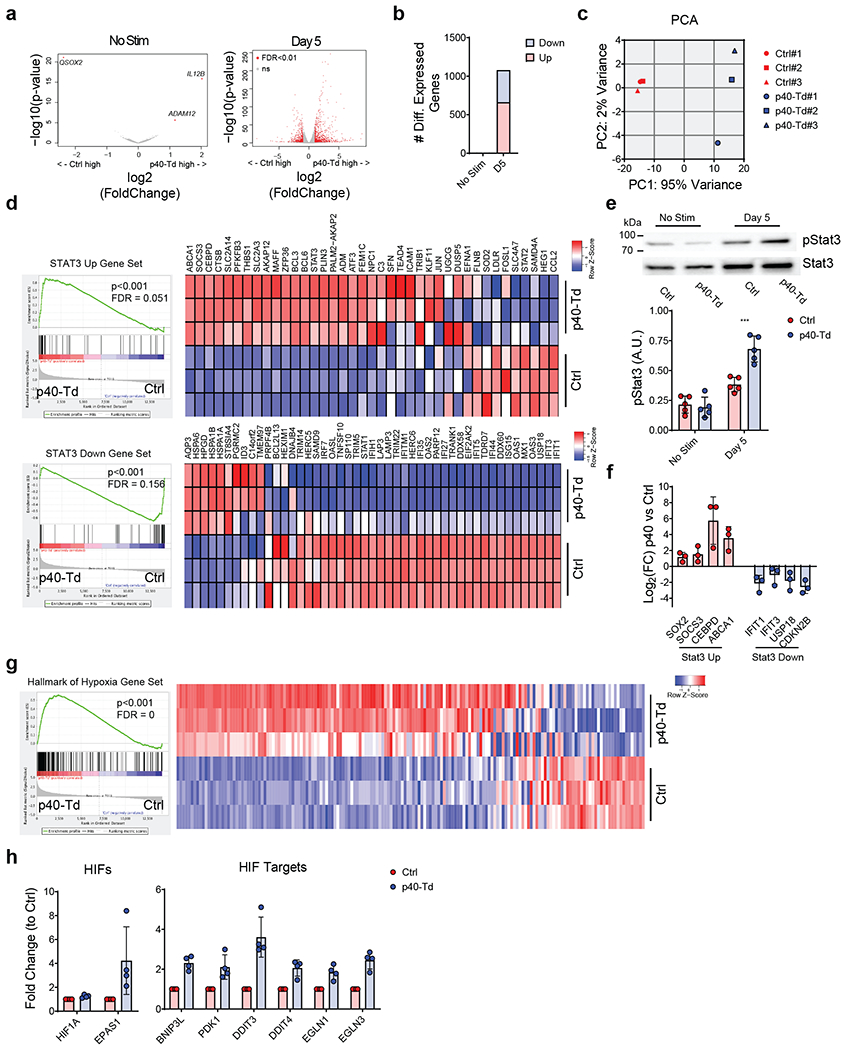
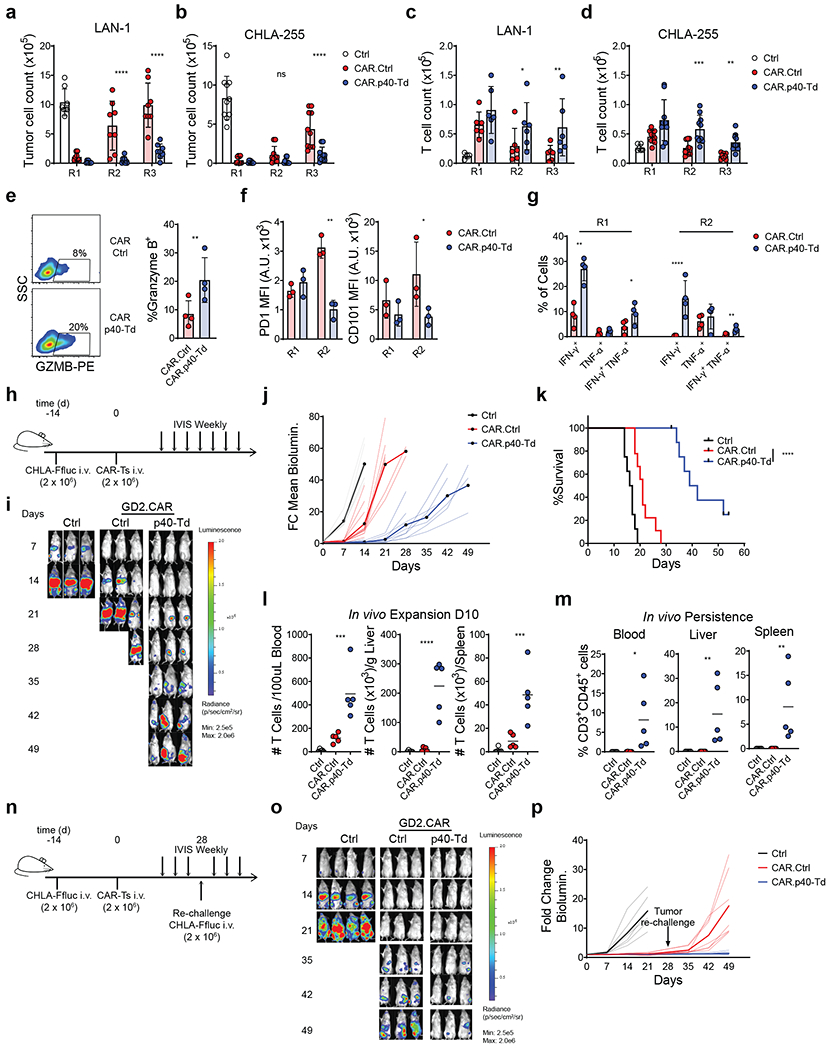
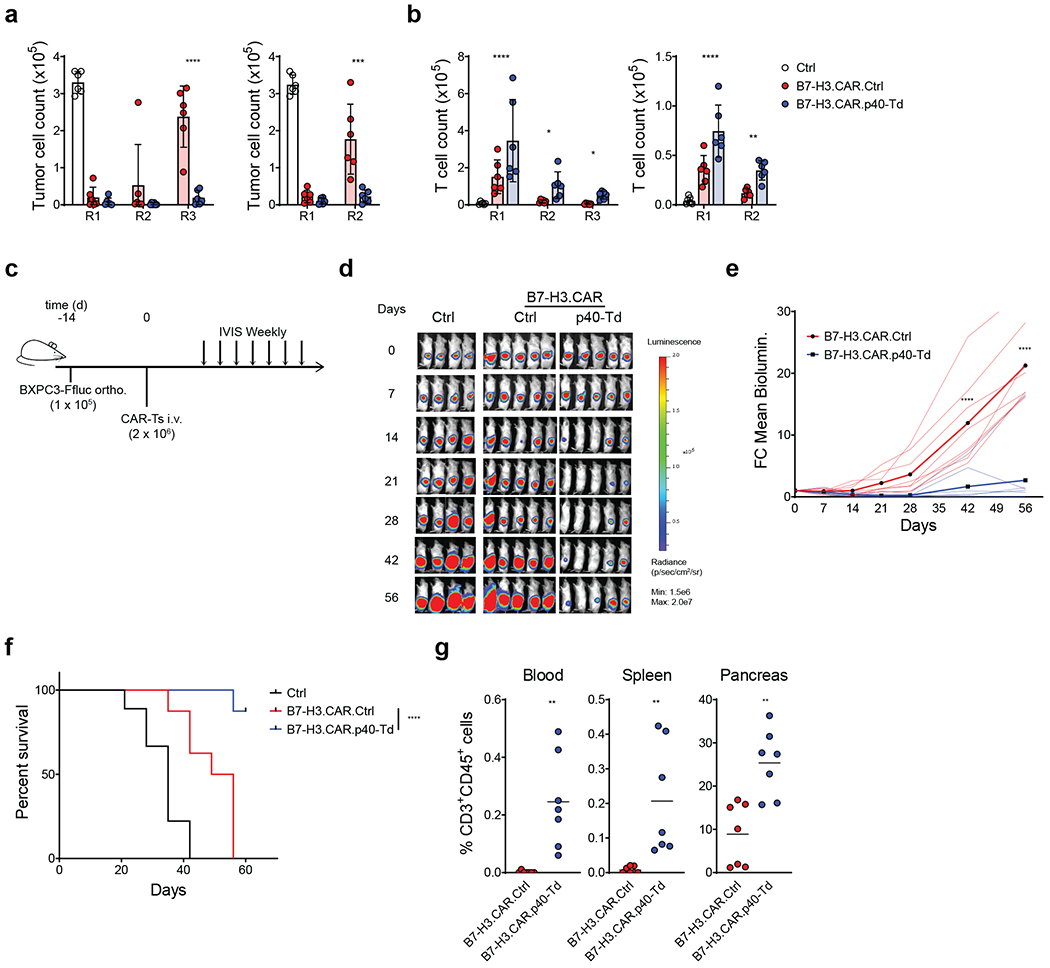
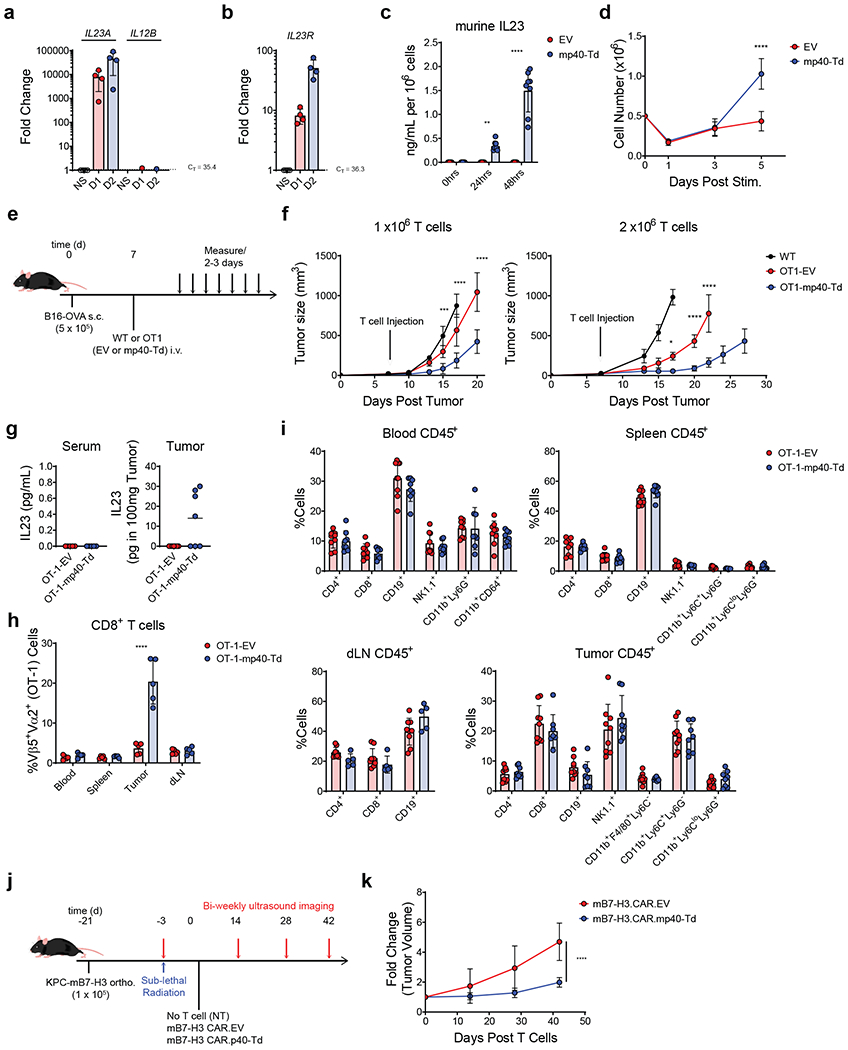
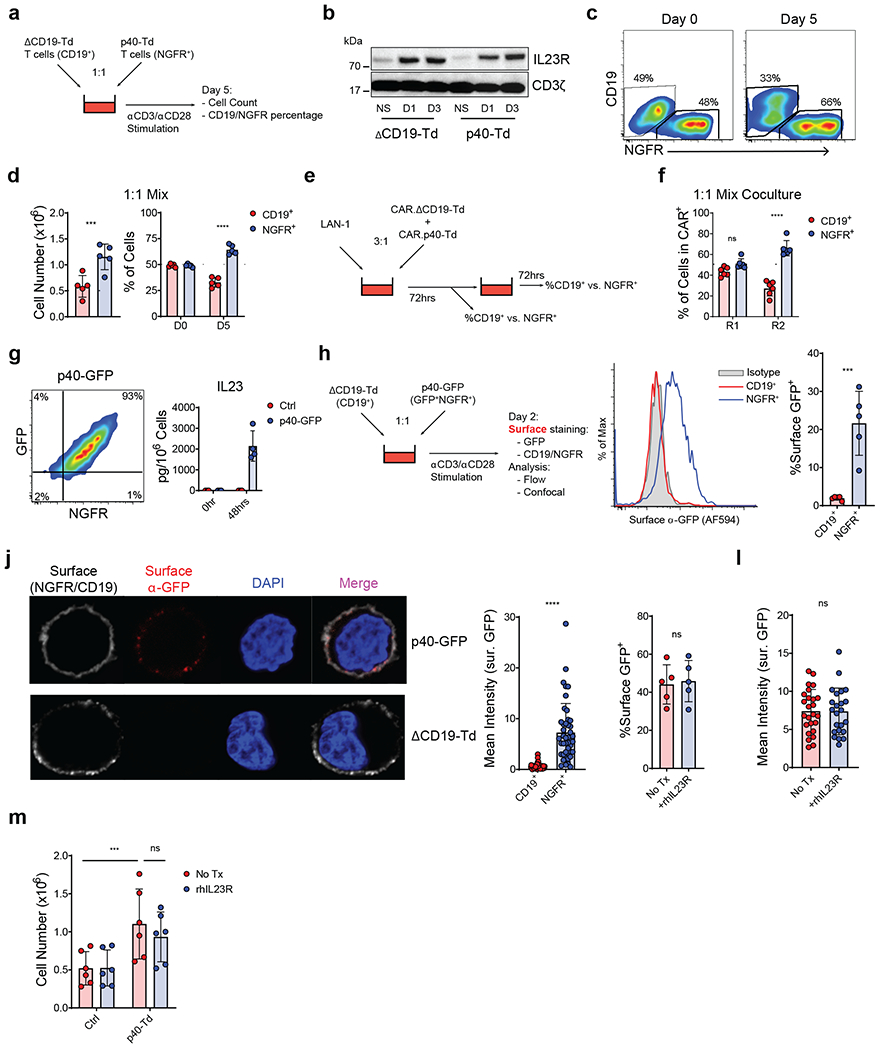
Cytokines that stimulate T cell proliferation, such as interleukin (IL)-15, have been explored as a means of boosting the antitumor activity of chimeric antigen receptor (CAR) T cells. However, constitutive cytokine signaling in T cells and activation of bystander cells may cause toxicity. IL-23 is a two-subunit cytokine known to promote proliferation of memory T cells and T helper type 17 cells. We found that, upon T cell antigen receptor (TCR) stimulation, T cells upregulated the IL-23 receptor and the IL-23α p19 subunit, but not the p40 subunit. We engineered expression of the p40 subunit in T cells (p40-Td cells) and obtained selective proliferative activity in activated T cells via autocrine IL-23 signaling. In comparison to CAR T cells, p40-Td CAR T cells showed improved antitumor capacity in vitro, with increased granzyme B and decreased PD-1 expression. In two xenograft and two syngeneic solid tumor mouse models, p40-Td CAR T cells showed superior efficacy in comparison to CAR T cells and attenuated side effects in comparison to CAR T cells expressing IL-18 or IL-15.


Figures

Figure 1.
Figure 1.. IL23 supports the expansion of T cells in an activation-inducible dependent manner.
(a,b) IL23R expression at mRNA (a) and protein level (b) measured by qRT-PCR and western blot, respectively in human T cells activated and expanded ex vivo (ex-TM) at time 0, 24, 48 hours after TCR activation. Data are represented as fold change in expression normalized to the housekeeping gene 18S and to the expression at time 0. Data shown are individual values and mean ± SD (n = 6 in (a) and n = 5 in (b)). (c) Expansion of ex-TM cells with or without activation with αCD3 and αCD28 Abs and with or without rIL23 (50 ng/mL). Cell numbers were numerated by flow cytometry at day 7. Data shown are individual values and mean ± SD (n = 4), ***p=0.0002 determined by repeated measured 2-way ANOVA with Sidak post hoc test. (d) Distribution of CD4+ and CD8+ T cells in ex-TM cells activated with αCD3 and αCD28 Abs in the presence or absence of 50 ng/mL rIL23 at day 7. Data shown as mean ± SD (n = 4). (e) Intracellular detection of IFN-γ and IL-17 in CD4+ and CD8+ T cells in ex-TM cells activated with αCD3 and αCD28 Abs in the presence or absence of 50 ng/mL rIL23 for 7 days. Data shown as or individual values, mean ± SD (n = 4). (f) Relative expression of the Th17 and Th1 transcription factor RORγT and Tbet, respectively assessed by qRT-PCR in ex-TM cells activated with αCD3 and αCD28 Abs in the presence or absence of 50 ng/mL rIL23 for 7 days. Data shown as individual values, mean ± SD (n = 4). (g) mRNA expression of the IL23 subunits p19 (IL23A) and p40 (IL12B) in ex-TM cells activated with αCD3 and αCD28 Abs at time 0, 24, 48 hours as determined by qRT-PCR. Data are expressed as fold change in expression normalized to the housekeeping gene 18S and to the expression at time 0. Data shown as individuals and mean ± SD (n = 4). (h) Detection of IL23 secreted by Ctrl cells or p40-Td cells activated with αCD3 and αCD28 Abs for 0, 24 and 48 hours as measured by ELISA. Data shown as individuals and mean ± SD (n = 5). ****p<0.0001 determined by repeated measured 2-way ANOVA with Sidak post hoc test. (i) Numeric expansion of Ctrl cells and p40-Td cells activated with αCD3 and αCD28 Abs. Data shown as mean ± SD (n = 13). ***p=0.0006, ****p<0.0001 determined by repeated measured 2-way ANOVA with Sidak post hoc test. (j) Detection of IL23 secreted by activated Ctrl cells and p40-Td cells co-transduced with either the vector encoding control shRNA (sh-Ctrl cells) or IL23A-shRNA (sh-IL23A). Data shown as individual values and mean ± SD (n = 3). ***p=0.0002 determined by repeated measured 2-way ANOVA with Sidak post hoc test. (k) Cell counts at day 5 of sh-Ctrl cells or sh-IL23A cells activated with αCD3 and αCD28 Abs. Data shown as individual values and mean ± SD (n = 4). **p=0.0069 for Ctrl cells:sh-Ctrl cells vs. p40-Td cells:sh-Ctrl cells and **p=0.0056 for p40:sh-Ctrl cells vs. p40-Td cells:sh-IL23A cells, determined by repeated measured 2-way ANOVA with Sidak post hoc test. (I) Expression (transcript per million) of IL23A (left) and IL12B (right) mRNA in the tumor (red dots) and adjacent normal tissues (green dots) from different cancer patients plotted using TCGA data. Tumor types highlighted in red indicate higher expression in tumor tissues vs. normal tissues, while those highlighted in green indicate lower expression. (m) Expression of IL23A and IL12B genes determined by qRT-PCR in breast cancer (BC), colon rectal cancer (CRC) and pancreatic cancer (PC) and paired adjacent normal tissues. Data are shown as copies of RNA per 50 ng RNA (n = 6). Dotted line indicates the detection limit of the qRT-PCR assay used (CT > 35). **p=0.0019 was determined by 1-way ANOVA with Sidak post hoc test. (n) Detection of IL23 by ELISA in the supernatant of single cell suspension of paired tumors and adjacent normal tissues. Data are shown as pg of IL23 per 100 μg supernatant protein input, individual values and mean ± SD (n = 6).
Figure 2.
Figure 2.. T cell receptor activation induces STAT3 and hypoxia gene signature in p40-Td cells.
(a) Volcano plot of gene expression before (left) and 5 days after activation (right) with αCD3 and αCD28 Abs of Ctrl cells and p40-Td cells (n = 3). Volcano plot was constructed using log2fold change and −log10(FDR) of all genes. Red dots represent genes with more than 2-fold change (up or down) and FDR<0.01. (b) Number of differentially expressed genes before and after stimulation of Ctrl cells and p40-Td cells. (c) Principal component analysis (PCA) of activated Ctrl cells and p40-Td cells (n = 3). (d) GSEA for the expression profiles of the activated Ctrl cells as compared to activated p40-Td cells using “STAT3 upregulated” (up) and “STAT3 downregulated” (down) gene sets and the expression heatmap of genes in the gene sets (n = 3). The nominal p values and FDR q values were calculated by GSEA software (Broad Institute). (e) Representative western blot showing Ser727 and Tyr705 phosphorylation of STAT3 in Ctrl cells and p40-Td cells before and 5 days after stimulation with αCD3 and αCD28 Abs (upper panel). Densitometry of pSTAT3 (lower panel), mean ± SD (n = 5). ***p=0.0001 determined by repeated measured 2-way ANOVA with Sidak post hoc test. (f) qRT-PCR quantification of upregulated (red) or downregulated (down) genes STAT3 pathway related. Data were first normalized to housekeeping gene 18S and the mean ± SD log2fold change of gene expression of activated Ctrl cells vs. p40-Td cells (n = 4) were shown. (g) GSEA for the expression profiles of activated Ctrl cells and p40-Td cells using “hallmark of hypoxia” gene set (left panel) and expression heatmap of genes in the gene sets (right panel) (n = 3). The nominal p values and FDR q values were calculated by GSEA software (Broad Institute). (h) qRT-PCR quantification of hypoxia pathway related genes in activated Ctrl cells and p40-Td cells. Data were first normalized to housekeeping gene 18S and then to the expression level to Ctrl cells. Data shown as individual values and mean ± SD (n = 4).
Figure 3.
Figure 3.. p40 expression enhances the anti-tumor activity of CAR T cells in a neuroblastoma model.
(a-b) Counts of neuroblastoma tumor cells (LAN-1 and CHLA-255) after each round of repetitive coculture (R1, R2 and R3) with either control T cells (Ctrl.), GD2-specific CAR T cells (CAR.Ctrl) or GD2-specific CAR T cells coexpressing p40 (CAR.p40-Td). Data shown as individual values and mean ± SD (n = 8). ****p<0.0001 determined by repeated measure 2-way ANOVA with Sidak post hoc test. (c-d) T cell counts after each round of repetitive coculture illustrated in (a-b). Data shown as individual values and mean ± SD (n = 8). *p=0.03 for LAN1 R2; **p=0.0049 for LAN1 R3; ***p=0.0003 for CHLA-255 R2; **p=0.0091 for CHLA-255 R3 determined by repeated measure 2-way ANOVA with Sidak post hoc test. (e) Intracellular staining of granzyme B of CAR.Ctrl cells and CAR.p40-Td cells at the end of R1. Data shown as individual values and mean ± SD (n = 3). **p=0.0052 determined by two-sided paired t test. (f) Expression of PD1 and CD101 in CAR.Ctrl cells and CAR.p40-Td cells after R1 and R2 of repetitive coculture with LAN-1 tumor cells. Data shown as individual values and mean ± SD (n = 3). **p=0.0014 for PD1 R2; *p=0.0365 for CD101 R2 determined by repeated measure 2-way ANOVA with Sidak post hoc test. (g) Intracellular staining of IFN-γ and TNF-α of CAR.Ctrl cells and CAR.p40-Td cells at the end of R1 and R2 of coculture with LAN1 tumor cells. Data shown as individual values and mean ± SD (n = 3). **p=0.002 for IFN-γ+ cells at R1; *p=0.0409 for IFN-γ+TNF-α+ cells at R1; ****p<0.0001 for IFN-γ+ cells at R2; **p=0.009 for IFN-γ+TNF-α+ cells at R2 determined by repeated measure 2-way ANOVA with Sidak post hoc test. (h) Schematic representation of the metastatic neuroblastoma xenograft model. (i) Representative tumor bioluminescence (BLI) of 2 independent experiments. (j) Kinetics of tumor BLI of 2 independent experiments (n = 8 mice/group for Ctrl group, n = 9 mice/group for CAR.Ctrl and CAR.p40-Td groups). Solid lines delineate mean fold change over time, while dashed lines indicate data of each individual mouse. (k) Kaplan-Meier survival curve summarizing 2 independent experiments (n = 8 mice/group). (l) Frequency of human CD3+CD45+ cells in blood, spleen and liver collected 10 days post T cell infusion. Data shown as individual values, mean ± SD (n = 5 mice/group) and are representative of 2 experiments. ***p=0.0006 for blood; ****p<0.0001 for liver and p=0.0007 for spleen determined by 1-way ANOVA with Sidak post hoc test. (m) Frequency of human CD3+CD45+ cells in blood, spleen and liver collected at the time of mouse euthanasia (median collection time: 18, 22 and 52 for Ctrl, CAR.Ctrl and CAR.p40-Td group, respectively). Data shown as individual values, mean ± SD (n = 5 mice/group) and are representative of 2 experiments. *p=0.0132 for blood; **p<0.0067 for liver and p=0.0071 for spleen determined by 1-way ANOVA with Sidak post hoc test. (n) Schematic representation of the metastatic neuroblastoma xenograft model and tumor rechallenge. (o) Representative tumor BLI of 2 independent experiments. (p) Kinetics of tumor BLI of 2 independent experiments (n = 6 mice/group for Ctrl, n = 7 mice/group for CAR.Ctrl and CAR.p40-Td groups). Solid lines delineate mean fold change over time, while dashed lines indicate data of each individual mouse.
Figure 4.
Figure 4.. p40 expression enhances the anti-tumor activity of CAR T cells in a pancreatic cancer model.
(a) Counts of pancreatic cancer cell (BXPC-3) after each round of repetitive coculture (R1, R2 and R3) with either control T cells (Ctrl.), B7-H3-specific CAR T cells (CAR.Ctrl) or B7-H3-specific CAR T cells coexpressing p40 (CAR.p40-Td) at T cell to tumor cell ratios 1:2 (left panel) or 1:5 (right panel). Data shown as individual values, mean ± SD (n = 6). ***: p=0.0003, ****: p<0.0001 determined by repeated measured 2-way ANOVA with Sidak post hoc test. (b) T cell counts after each round of repetitive coculture illustrated in (a). Data shown as individual values and mean ± SD (n = 6). *: p=0.0195 for R2, p=0.021 for R3, **: p=0.0024, ****: p<0.0001 determined by repeated measured 2-way ANOVA with Sidak post hoc test. (c) Schema of the orthotopic pancreatic cancer model. (d) Representative tumor BLI of 2 independent experiments (n = 8 mice/group). (e) Kinetics of tumor BLI of 2 independent experiments (n = 8 mice/group). Solid lines delineate mean fold change over time, while dashed lines indicate data of each individual mouse. (f) Kaplan-Meier survival analysis of 2 independent experiments (n = 8 mice/group). (g) Frequency of human CD3+CD45+ cells in blood, spleen and pancreas collected from mice at day 60 post T cell infusion. Data shown as individual values and mean (n = 7 mice/group for 2 independent experiments **: p=0.0017 for blood, p=0.00065 for spleen and p=0.0014 for tumor) determined by two-sided unpaired Student t-test.
Figure 5.
Figure 5.. p40 expression enhances the anti-tumor activity of T cells in syngeneic tumor models.
(a-b) Expression of IL23A, IL12B (a) and IL23R (b) genes determined by qRT-PCR in ex vivo activated and expanded murine splenic T cells after re-stimulation with αCD3 and αCD28 Abs for 0, 24 and 48 hours. Data shown as fold change in gene expression normalized to the housekeeping gene CD3E and to the value at time 0. Data shown are individual values and mean ± SD (n = 4). (c) Measurement of murine IL23 released by murine splenic T cells transduced either with the empty vector (EV) or the vector encoding murine IL12B gene (mp40-Td) and re-stimulated with αCD3 and αCD28 Abs for 0, 24 and 48 hours. Data shown are individual values and mean ± SD (n = 8). (d) Cell counts of EV and mp40-Td murine T cells at day 1, 3 and 5 after re-stimulation with αCD3 and αCD28 Abs. Data shown are mean ± SD (n = 3). ****: p<0.0001 determined by repeated measured 2-way ANOVA with Sidak post hoc test. (e) Schematic representation of the syngeneic B16 melanoma model. (f) Measurement of the tumor volume post tumor engraftment. Data shown as mean ± SD of 2 independent experiments. For experiment with 1 × 10⁶ T cells, n = 5 mice/group for WT cells and n = 8 mice/group for OT1-EV cells and OT1-mp40-Td cells. For experiments with 2 × 10⁶ T cells, n = 6 mice/group for WT cells and OT1-EV cells and n = 7 mice/group for OT1-mp40-Td cells. *: p=0.0182; ***: p=0.0007; ****:p<0.0001 determined by 2-way ANOVA with Sidak post hoc test. (g) Detection of murine IL23 in the serum and tumor supernatant collected 14 days after T cell infusion. Data shown as individual values and mean (n = 5 mice/group for serum and n = 7mice/group for tumor). (h) Frequency of OT1 TCR+ (Va2+Vb5+) cells within the CD8+ T cells in the tissues collected from treated mice. Data shown as mean ± SD (n = 5 mice/group). ****p<0.0001 determined by 2-way ANOVA with Sidak post hoc test. (i) Immune composition of the peripheral blood, spleen, draining lymph nodes (dLN) and tumor at the time of euthanasia. Data shown as individual values and mean ± SD of 2 independent experiments (n = 9 mice/group). (j) Schematic representation of the syngeneic PDAC orthotopic model. Murine cell line KPC-4662 engineered to express murine B7-H3 (KPC-mB7-H3) was implanted (0.1 × 10⁶ cells/mouse) into the pancreas of 6 week old C57BL/6 mice. Eighteen days post tumor cell implantation, mice were irradiated with 400 cGy and 3 days later infused i.v. with syngeneic B7-H3.CAR.EV cells (1 × 10⁷ cells/mouse) or B7-H3.CAR.mp40-Td cells (1 × 10⁷ cells/mouse). Tumor growth was monitored by US. (k) Summary of the fold change (compared to day 0) in tumor volume from 2 independent experiments (n = 8 mice/group). ****p <0.0001 determined by 2-way ANOVA with Sidak post hoc test between B7-H3.CAR.EV cells vs B7-H3.CAR.mp40-Td cells at day 42.
Figure 6.
Figure 6.. Engineered IL23 functions predominantly through an autocrine mode of action.
(a) Schematics of the co-activation experiment with p40-Td cells and ΔCD19-Td cells. (b) Representative western blot showing the expression of IL23R in ΔCD19-Td cells and p40-Td cells at days 1 or 3 after activation (n = 3). (c) Representative plot of NGFR+ (p40-Td cells) and CD19+ (bystander cells) at days 0 and 5 post-activation. Data representative of 5 independent experiments. (d) Cell number and percentage of NGFR+ and CD19+ cells 5 days post-activation. Data shown as individual values and mean ± SD (n = 5). Dotted line indicates starting cell number and percentage, respectively. ****p<0.0001 determined by two-sided paired Student t test. (e) Schematics of the sequential coculture of GD2-specific CAR T cells coexpressing either ΔCD19 (CAR.ΔCD19-Td) or p40 (CAR.p40-Td) with the LAN-1 tumor cell line. (f) Percentages of NGFR+ and CD19+ CAR T cells detected at the end of the first (R1) and second (R2) round of coculture. Data shown as individuals and mean ± SD (n = 6). ****: p<0.0001 determined by repeated measured 2-way ANOVA with Sidak post hoc test. (g) Flow plot illustrating the coexpression of NGFR and GFP (left panel) and detection of IL23 in the supernatant (right panel) of T cells transduced with a vector encoding the p40-GFP fusion protein. Data shown as mean ± SD (n = 4). (h) Schematics and staining procedure of the co-activation experiment with p40-GFP cells and ΔCD19-Td cells. (i) Representative flow histograms showing the surface binding of the p40-GFP protein on CD19+ or NGFR+ T cells. Individual values and mean ± SD (n = 5). ***p=0.0003 determined by two-sided paired Student t test. (j) Representative confocal microscopy imaging (left panel) showing the surface binding of p40-GFP protein in CD19+ or NGFR+ cells, representative of 5 independent experiments and quantification (right panels) of fluorescence intensity of the surface GFP signal for CD19+ or NGFR+ cells. Data shown as individual values and mean ± SD (n = 49 cells for CD19+ cells and n = 44 for NGFR+ cells). ****p<0.0001 determined by two-sided paired Student t test. (k,l) Surface binding of p40-GFP in p40-GFP-Td cells in the absence or presence of the soluble recombinant human IL23R (hIL23R) determined by flow cytometry (k) and confocal microscopy (l). Data are presented as individual values and mean ± SD (n = 5 independent experiments for (k) with 25 and 23 analyzed cells for No Tx and +rhIL23R group, respectively, in (l)). (m) T cell numbers of Ctrl cells or p40-Td cells at day 5 post-activation with αCD3 and αCD28 Abs in the absence or in the presence of soluble rhIL23R. Data are presented as individual values and mean ± SD (n = 6). ***p=0.0006 determined by repeated measure 2-way ANOVA with Sidak post hoc test.

References

    1. Garber K Driving T-cell immunotherapy to solid tumors. Nat Biotechnol 36, 215–219 (2018). - PubMed
    1. D’Angelo SP, et al. Antitumor Activity Associated with Prolonged Persistence of Adoptively Transferred NY-ESO-1 (c259)T Cells in Synovial Sarcoma. Cancer Discov 8, 944–957 (2018). - PMC - PubMed
    1. Porter DL, Levine BL, Kalos M, Bagg A & June CH Chimeric antigen receptor-modified T cells in chronic lymphoid leukemia. N Engl J Med 365, 725–733 (2011). - PMC - PubMed
    1. Maude SL, Teachey DT, Porter DL & Grupp SA CD19-targeted chimeric antigen receptor T-cell therapy for acute lymphoblastic leukemia. Blood 125, 4017–4023 (2015). - PMC - PubMed
    1. Sanmamed MF & Chen L A Paradigm Shift in Cancer Immunotherapy: From Enhancement to Normalization. Cell 175, 313–326 (2018). - PMC - PubMed

Method-Only References

    1. Song L, et al. Oncogene MYCN regulates localization of NKT cells to the site of disease in neuroblastoma. The Journal of clinical investigation 117, 2702–2712 (2007). - PMC - PubMed
    1. Tarek N, et al. Unlicensed NK cells target neuroblastoma following anti-GD2 antibody treatment. The Journal of clinical investigation 122, 3260–3270 (2012). - PMC - PubMed
    1. Caruana I, et al. Heparanase promotes tumor infiltration and antitumor activity of CAR-redirected T lymphocytes. Nat Med 21, 524–529 (2015). - PMC - PubMed
    1. Louis CU, et al. Antitumor activity and long-term fate of chimeric antigen receptor-positive T cells in patients with neuroblastoma. Blood 118, 6050–6056 (2011). - PMC - PubMed
    1. Du HHK; Ahn S; Kren NP; Montgomery SA; Wang XH; Tiruthani K; Mirlekar R; Michaud D; Greene K; Herrera SG; Sun C; Chen YH; Xu Y; Ma XC; Ferrone CR; Pylayeva-Gupta Y; and Yeh JJ; Liu RH; Savoldo B; Ferrone S; Dotti G. Antitumor Responses in the Absence of Toxicity in Solid Tumors by Targeting B7-H3 Via Chimeric Antigen Receptor T Cells Cancer Cell (2018). - PMC - PubMed

Publication types

MeSH terms