. 2020 Feb;27(2):160-167.
doi: 10.1038/s41594-019-0371-2. Epub 2020 Feb 3.

Atomic structures of closed and open influenza B M2 proton channel reveal the conduction mechanism

Affiliations

Atomic structures of closed and open influenza B M2 proton channel reveal the conduction mechanism

Venkata S Mandala et al. Nat Struct Mol Biol. 2020 Feb.

Abstract

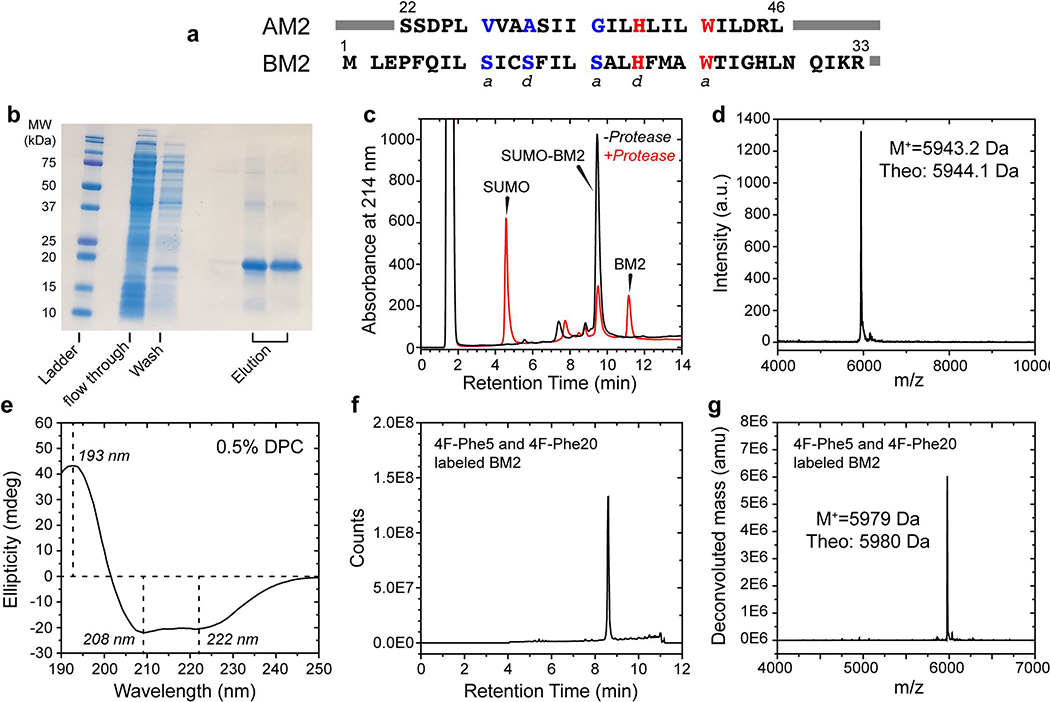
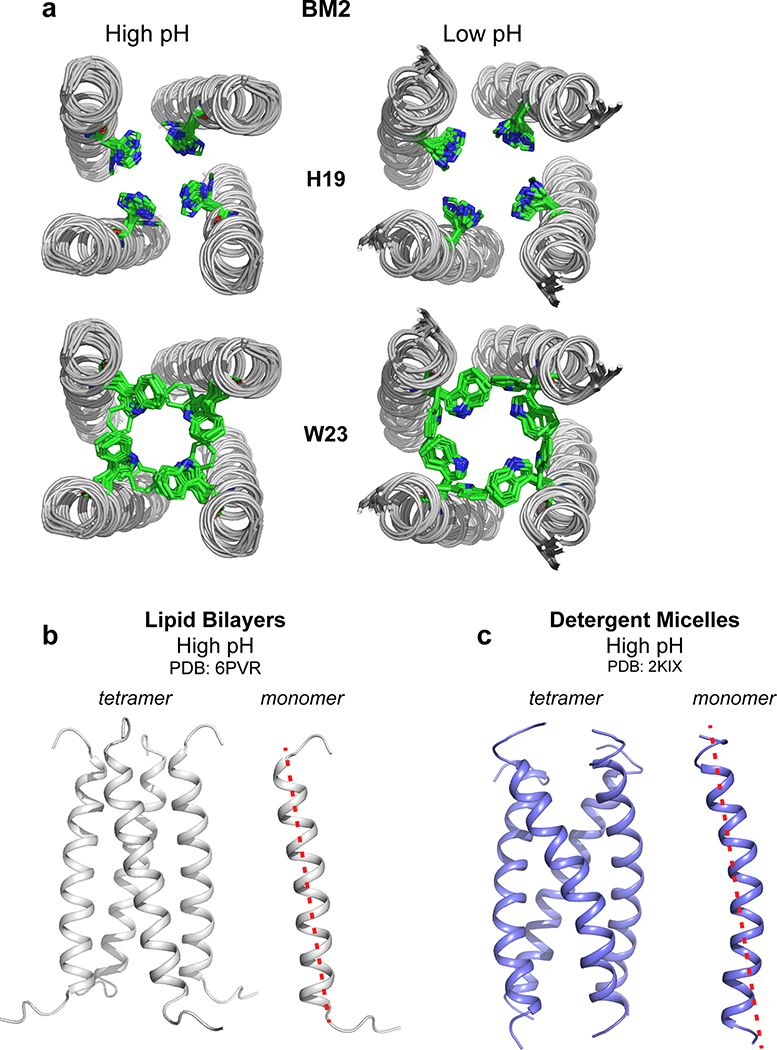
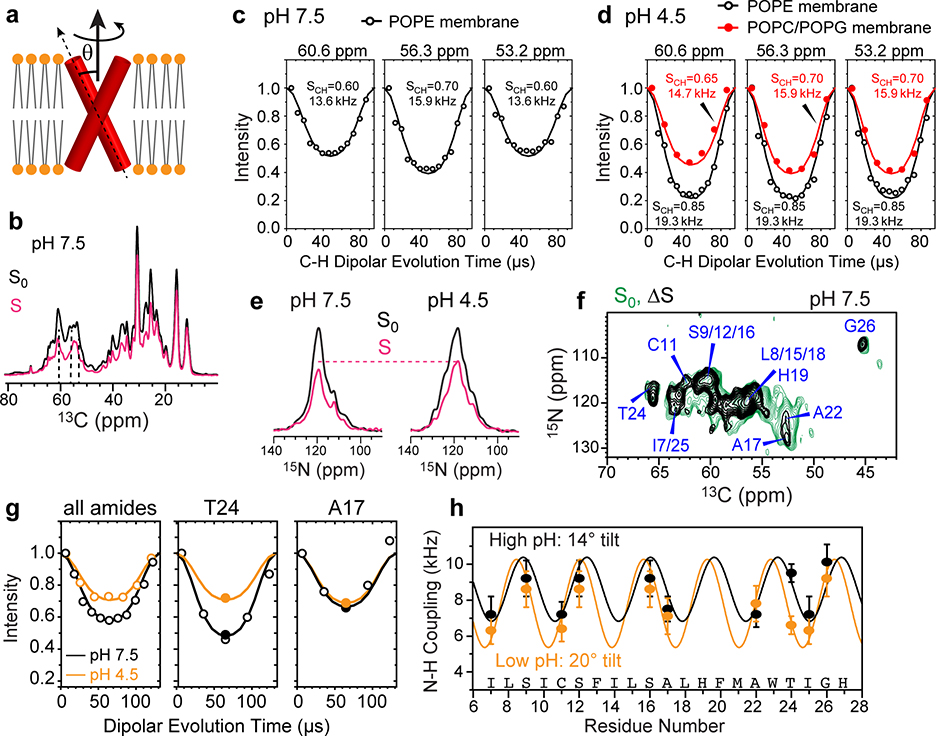
The influenza B M2 (BM2) proton channel is activated by acidic pH to mediate virus uncoating. Unlike influenza A M2 (AM2), which conducts protons with strong inward rectification, BM2 conducts protons both inward and outward. Here we report 1.4- and 1.5-Å solid-state NMR structures of the transmembrane domain of the closed and open BM2 channels in a phospholipid environment. Upon activation, the transmembrane helices increase the tilt angle by 6° and the average pore diameter enlarges by 2.1 Å. BM2 thus undergoes a scissor motion for activation, which differs from the alternating-access motion of AM2. These results indicate that asymmetric proton conduction requires a backbone hinge motion, whereas bidirectional conduction is achieved by a symmetric scissor motion. The proton-selective histidine and gating tryptophan in the open BM2 reorient on the microsecond timescale, similar to AM2, indicating that side chain dynamics are the essential driver of proton shuttling.


Conflict of interest statement

Competing interests

The authors declare no competing financial interests.

Figures

Extended Data Fig. 1
Extended Data Fig. 1. Purification and characterization of BM2(1–51).
(a) Amino acid sequences of the TM domain of AM2 and BM2. The conserved proton-selective histidine and the gating tryptophan are shown in red. The other pore-lining heptad a and d residues are polar in BM2 and hydrophobic in AM2 (blue) (b) SDS-PAGE gel showing Ni2+-affinity purification of SUMO-BM2. The flow through contains all soluble cellular proteins with low affinity for Ni2+. The column was washed with 50 mM imidazole, and SUMO-BM2 (18 kDa band) was eluted in two fractions at >90% purity with 300 mM imidazole. (c) Analytical reverse-phase HPLC chromatogram of BM2 before (black) and after (red) protease cleavage of the SUMO tag to give native BM2 at an elution time of 11.2 min. (d) MALDI mass spectrum of purified BM2(1–51), showing excellent agreement between the observed mass and the theoretical mass. (e) Circular dichroism spectrum of BM2 in 0.5% n-dodecylphosphocholine solution at pH 7.5. Spectral deconvolution indicates 60% α-helicity and 40% disordered or turn structures. (f) LC-MS total ion chromatogram of purified 4-19F-Phe5, 4-19F-Phe20 labeled synthetic BM2(1–51), showing excellent purity. (g) Deconvolution of extracted ion chromatogram of purified 4-19F-Phe5, 4-19F-Phe20 BM2. The measured molecular weight is in excellent agreement with the expected molecular weight.
Extended Data Fig. 2
Extended Data Fig. 2. Resonance assignment and inter-residue correlations of membrane-bound BM2 at pH 4.5.
(a) Representative strips of the NCACX (orange) and NCOCX (blue) regions of the 3D NCC spectrum to obtain sequential resonance assignment. The spectrum was measured at Tsample = 280 K. (b) Representative F2-F3 planes of the 3D CCC spectrum, showing various inter-residue correlations (assigned in red) that restrain the structure. The spectrum was measured using spin diffusion mixing times of 41 ms and 274 ms, at Tsample = 280 K. (c) 2D 13C-13C TOCSY spectrum with 7.7 ms mixing, collected at Tsample = 290 K. Residues 43–51 are dynamic and exhibit chemical shifts indicative of random coil conformation. (d) 1D 13C cross-polarization (CP) spectrum preferentially detects immobilized residues while the 13C INEPT spectrum preferentially detects highly dynamic residues. These 1D spectra were measured at Tsample = 280 K.
Extended Data Fig. 3
Extended Data Fig. 3. Resonance assignment and inter-residue correlations of membrane-bound BM2 at pH 7.5.
(a) 2D 13C-13C correlation spectrum with 55 ms CORD spin diffusion, measured at Tsample = 280 K. (b) Representative F2-F3 strips from the 3D CCC spectrum, showing various inter-residue correlations (assigned in red) that restrain the structure. The spectrum was measured using spin diffusion mixing times of 41 ms and 274 ms, at Tsample = 280 K. (c) 2D 13C-13C TOCSY spectrum with 7.7 ms mixing, collected at Tsample = 290 K. Residues 43–51 are dynamic and exhibit chemical shifts indicative of random coil conformation. (d) 13C CP spectrum preferentially detects immobilized residues while the 13C INEPT spectrum preferentially detects highly dynamic residues. These 1D spectra were measured at Tsample = 280 K.
Extended Data Fig. 4
Extended Data Fig. 4. Secondary structure of BM2 in the closed (high pH) and open (low pH) states.
(a) Cα (black) and Cβ (magenta) secondary chemical shifts at pH 7.5 and pH 4.5. (b) Chemical-shift derived (ϕ, ψ) torsion angles at pH 7.5 (black) and pH 4.5 (orange). At both pH, the TM domain is α-helical while the cytoplasmic tail is mostly disordered. In addition, a short β-strand segment is present at low pH. (c) Helical wheel representations of residues 48–63 in AM2 and the corresponding residues 29–44 in BM2. Hydrophobic residues are colored green, polar residues black, positively charged residues blue, and negatively charged residues red. AM2 has a separate hydrophobic face and a hydrophilic face, indicative of an amphipathic helix, while BM2 has alternating polar and non-polar residues, consistent with a β-strand conformation. (d) Static 31P spectra of BM2-containing POPE membrane at high and low pH and POPC/POPG membranes at low pH, all measured at a sample temperature of 303 K. At high pH the POPE membrane consists of ~65% bilayer and ~35% hexagonal phase. At low pH BM2 converts most of the POPE membrane to the hexagonal phase, but retains the lamellar form for the POPC/POPG membrane. Green dashed line is a superposition of 35% of the pH 4.5 POPE spectrum and 65% of the pH 4.5 POPC : POPG spectrum.
Extended Data Fig. 5
Extended Data Fig. 5. BM2 has similar conformations in POPE and POPC:POPG bilayers.
(a) 2D 13C-13C CORD spectra of BM2 in the two lipid membranes at low pH. (b) 2D 15N-13C correlation spectra of BM2 in the two lipid membranes at low pH. The POPE sample was measured at Tsample = 290 K for the 2D NC spectrum and 280 K for the 2D CC spectrum, while the POPC : POPG sample was measured at Tsample = 270 K to account for the lower phase transition temperature of this membrane. The lipid bilayers of both samples were in the gel phase, as assessed by 1H spectra of the sample. Both spectra were measured under 14 kHz MAS on an 800 MHz spectrometer. (c) Chemical shift differences between the POPE and POPC:POPG samples at low pH. Residues in the α-helical TM domain and the β-strand do not show significant chemical shift differences.
Extended Data Fig. 6
Extended Data Fig. 6. Measurement of BM2 helix orientation using rotationally averaged 15N-1H dipolar couplings.
(a-b) N-H DIPSHIFT data of the tripeptide formyl-MLF, measured at Tsample = 315 K using (a) 15N detection and (b) 13C detection. The dipolar-doubled version of DIPSHIFT is used in these experiments. The 15N-detected DIPSHIFT data were analyzed using the total intensities from the centerband and sidebands. The 13C-detected N-H couplings used a 15N-13C TEDOR mixing time of 2.11 ms. The 13C-detected N-H couplings are 0.9 times the 15N-detected values, indicating incomplete powder averaging. This scaling factor was included in determining the BM2 orientation from 13C-detected N-H dipolar couplings. (c) Calculated 15N-1H dipolar waves as a function of the helix tilt angle. An 18-residue ideal α-helix with (ϕ, ψ) angles of (−65˚, −40˚) were tilted from an external axis by 0°–30°. The 15N-1H dipolar couplings show the expected sinusoidal oscillations with a periodicity of 3.6 residues. The amplitude and offset of the dipolar wave indicate the helix tilt angle. (d) Reduced χ2 values of the measured and simulated 15N-1H dipolar couplings of membrane-bound BM2 at high and low pH. The minimum χ2 value is found at a tilt angle of 14˚ for high-pH BM2 and 20˚ for low-pH BM2. The ±2˚ uncertainty represents one standard deviation.
Extended Data Fig. 7
Extended Data Fig. 7. 13C-19F REDOR data for measuring interhelical distances of BM2 at high pH (black curves and filled symbols) and low pH (orange curves and open symbols).
The high pH data were measured at a sample temperature (Tsample) of 273 K, while the low pH data were measured at 261 K. Additional high-pH data measured at Tsample = 261 K (red symbols in some of the panels) are indistinguishable from 273 K data, confirming that the protein is immobilized at both temperatures. (a) N-terminal residues that are dephased by 4F-Phe5. (b) C-terminal residues whose dephasing is attributed to 4F-Phe20. All sites show less dephasing for the low-pH sample than the high-pH sample, indicating longer distances for the open channel. P4 has negligible dephasing at low pH. (c) Representative χ2 as a function of 13C-19F distance, showing the extraction of the best-fit distances and uncertainties. (d) Aromatic region of representative 13C-19F REDOR spectra of BM2 at high pH. The difference spectrum (ΔS) shows no dephasing for the 119-ppm W23 Cε3/ζ3/η2 peak (blue dashed line), indicating that 4F-Phe20 of the neighboring helix is far from these indole carbons. This is consistent with a W23 rotamer of t90 (χ1 = -125°, χ2 = 98°) but inconsistent with the mt rotamer (χ1=−80°, χ2=−177°).
Extended Data Fig. 8
Extended Data Fig. 8. HxxxW motif rotamers and comparison of the closed BM2 structures in lipid bilayers versus detergent micelles.
(a) Structural ensembles of H19 and W23 in the conserved HxxxW conduction motif at high pH (left) and low pH (right). The H19 χ1 is trans but the χ2 is not constrained well by experimental data. W23 predominantly adopts the t90 rotamer in both closed and open structural ensembles. (b-c) Comparison of the high-pH BM2 TM structure in lipid bilayers versus in detergent micelles. (b) Solid-state NMR structure determined here in POPE membranes. (c) Solution NMR structure determined in DHPC micelles .
Extended Data Fig. 9
Extended Data Fig. 9. Hydration of membrane-bound BM2.
(a) Aliphatic region of the 13C spectra measured with 100 ms (black) and 2 ms (red) 1H polarization transfer from water to the protein, measured at Tsample = 273 K. The low-pH protein shows higher intensities, indicating higher water accessibility. (b) Aromatic region of the 13C spectra also show significantly higher water-transferred intensities at low pH than high pH. (c) Water-to-protein polarization transfer curves for various residues. The buildup rates are faster at low pH (orange) than at high pH (black). (d) 1D 15N CP spectra of the H19 and H27 sidechains of BM2 at high and low pH, measured at Tsample = 280 K. The imidazole 15N signals are shifted 8–9 ppm downfield at low pH compared to high pH, indicating increased protonation of the histidines. (e) Control 2D 13C-13C correlation spectrum, measured using a 1H-1H spin diffusion time of 100 ms to allow water magnetization to equilibrate with the protein. The spectra were measured at Tsample = 273 K.
Extended Data Fig. 10
Extended Data Fig. 10. Pulse sequences of key 2D and 3D correlation experiments used for determining the structures of closed and open BM2 channels.
(a) 3D CCC experiment. The first 13C spin diffusion period is short to obtain intra-residue correlations while the second is long to obtain inter-residue cross peaks. (b) Water-edited 2D CC experiment. A selective 90˚ pulse excites the water 1H magnetization, a 1H T2 filter removes the rigid protein magnetization, then the water magnetization is transferred to the protein. Filled and open rectangles indicate 90° and 180° pulses, respectively. (c) 3D NCC experiment involving an out-and-back 15N-13C TEDOR period followed by 13C spin diffusion. The experiment simultaneously detects NCACX and NCOCX correlations. (d) Frequency-selective 13C-19F REDOR for distance measurements. (e) 3D NC-resolved N-H dipolar-doubled DIPSHIFT experiment for measuring helix orientations.
Figure 1.
Figure 1.
2D correlation solid-state NMR spectra indicate an α-helical TM domain for membrane-bound BM2. (a) Schematic of the key differences between ion channels and transporters. Open channels have a pore that is accessible to both sides of the lipid bilayer, whereas transporters are alternatingly accessible to one and the other side of the membrane. (b) 2D 13C-13C correlation spectrum of POPE-membrane bound BM2 at pH 4.5, measured at Tsample = 280 K. (c) 2D 15N-13Cα correlation spectrum of POPE-bound BM2 at pH 4.5 (orange) and pH 7.5 (grey), measured at Tsample = 290 K. (d) Residue-specific chemical shift differences between low and high pH. Most TM residues show negligible chemical shift changes, except for H19 and H27, which change their protonation states due to the pH change.
Figure 2.
Figure 2.
Determination of the helix orientation of BM2 in the closed (high pH) and open (low pH) states. (a) Schematic of orientation measurement using rotationally averaged N-H dipolar couplings. (b) Representative 13C cross sections of the 2D 13C-1H DIPSHIFT spectra of POPE-bound BM2 at high pH. The S0 and S spectra were extracted from cross sections with dipolar evolution times of 0 μs and 41 μs. The spectra were measured at Tsample = 315 K under 10.5 kHz MAS. (c) 13C-1H DIPSHIFT curves of the POPE-bound BM2 at pH 7.5. Order parameters of 0.6–0.7 are observed for Cα sites, consistent with whole-body motion. (d) 13C-1H DIPSHIFT curves of BM2 at pH 4.5. The POPE-bound protein shows high order parameters, indicating immobilization, whereas the POPC : POPG-bound protein shows low order parameters of 0.65–0.70, consistent with whole-body motion. (e) Full (S0) and dipolar-dephased (S) 15N spectra of membrane-bound BM2. The protein shows higher S/S0 ratios at low pH than at high pH, indicating weaker N-H dipolar couplings. The spectra were measured under 7.6 kHz MAS at Tsample = 315 K at high pH and 313 K at low pH. (f) Control (S0) and difference (ΔS) 2D 15N-13C spectrum of membrane-bound BM2 at pH 7.5. The difference spectrum was obtained by subtracting a 57-μs N-H dephased spectrum from the control spectrum. Higher difference intensities indicate larger N-H dipolar couplings. (g) N-H DIPSHIFT curves for all amide groups obtained from 1D 15N spectra and for two residues resolved in the 2D 15N-13C spectra. The dipolar dephasing is weaker at low pH than at high pH. (h) Residue-specific N-H dipolar couplings at high pH (black) and low pH (orange). The couplings are best fit to dipolar waves for helix tilt angles of 14° and 20°, respectively.
Figure 3.
Figure 3.
Determination of interhelical distances of membrane-bound BM2 using 13C-19F REDOR. (a) Schematic of mixed fluorinated and 13C-labeled protein for measuring interhelical distances. (b) Representative 1D 13C-19F REDOR control (S0) and dephased (S) spectra, whose difference (ΔS) shows the signals of 13C spins that are in close proximity to the fluorinated Phe5 and Phe20. The 13C-19F REDOR spectra were measured in gel-phase membranes at a Tsample of 273 K for the POPE-bound BM2 at high pH and 261 K for the POPC : POPG-bound protein at low pH. (c) Representative 13C-19F REDOR dephasing curves. Weaker dephasing is observed for the low-pH protein, indicating longer interhelical distances. The site overlap factor for each site is indicated.
Figure 4.
Figure 4.
Atomic structures of closed and open BM2 channels in lipid membranes. (a) Ensembles of ten lowest-energy structures, showing the backbones of all four helices and sidechains of one of the four helices. (b) Lowest-energy structure of the open channel, showing key sidechains along the pore. One of the four helices is omitted for clarity. (c) Solvent-excluded surface representations of closed (high pH) and open (low pH) BM2 and AM2 channels, viewed from the N-terminus (top view) and C-terminus (bottom view). Atoms coloring is green for carbons, white for hydrogens, red for oxygens, and blue for nitrogens. (d) C-terminal views of the channel pores and sidechain structures of six key residues in the closed and open BM2 and AM2. The open BM2 channel shows a larger N-terminal pore and tighter Trp gate compared to the open AM2. (e) Side view of the closed and open BM2 and AM2 channels, showing HOLE-calculated water-permeated pores. The average pore diameter for BM2 is 6.6 Å at high pH and 8.7 Å at low pH. (f) Pore diameters of BM2 and AM2 calculated using the HOLE program. The diameter of water molecules is shown as a green dashed line. Activation of BM2 enlarges the pore diameter along the entire channel axis, corresponding to a scissor motion, whereas activation of AM2 constricts the N-terminus while splaying the C-terminus, corresponding to a hinge motion.
Figure 5.
Figure 5.
Water accessibilities and sidechain motions of BM2 in the high-pH (closed) and low-pH (open) states. (a) Normalized water-edited 2D 13C-13C correlation spectra of BM2 at low and high pH, measured at Tsample = 273 K. The low-pH channel shows higher water-transferred intensities (blue contours) than the high-pH channel (red contours). (b) Intensity ratios of water-edited and full spectra. The low-pH channel shows higher intensities than the high-pH channel, and the C-terminus is more hydrated than the N-terminus. The intensities of resolved and overlapped signals are shown as closed and open symbols, respectively. Dashed lines indicate the average S/S0 values for the two pH conditions. (c) 2D 13C-13C correlation spectra of membrane-bound BM2 at Tsample = 280 K. H19 and W23 peaks are much weaker at low pH than at high pH, indicating that these residues are mobile in the open state. (d) Schematic of the larger water accessibility and increased HxxxW sidechain motions of BM2 at low pH. (e) Schematic models of AM2 and BM2’s backbone motion. AM2 undergoes an alternating-access hinge motion to conduct protons only inward, whereas BM2 undergoes a symmetric scissor motion to conduct protons both inward and outward.

Similar articles

Cited by

References

    1. Gadsby DC Ion channels versus ion pumps: the principal difference, in principle. Nat. Rev. Mol. Cell Biol 10, 344–352 (2009). - PMC - PubMed
    1. Mitchell P A general theory of membrane transport from studies of bacteria. Nature 180, 134–136 (1957). - PubMed
    1. Forrest LR, Krämer R & Ziegler C The structural basis of secondary active transport mechanisms. Biochim. Biophys. Acta 1807, 167–188 (2011). - PubMed
    1. Pinto LH & Lamb RA The M2 proton channels of influenza A and B viruses. J. Biol. Chem 281, 8997–9000 (2006). - PubMed
    1. Hong M & DeGrado WF Structural basis for proton conduction and inhibition by the influenza M2 protein. Prot. Sci 21, 1620–1633 (2012). - PMC - PubMed

Publication types