. 2020 Jan 1;16(3):529-542.
doi: 10.7150/ijbs.33007. eCollection 2020.

Empagliflozin Attenuates Hyperuricemia by Upregulation of ABCG2 via AMPK/AKT/CREB Signaling Pathway in Type 2 Diabetic Mice

Affiliations

Empagliflozin Attenuates Hyperuricemia by Upregulation of ABCG2 via AMPK/AKT/CREB Signaling Pathway in Type 2 Diabetic Mice

Yun-Hong Lu et al. Int J Biol Sci. .

Abstract

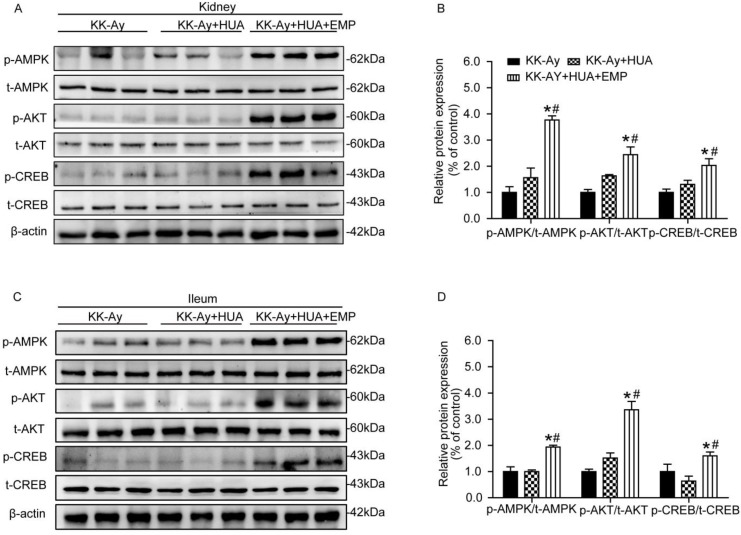
Hyperuricemia (HUA) is a metabolic disease characterized by elevated serum uric acid (SUA). Empagliflozin, a kind of sodium-glucose cotransporter 2 inhibitors, has recently emerged as a new antidiabetic agent by facilitating glucose excretion in urine. Moreover, there was evidence of SUA reduction following treatment with empagliflozin in addition to glycaemic control, while the molecular mechanisms remain unknown. To investigate the potential mechanisms, the model of type 2 diabetes (T2DM) with HUA was established by combination of peritoneal injection of potassium oxonate and intragastric administration of hypoxanthine in KK-Ay mice. A series of method such as RT-PCR, western blot, immunochemistry, immunofluorescence were conducted to explore the mechanism. Our results showed that empagliflozin significantly ameliorated the levels of SUA and blood glucose in T2DM mice with HUA. Furthermore, in both kidney and ileum, empagliflozin obviously promoted protein expression of uric acid (UA) transporter ABCG2, p-AMPK, p-AKT and p-CREB. The same trend was observed in human tubular epithelial (HK-2) cells. Additionally, through application of an AMPK inhibitor (Compound C), it was further confirmed empagliflozin exerted its anti-hyperuricemic effects in an AMPK dependent manner. Meanwhile, with the help of ChIP assay and luciferase reporter gene assay, we found that CREB further activated ABCG2 via binding to the promoter of ABCG2 to induce transcription. Taken together, our study demonstrated that empagliflozin treatment played an essential role in attenuating HUA by upregulation of ABCG2 via AMPK/AKT/CREB signaling pathway.

Keywords: ABCG2; AMPK; CREB; SGLT2; empagliflozin; hyperuricemia.


Conflict of interest statement

Competing Interests: The authors have declared that no competing interest exists.

Figures

Figure 1
Figure 1
Effects of empagliflozin on biochemical parameter alterations in KK-Ay mice with hyperuricemia. (A-E) Body weight, blood glucose, serum uric acid, urinary uric acid and FEUA in the KK-Ay group, KK-Ay+HUA group and KK-Ay +HUA+EMP group after 8 week-treatment with empagliflozin. There was no significant difference in body weight among the three groups, while empagliflozin treatment notably lowered blood glucose and serum uric acid levels and increased the urinary uric acid excretion and FEUA. One-way ANOVA followed by Tukey's test was applied to compare the differences between any two of three groups. The data are presented as the mean ± SEM (n = 5 for each group). *P < 0.05 vs. KK-Ay group; #P < 0.05 vs. KK-Ay+HUA group. KK-Ay, non-treated KK-Ay mice as control; KK-Ay+HUA, non-treated KK-Ay mice with hyperuricemia induced by combination of peritoneal injection of potassium oxonate at dose of 250mg/kg and intragastric administration of hypoxanthine at dose of 300mg/kg; KK-Ay+HUA+EMP, empagliflozin-treated KK-Ay mice with hyperuricemia induced by combination of peritoneal injection of potassium oxonate at dose of 250mg/kg and intragastric administration of hypoxanthine at dose of 300mg/kg. FEUA, fractional excretion of uric acid.
Figure 2
Figure 2
Effects of empagliflozin on histopathologic changes of kidney and ileum from KK-Ay mice with hyperuricemia. (A) Photomicrographs of kidney (original magnification × 400, bars = 50μm). KK-Ay+HUA group displayed tubular dilatation, hydropic degeneration and deposited mesangial matrix compared with mice in the KK-Ay group, however, those pathological features were significantly attenuated in the KK-Ay+HUA+EMP group. Red arrows indicate the tubular dilatation, blue arrows indicate the hydropic degeneration, and white arrows indicate deposited mesangial matrix. (B) Photomicrographs of ileum (original magnification × 400, bars = 50μm). Empagliflozin remarkably improved the histology of ileum in the KK-Ay +HUA+EMP group. Yellow arrows indicate abnormality of ileum. (C) Analysis of mesangial area expansion. One-way ANOVA followed by Tukey's test was applied to compare the differences between any two of three groups. The data are presented as the mean ± SEM (n = 5 for each group). *P < 0.05 vs. KK-Ay group; #P < 0.05 vs. KK-Ay+HUA group. KK-Ay, non-treated KK-Ay mice as control; KK-Ay+HUA, non-treated KK-Ay mice with hyperuricemia induced by combination of peritoneal injection of potassium oxonate at dose of 250mg/kg and intragastric administration of hypoxanthine at dose of 300mg/kg; KK-Ay+HUA+EMP, empagliflozin-treated KK-Ay mice with hyperuricemia induced by combination of peritoneal injection of potassium oxonate at dose of 250mg/kg and intragastric administration of hypoxanthine at dose of 300mg/kg. HE, hematoxylin-eosin staining; PAS, periodic acid-Schiff staining.
Figure 3
Figure 3
Effects of empagliflozin on uric acid transporters in kidney and ileum from KK-Ay mice with hyperuricemia. (A) Relative mRNA levels of ABCG2, OAT1, OAT3, GLUT9 and URAT1 in the kidney. Empagliflozin notably increased the mRNA levels of ABCG2 and significantly reduced the URAT1 mRNA compared with KK-Ay+HUA group in kidney, but had no effect on mRNA of OAT1, OAT3 and GLUT9 in kidney. (B-C) Relative mRNA levels of ABCG2 and GLUT9 in duodenum, jejunum and ileum. In ileum, empagliflozin remarkably up-regulated the mRNA levels of ABCG2. (D-E) Western blot and its analysis of ABCG2, OAT1, OAT3, GLUT9 and URAT1 protein expression in kidney. The protein levels of ABCG2, but not OAT1, OAT3, URAT1 or GLUT9 were obviously altered in the kidney after empagliflozin treatment. (F-G) Western blot and its analysis of ABCG2 and GLUT9 protein expression in ileum. Empagliflozin notably increased the protein levels of ABCG2, while did not significantly affect the expression of GLUT9 in ileum. (H-J) Immunochemistry staining of ABCG2 in kidney and ileum (original magnification × 400, bars = 100μm). ABCG2 levels were significantly increased in KK-Ay+HUA+EMP group. One-way ANOVA followed by Tukey's test was applied to compare the differences between any two of three groups. The data are presented as the mean ± SEM (n = 5 for each group). *P < 0.05 vs. KK-Ay group; #P < 0.05 vs. KK-Ay+HUA group. KK-Ay, non-treated KK-Ay mice as control; KK-Ay+HUA, non-treated KK-Ay mice with hyperuricemia induced by combination of peritoneal injection of potassium oxonate at dose of 250mg/kg and intragastric administration of hypoxanthine at dose of 300mg/kg; KK-Ay+HUA+EMP, empagliflozin-treated KK-Ay mice with hyperuricemia induced by combination of peritoneal injection of potassium oxonate at dose of 250mg/kg and intragastric administration of hypoxanthine at dose of 300mg/kg.
Figure 4
Figure 4
Effects of empagliflozin on AMPK/AKT/CREB/ signaling in kidney and ileum from KK-Ay mice with hyperuricemia. (A-B) Western blot and its analysis of p-AMPK, p-AKT and p-CREB in kidney. Levels of p-AMPK, p-AKT and p-CREB were obviously increased in KK-Ay+HUA+EMP group in kidney. (C-D) Western blot analysis of p-AMPK, p-AKT and p-CREB in ileum. Levels of p-AMPK, p-AKT and p-CREB were obviously increased in KK-Ay+HUA+EMP group in ileum. One-way ANOVA followed by Tukey's test was applied to compare the differences between any two of three groups. The data are presented as the mean ± SEM (n = 5 for each group). *P < 0.05 vs. KK-Ay group; #P < 0.05 vs. KK-Ay+HUA group. KK-Ay, non-treated KK-Ay mice as control; KK-Ay+HUA, non-treated KK-Ay mice with hyperuricemia induced by combination of peritoneal injection of potassium oxonate at dose of 250mg/kg and intragastric administration of hypoxanthine at dose of 300mg/kg; KK-Ay+HUA+EMP, empagliflozin-treated KK-Ay mice with hyperuricemia induced by combination of peritoneal injection of potassium oxonate at dose of 250mg/kg and intragastric administration of hypoxanthine at dose of 300mg/kg.
Figure 5
Figure 5
Effects of empagliflozin on uric acid transporters and AMPK/Akt/CREB signaling in cultured HK-2 cells. (A-B) Protein levels and analysis of ABCG2 were assessed by western blot. Levels of ABCG2 were significantly increased in HG+UA+EMP group compared with HG group and HG+UA group, while were decreased in HG+UA+ Compound C+EMP. (C-D) Phosphorylated levels and analysis of AMPK, AKT and CREB phosphorylation were assessed by western blot analysis. Empagliflozin significantly promoted phosphorylation of AMPK, AKT and CREB, which were blocked by Compound C. (E) Immunofluorescence staining of ABCG2 in HK-2 cells (original magnification × 100, bars = 10μm). Fluorescence intensity of ABCG2 was significantly increased in HG+UA+EMP group compared with HG group and HG+UA group, and was notably decreased in HG+UA+ Compound C+EMP. One-way ANOVA followed by Tukey's test was applied to compare the differences between any two of the four groups. The data are presented as the mean ± SEM (n = 3). *P < 0.05 vs. HG group; #P < 0.05 vs. HG+UA group; $P < 0.05 vs. HG+UA+EMP group. HG group, cells incubated in DMEM/HG medium; HG+UA group, cells incubated in UA (10mg/dl) added to DMEM/HG medium; HG+ HUA+EMP group, cells incubated in DMEM/HG medium with UA (10mg/dl) and treated with 50 μM empagliflozin; HG+UA+ Compound C group, cells incubated in DMEM/HG medium with UA (10mg/dl) , AMPK inhibitor Compound C (10μM) and empagliflozin (50 μM) for 48 hours.
Figure 6
Figure 6
CREB facilitated ABCG2 expression through promoter activation in HK-2 cells and HEK-293A cells. (A) A consensus motif, a possibly predicted site sequence used for CREB binding to ABCG2 promoter. (B-C) ChIP assays showed the binding of CREB to ABCG2 promoter in HK-2 cells. (D) ChIP assays showed the binding of CREB to ABCG2 promoter in HEK-293A cells. Two tailed, unpaired Student's t-test was applied in statistical analysis between two groups. The data are presented as the mean ± SEM (n = 3). *P < 0.05 vs. anti-IgG group. CREB plasmid, cells transfected with CREB plasmid.
Figure 7
Figure 7
Luciferase reporters in HEK-293A cells. (A-B) Relative DNA levels of ABCG2. ABCG2 was overexpressed compared with their blank negative control. (C-D) Western blot and analysis of CREB in HEK-293A cells. CREB was overexpressed compared with their blank negative control. (E) Luciferase reporter gene assays of HEK-293A cells transiently co-transfected with different groups. The luciferase activity in the group of ABCG2+CREB was significantly increased. (F) Mutation sequence from 511 to 518, 833 to 840 sites or both of the ABCG2 promoter region. (G) Luciferase reporter gene assays of HEK-293A cells transiently co-transfected with different mutants. 833 to 840 mutant-sites group showed significantly reduced luciferase activity. Two tailed, unpaired Student's t-test was applied in statistical analysis between two groups. One-way ANOVA followed by Tukey's test was applied to compare the differences between any two of the four groups. The data are presented as the mean ± SEM (n = 3). *P < 0.05 vs. ABCG2NC group; #P < 0.05 vs. CREBNC group; $P < 0.05 vs. ABCG2NC+CREBNC group; &P < 0.05 vs. ABCG2+CREBNC group; P < 0.05 vs. ABCG2NC+CREB group; P < 0.05 vs. ABCG2+CREB group. ABCG2NC, empty plasmid as control for ABCG2 promoter plasmid; ABCG2, ABCG2 promoter plasmid; CREBNC, empty plasmid as control for CREB plasmid; CREB, CREB plasmid; ABCG2NC+CREBNC, empty plasmids as control for ABCG2 promoter plasmid and empty plasmid as control for CREB plasmid; ABCG2+CREBNC, ABCG2 promoter plasmid and empty plasmid as control for CREB plasmid; ABCG2NC+CREB, empty plasmid as control for promoter ABCG2 promoter plasmid and CREB plasmid; ABCG2+CREB, ABCG2 promoter plasmid and CREB plasmid; ABCG2 mut511+CREB, mutation of the promoter at 511 to 518 sites in ABCG2 promoter region and CREB plasmid; ABCG2 mut833+CREB, mutation of the promoter at 833 to 840 sites and CREB plasmid; ABCG2 double mut511/833+CREB, mutation of the promoter at 511 to 518 sites and 833 to 840 sites and CREB plasmid.
Figure 8
Figure 8
Proposed mechanism of UA reduction by empagliflozin. Empagliflozin treatment improved hyperuricemia by promoting UA excretion through up-regulating ABCG2 expression in diabetes with hyperuricemia. Furthermore, empagliflozin treatment promoted the phosphorylation of AMPK, AKT and CREB and further activated ABCG2 by facilitating CREB binding to the promoter of ABCG2 to induce transcription.

References

    1. Komers R, Xu B, Schneider J, Oyama TT. Effects of xanthine oxidase inhibition with febuxostat on the development of nephropathy in experimental type 2 diabetes. British journal of pharmacology. 2016;173:2573–88. - PMC - PubMed
    1. Mantovani A, Rigolon R, Civettini A, Bolzan B, Morani G, Bonapace S. et al. Hyperuricemia is associated with an increased prevalence of paroxysmal atrial fibrillation in patients with type 2 diabetes referred for clinically indicated 24-h Holter monitoring. Journal of endocrinological investigation. 2018;41:223–31. - PubMed
    1. Woyesa SB, Hirigo AT, Wube TB. Hyperuricemia and metabolic syndrome in type 2 diabetes mellitus patients at Hawassa university comprehensive specialized hospital, South West Ethiopia. BMC endocrine disorders. 2017;17:76. - PMC - PubMed
    1. Ito H, Abe M, Mifune M, Oshikiri K, Antoku S, Takeuchi Y. et al. Hyperuricemia is independently associated with coronary heart disease and renal dysfunction in patients with type 2 diabetes mellitus. PloS one. 2011;6:e27817. - PMC - PubMed
    1. Bartakova V, Kuricova K, Pacal L, Nova Z, Dvorakova V, Svrckova M. et al. Hyperuricemia contributes to the faster progression of diabetic kidney disease in type 2 diabetes mellitus. Journal of diabetes and its complications. 2016;30:1300–7. - PubMed

Publication types

MeSH terms

Substances