. 2020 Feb;14(1):137-154.
doi: 10.1007/s11571-019-09559-4. Epub 2019 Oct 8.

Regulation and control roles of the basal ganglia in the development of absence epileptiform activities

Affiliations

Regulation and control roles of the basal ganglia in the development of absence epileptiform activities

Bing Hu et al. Cogn Neurodyn. 2020 Feb.

Abstract

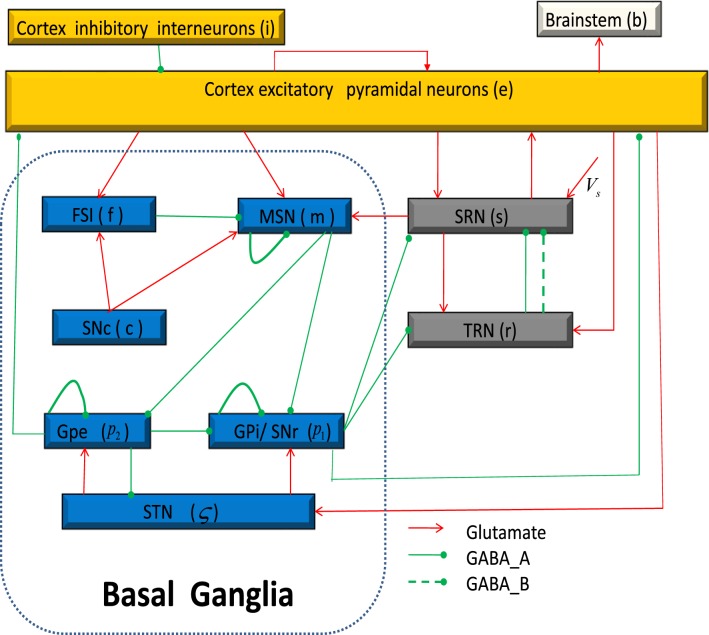
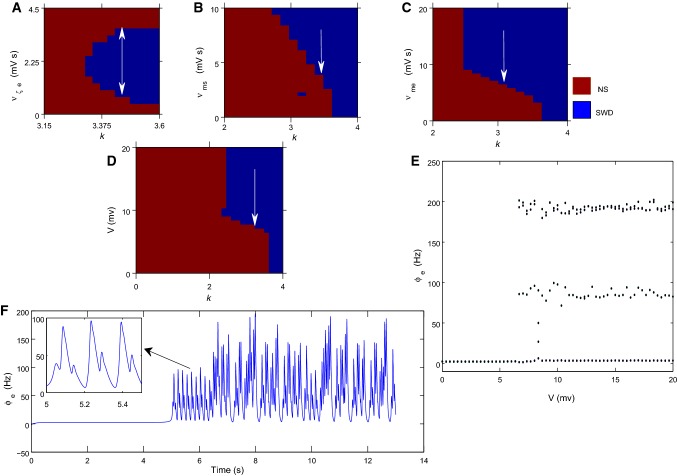
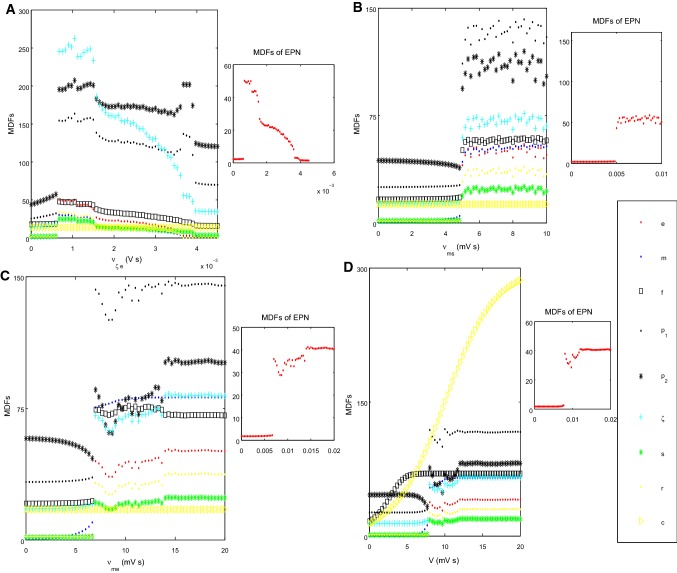
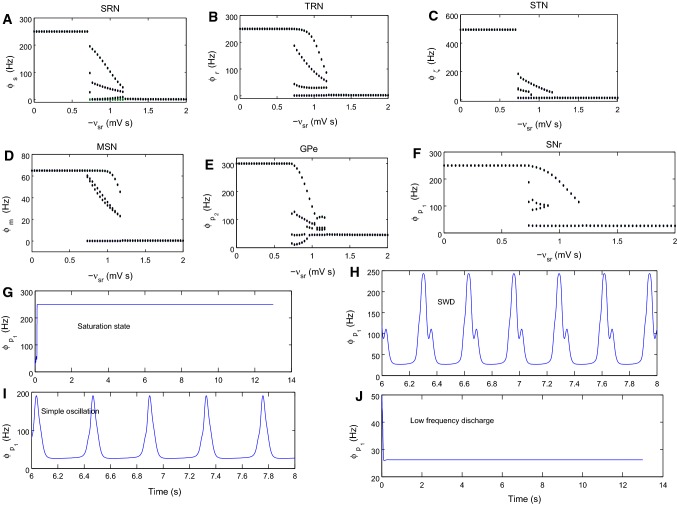
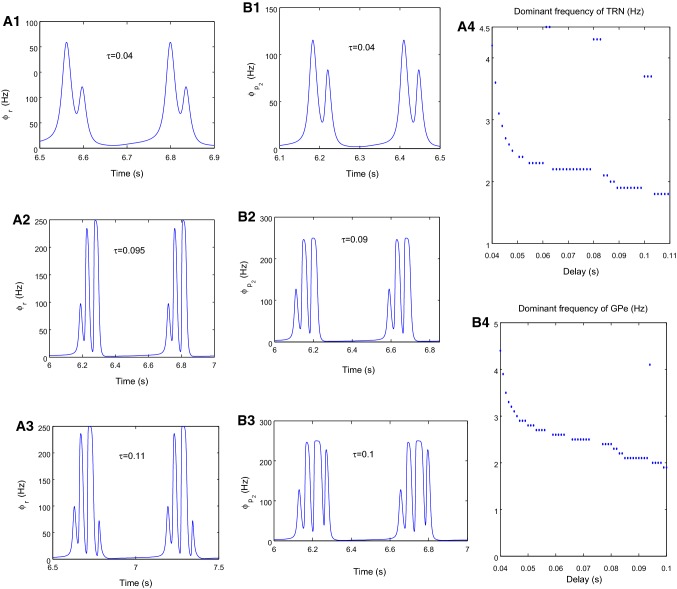
Absence epileptiform activities are traditionally considered to be primarily induced by abnormal interactions between the cortical and thalamic neurons, which form the thalamocortical circuit in the brain. The basal ganglia, as an organizational unit in the brain, has close input and output relationships with the thalamocortical circuit. Although several studies report that the basal ganglia may participate in controlling and regulating absence epileptiform activities, to date, there have been no studies regarding whether the basal ganglia directly cause absence epileptiform activities. In this paper, we built a basal ganglia-corticothalamic network model to determine the role of basal ganglia in this disease. We determined that absence epileptiform activities might be directly induced by abnormal coupling strengths on certain pivotal pathways in the basal ganglia. These epileptiform activities can be well controlled by the coupling strengths of three major pathways that project from the thalamocortical network to the basal ganglia. The results implied that the substantia nigra pars compacta (SNc) can be considered to be the effective treatment target area for inhibiting epileptiform activities, which supports the observations of previous studies. Particularly, as a major contribution of this paper, we determined that the final presentation position of the epileptic slow spike waves is not limited to the cerebral cortex; these waves may additionally appear in the thalamus, striatal medium spiny neurons, striatal fast spiking interneuron, the SNc, subthalamic nucleus, substantia nigra pars reticulata and globus pallidus pars externa. In addition, consistent with several previous studies, the delay in the network was observed to be a critical factor for inducing transitions between different types of absence epileptiform activities. Our new model not only explains the onset and control mechanism but also provides a unified framework to study similar problems in neuron systems.

Keywords: Absence epileptiform activities; Basal ganglia; Onset and control; State transition; Thalamocortical circuit.


Figures

Fig. 1
Fig. 1
Schematic diagram of the model. Neural populations are denoted as follows, e = excitatory pyramidal neurons; i = inhibitory interneurons; r = thalamic reticular nucleus; s = specific relay nuclei; m = medium spiny neurons; f = striatal fast spiking interneuron; p1= substantia nigra pars reticulata; p2= globus pallidus external segment; ζ = subthalamic nucleus; c = substantia nigra pars compacta; b = brainstem. The arrows represent excitatory inputs adjusted by glutamate, the solid dots indicate inhibitory projections regulated by gamma-aminobutyric acid, and the dotted line in the “TRNSRN” pathway denotes the second messenger processes mediated by GABAB receptors. Vs represents the sensory stimuli of specific relay nuclei projected from the brainstem, which is considered to be a constant in this model. The brainstem organization is not a critical population considered in our study
Fig. 2
Fig. 2
Absence epileptiform activities induced by the strength of -νrp1 and -νsp1, which are two projection strengths from the SNr to the TRN and SRN, respectively. a A bifurcation diagram of ϕe with a variation in -νrp1, which pushes the EPN from the low firing state (NS) to the absence epileptiform activity state; -νsp1 is set as 0.01mV s. b A bifurcation diagram of ϕe with an increase in -νsp1, which pushes the EPN from the absence epileptiform activity state to the NS, and here, -νsp1 is considered to be 0.15mV s. c The state bifurcation diagram of ϕe in the two-dimensional parametric plane (-νrp1,-νsp1) derived from a and b. With change in -νrp1 and -νsp1, the EPN has two states: the NS and absence epileptiform activity state, which are distinguished by two different colours. d The dominant frequency analysis corresponds to c, and the epileptic area is denoted by “SWD”. We observe that the epileptiform activity frequency nearly falls in the range of 2–4 Hz and is clearer in e, which was obtained by setting -νsp1=0.01mV s. fi Four specific time series diagrams obtained by setting -νsp1=4.8mV s,-νrp1=0.18mV s in f; -νsp1=0.06mV s,-νrp1=0.15mV s in g; -νsp1=0.02mV s,-νrp1=0.175mV s in h; -νsp1=0.01mV s,-νrp1=0.16mV s in i; respectively. Here, f represents the NS and gi represent the epileptiform activity state. (Color figure online)
Fig. 3
Fig. 3
State transition diagram of the EPN induced by several pathways related to the BG. In all of the simulations, we set -νrp1=0.135mV s (a), -νrp1=0.12mV s (b), -νrp1=0.12mV s (c),-νrp1=0.075mV s (d), -νrp1=0.135mV s (e), -νrp1=0.12mV s (f), -νrp1=0.108mV s (g), -νrp1=0.12mV s (h), -νrp1=0.108mV s (i), -νrp1=0.108mV s (j), -νrp1=0.111mV s (k), -νrp1=0.09mV s (l), -νrp1=0.105mV s (m) and -νrp1=0.12mV s (n), respectively
Fig. 4
Fig. 4
The MDFs of the EPN varied with various coupling strengths, corresponding to Fig. 3
Fig. 5
Fig. 5
The controlling effect of epileptiform activities. ac State regional bifurcation diagrams on the two-dimensional parametric plane (k,νζe), (k,νms) and (k,νme), respectively. k is a scale factor defined as -νrp1=-kνsp1. νζe,νms and νme are three major pathways projected from the corticothalamic system to the BG. The SWDs can be inhibited by altering νζe,νms and νme within a suitable range, as indicated by arrows in a to c. d The state bifurcation diagram in the plane (k, V). V is an external voltage exerted on the SNc. It is demonstrated that the epileptiform activities disappeared by reducing the voltage strength. e, f The state bifurcation diagram and time series bifurcation diagram obtained by setting k = 3.5
Fig. 6
Fig. 6
MDFs of all of the populations from Fig. 5a–d, which were obtained by setting k=3.5 (Fig. 5a), k=3.35 (Fig. 5b), k=3 (Fig. 5c) and k=3 (Fig. 5e), respectively
Fig. 7
Fig. 7
af State bifurcation diagrams of the population SRN, TRN, STN, MSN, GPe and GPi. -νsr is the changing parameter considered here. gj Four specific time sequence diagrams corresponding to f, which were obtained by setting -νsr=0.2mV s,-νsr=0.8mV s,-νsr=1mV s and -νsr=1.8mV s, respectively. They represent the saturated state, epileptic state, simple oscillation state and low frequency firing state of the brain
Fig. 8
Fig. 8
Multipole attack phenomenon on the TRN and GPe induced by delay. In all of the simulations, we set -νsr=1mV s in a1a4 and -νsr=0.9mV s in b1b4

Similar articles

Cited by

References

    1. Arakaki T, Mahon S, Charpier S, Leblois A, Hansel D. The role of striatal feedforward inhibition in the maintenance of absence seizures. J Neurosci. 2016;36(37):9618–9632. - PMC - PubMed
    1. Biraben A, Semah F, Ribeiro MJ, Douaud G, Remy P, Depaulis A. PET evidence for a role of the basal ganglia in patients with ring chromosome 20 epilepsy. Neurology. 2004;63(1):73–77. - PubMed
    1. Bogacz R (2015) Basal Ganglia: beta oscillations. In: Jaeger D, Jung R (eds) Encyclopedia of Computational Neuroscience. Springer, New York, NY, pp 327–330
    1. Bonhaus DW, Walters JR, McNamara JO. Activation of substantia nigra neurons: role in the propagation of seizures in kindled rats. J Neurosci. 1986;6(10):3024–3030. - PMC - PubMed
    1. Breakspear M, Roberts JA, Terry JR, Rodrigues S, Mahant N, Robinson PA. A unifying explanation of primary generalized seizures through nonlinear brain modeling and bifurcation analysis. Cereb Cortex. 2005;16(9):1296–1313. - PubMed

LinkOut - more resources