. 2019 Sep 11;10(42):9872-9879.
doi: 10.1039/c9sc02079a. eCollection 2019 Nov 14.

Ureidopeptide GLP-1 analogues with prolonged activity in vivo via signal bias and altered receptor trafficking

Affiliations

Ureidopeptide GLP-1 analogues with prolonged activity in vivo via signal bias and altered receptor trafficking

Juliette Fremaux et al. Chem Sci. .

Abstract

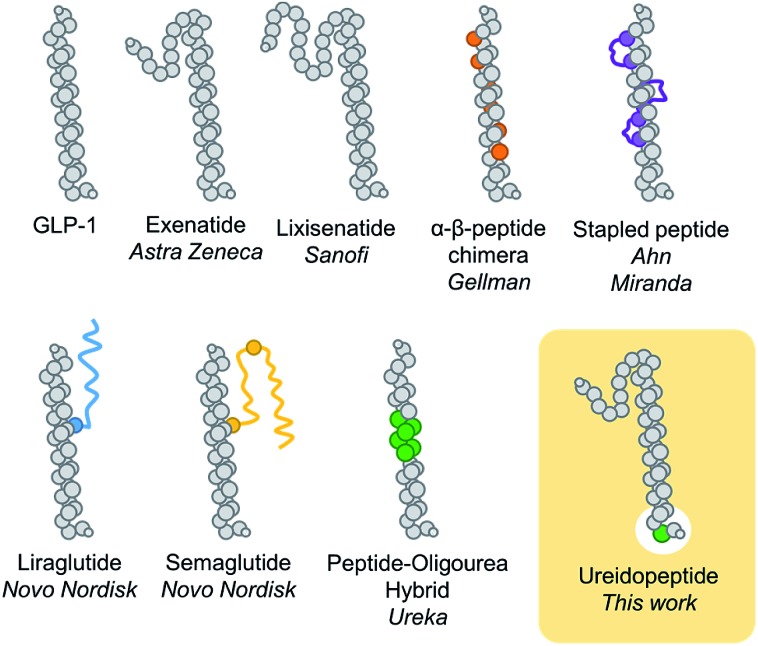
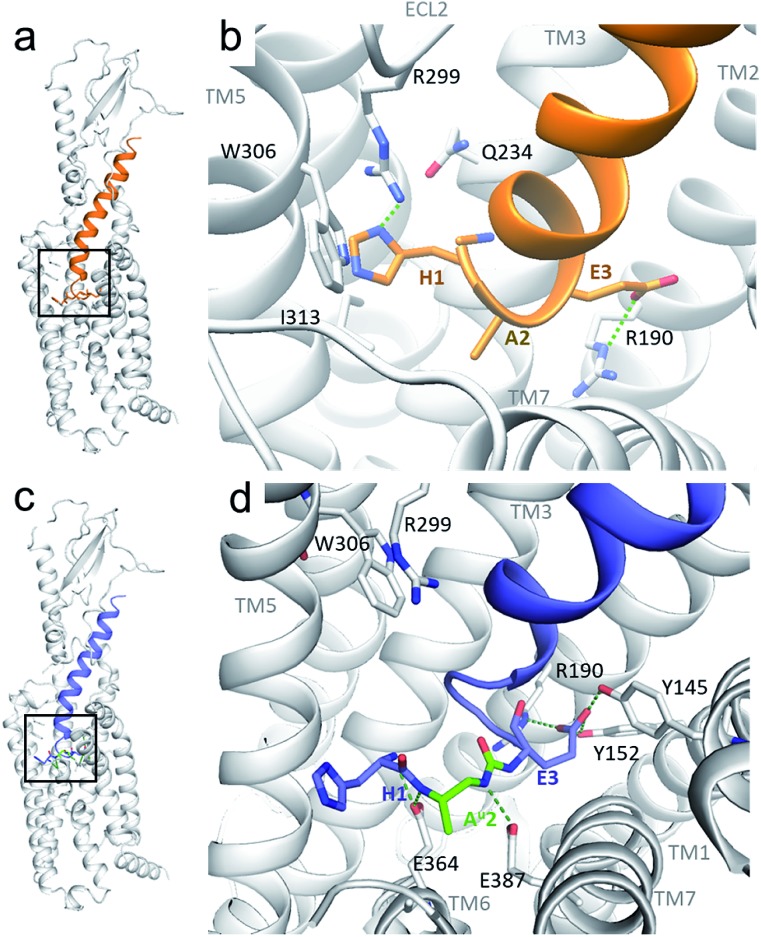
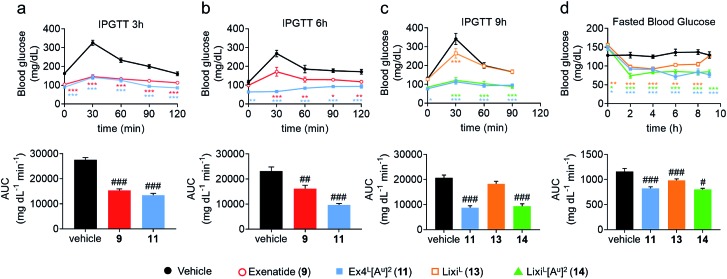
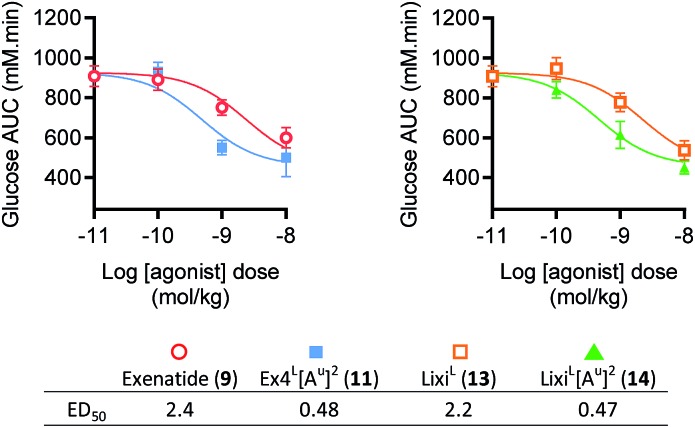
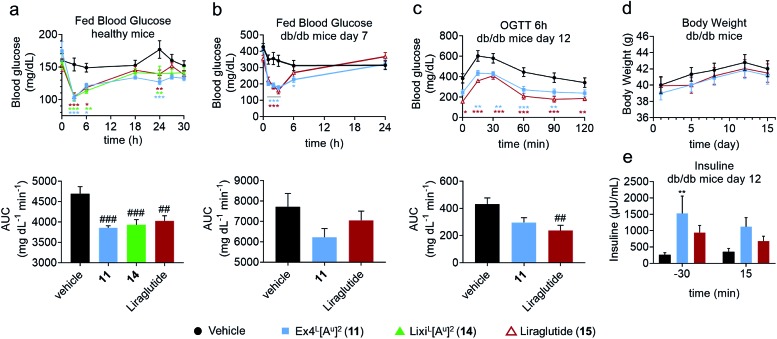
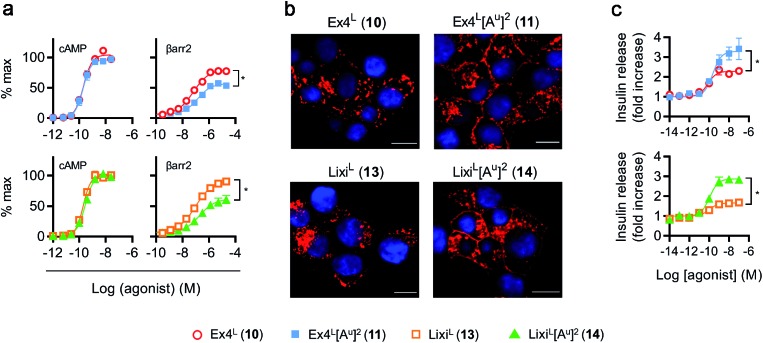
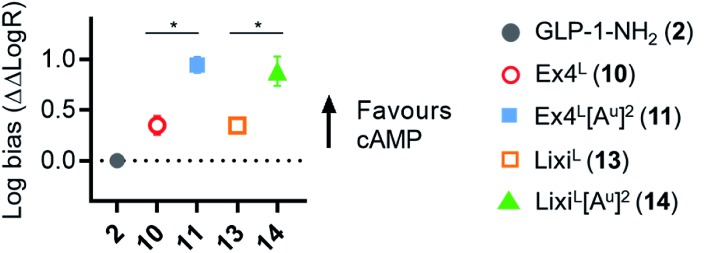
The high demand of the pharmaceutical industry for new modalities to address the diversification of biological targets with large surfaces of interaction led us to investigate the replacement of α-amino acid residues with ureido units at selected positions in peptides to improve potency and generate effective incretin mimics. Based on molecular dynamics simulations, N-terminally modified GLP-1 analogues with a ureido residue replacement at position 2 were synthesized and showed preservation of agonist activity while exhibiting a substantial increase in stability. This enabling platform was applied to exenatide and lixisenatide analogues to generate two new ureidopeptides with antidiabetic properties and longer duration of action. Further analyses demonstrated that the improvement was due mainly to differences in signal bias and trafficking of the GLP-1 receptor. This study demonstrates the efficacy of single α-amino acid substitution with ureido residues to design long lasting peptides.


Figures

Fig. 1
Fig. 1. Schematic representation of different GLP-1 analogues previously reported and the present approach (ureidopeptide). GLP-1 analogue modifications are highlighted in colour; orange: β-amino acids, purple: macrocycles, blue and yellow: lipidation, green: ureido residue.
Fig. 2
Fig. 2. Predicted structure of the GLP-1R/GLP-1[Au]2 complex compared to the cryo-EM structure of the GLP-1R/GLP-1 complex. (a and b) GLP-1 (in orange) in the GLP-1R TMD and an enlarged image (b) of the N-terminal part (extracted from the cryo-EM structure of the GLP-1R/GLP-1 complex (PDB ; 5VAI)); (c and d) predicted structure of GLP-1[Au]2 (3) (in blue with Alau2 in green) in the GLP-1R TMD and an enlarged image (d) of the N-terminal part.
Fig. 3
Fig. 3. Pharmacodynamic studies in healthy mice (C57BL/6J, male, 20–25 g). Dosage: 1 μg per mouse (10 nmol kg–1) i.v. Formulation: 4 μg mL–1 in PBS 1×. IPGTT: glucose 2 g kg–1 i.p. at T0. (a) IPGTT 3 h after dosing: trace and AUC. Fasted 6 h. (b) IPGTT 6 h after dosing: trace and AUC. Fasted 6 h. (c) IPGTT 9 h after dosing: trace and AUC. Fasted 9 h. (d) Fasted blood glucose before and after dosing and before the IPGTT 9 h in (c). Data are mean ± SEM (n = 6). Statistics by two-way ANOVA and Bonferroni post-test: *p < 0.05, **p < 0.01, ***p < 0.001, comparing the vehicle to oligomers; one way ANOVA with Dunnett's multiple comparison test: #p < 0.05, ##p < 0.01, ###p < 0.001, comparing the vehicle to oligomers. IPGTT: intraperitoneal glucose tolerance test; AUC: area under the curve; i.v.: intra venous; i.p.: intra peritoneal.
Fig. 4
Fig. 4. Dose–response relationships of exenatide (9), LixiL (13) and their putative ureidopeptides Ex4L[Au]2 (11) and LixiL[Au]2 (14) in healthy mice (C57BL/6J, male, 25–30 g). Dose response relationships from IPGTT results shown in the ESI, Fig. S4, 3-parameter fits of area-under-curve values (n = 8). Dosage and formulation: 0.01 to 10 nmol kg–1 in 100 μL saline i.p. Fasted 4 h prior to agonist administration. IPGTT (2 mmol kg–1 glucose) performed 6 hours after administration of indicated agonist dose in lean C57Bl/6 mice. Data are mean ± SEM.
Fig. 5
Fig. 5. Comparative pharmacodynamics of Ex4L[Au]2 (11), LixiL[Au]2 (14) and liraglutide (15) in mice. (a) Fed blood glucose in healthy mice (C57BL/6J, male, 20–25 g): trace and AUC (n = 6). Dosage: 1 μg per mouse (10 nmol kg–1) i.v. Formulation: 4 μg mL–1 in PBS 1×. (b–e) Study on db/db mice treated over 15 days (n = 10). Dosage: 100 μg kg–1 (25 nmol kg–1) s.c. once a day (n = 10). Formulation: 20 μg mL–1 in PBS 1×. (b) Fed blood glucose before and after treatment on day 7: trace and AUC. (c) OGTT 6 hours after dosing on day 12: trace and AUC. OGTT: glucose 1 g kg–1 i.p. at T0. (d) Body weight across the study. (e) Plasma insulin before and after the OGTT on day 12. Data are mean ± SEM. Statistics by two-way ANOVA and Bonferroni post-test: *p < 0.05, **p < 0.01, ***p < 0.001, comparing the vehicle to oligomers; one way ANOVA with Dunnett's multiple comparison test: #p < 0.05, ##p < 0.01, ###p < 0.001, comparing the vehicle to oligomers. IPGTT: intraperitoneal glucose tolerance test; AUC: area under the curve; i.v.: intra venous; s.c.: subcutaneous; i.p.: intra peritoneal.
Fig. 6
Fig. 6. GLP-1R biased signalling and trafficking studies. (a) Cyclic AMP (cAMP) and β-arrestin-2 (βarr2) responses in PathHunter CHO–GLP-1R cells, 30 min stimulation, all ligands and pathways run in parallel, results normalized to global maximum responses (cAMP) or GLP-1–NH2 (2) maximal response (βarr2), 4-parameter fit shown, n = 5 independent experiments. (b) Confocal analysis of SNAP-GLP-1R internalization in SNAP-GLP-1R-expressing INS-1 832/3 cells labeled with SNAP-Surface 549 probe (red) for 30 min and then stimulated with 10 nM of the indicated ligand for a further 30 min. Nuclei (DAPI), blue; size bars, 10 μm. (c) Insulin secretion in INS-1 832/3 cells, 16 h stimulation at 11 mM glucose, all ligands run in parallel, normalised to basal response in each assay, 3-parameter fit shown, n = 5 independent experiments, Emax compared by 2-way repeat measures ANOVA with Tukey's test.
Fig. 7
Fig. 7. GLP-1R biased signalling. Signal bias calculated from the data shown in Fig. 6a, expressed relative to GLP-1–NH2 (2), determined using a modified form of the operational model (see Methods for details†), and 1-way randomised block ANOVA with Tukey's test of difference between Log R values for cAMP vs. β-arrestin-2 responses for each ligand.

References

    1. Erak M., Bellmann-Sickert K., Els-Heindl S., Beck-Sickinger A. G. Bioorg. Med. Chem. 2018;26:2759–2765. - PubMed
    1. Valeur E., Guéret S. M., Adihou H., Gopalakrishnan R., Lemurell M., Waldmann H., Grossmann T. N., Plowright A. T. Angew. Chem., Int. Ed. 2017;56:10294–10323. - PubMed
    1. Chingle R., Proulx C., Lubell W. D. Acc. Chem. Res. 2017;50:1541–1556. - PubMed
    1. Zhang Y., Malamakal R. M., Chenoweth D. M. J. Am. Chem. Soc. 2015;137:12422–12425. - PubMed
    1. Johnson L. M. and Gellman S. H., in Methods in Enzymology, Elsevier, 2013, vol. 523, pp. 407–429. - PMC - PubMed